60 documents found
Tourism in Spain: Analyzing National Tourist Flows Using Interactive Visualizations
1. Introduction
Visualizations are graphical representations of data that allow for the simple and effective communication of information linked to them. The possibilities for visualization are very broad, from basic representations such as line graphs, bar charts or relevant metrics, to…
- Data exercises

How to use OGC APIs to enhance geospatial data interoperability
In a world where geospatial information is crucial to address global challenges such as climate change and natural resource management, interoperability and the creation of standards are essential. Interoperability facilitates collaboration between organisations, drives innovation and ensures that…
- Guides

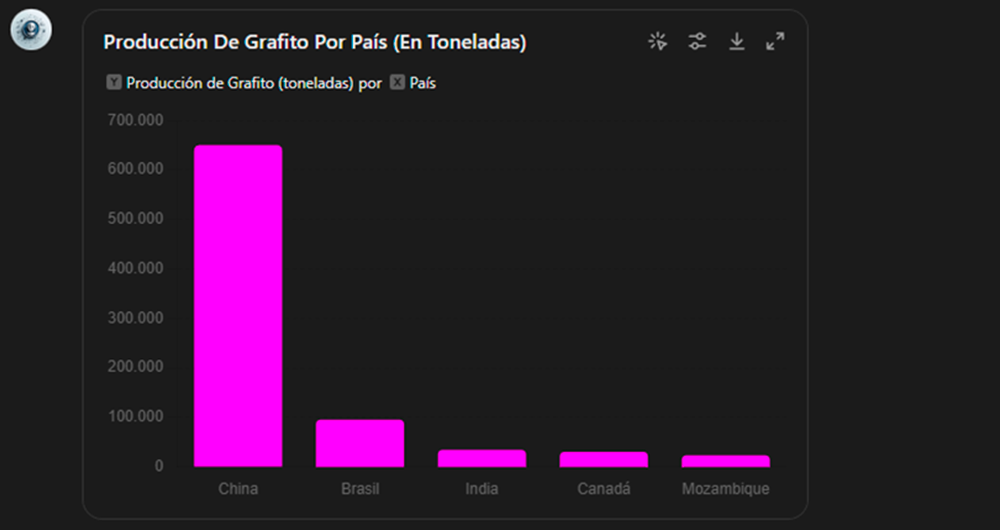
How to Create an Expert Assistant with Open Data: Building GPT to Answer the Critical Minerals Challenge
1. Introduction
In the information age, artificial intelligence has proven to be an invaluable tool for a variety of applications. One of the most incredible manifestations of this technology is GPT (Generative Pre-trained Transformer), developed by OpenAI. GPT is a natural language model…
- Data exercises
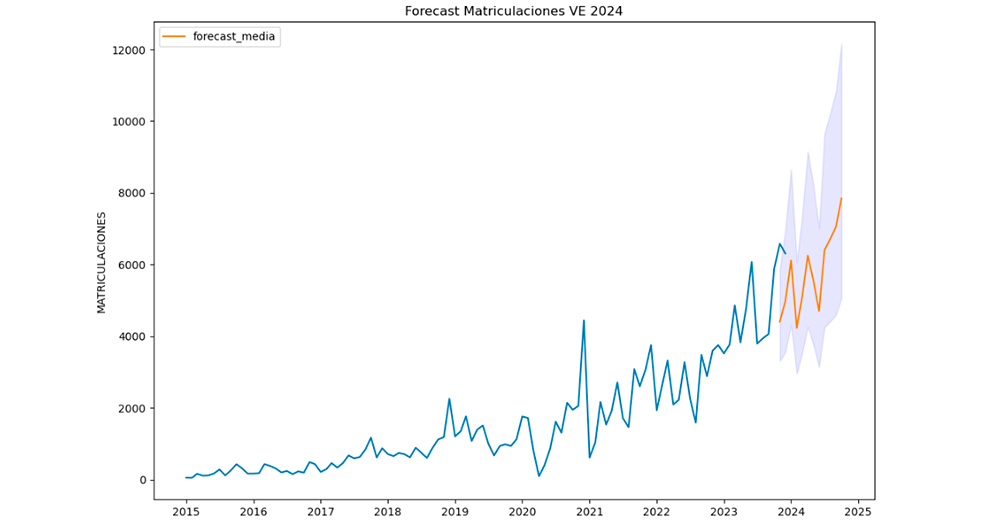
Road to electrification: Deciphering electric vehicle growth in Spain through data analytics
1. Introduction
Visualisations are graphical representations of data that allow to communicate, in a simple and effective way, the information linked to the data. The visualisation possibilities are very wide ranging, from basic representations such as line graphs, bar charts or relevant metrics,…
- Data exercises
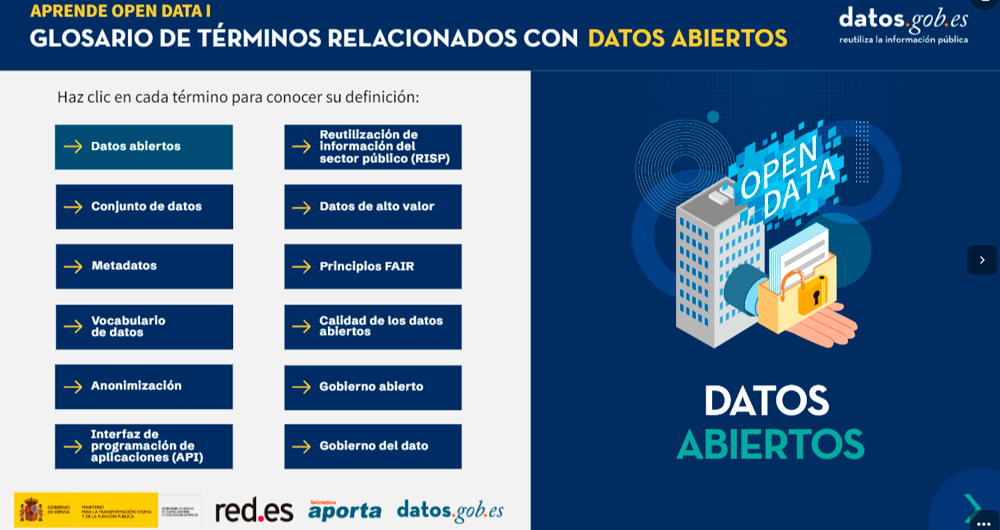
Glossary of data-related terms
The following is a definition of various terms regarding data and related technologies.
1. Glossary of terms related to open data.
(You can download the accessible version here)
2. Glossary of terms related to new technologies and data
(You can download the accessible version…
- Guides
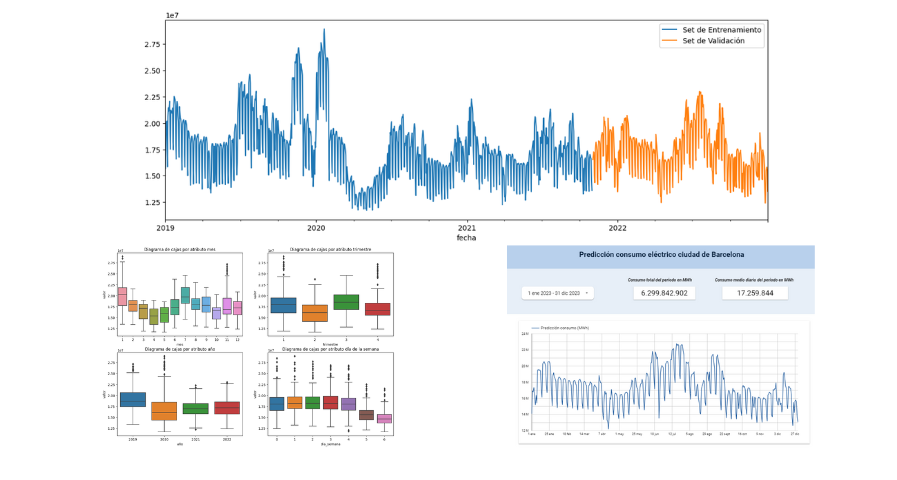
Predictive analisys of electric consuption in the city of Barcelona
1. Introduction
Visualizations are graphical representations of data that allow you to communicate, in a simple and effective way, the information linked to it. The visualization possibilities are very extensive, from basic representations such as line graphs, bar graphs or relevant metrics, to…
- Data exercises
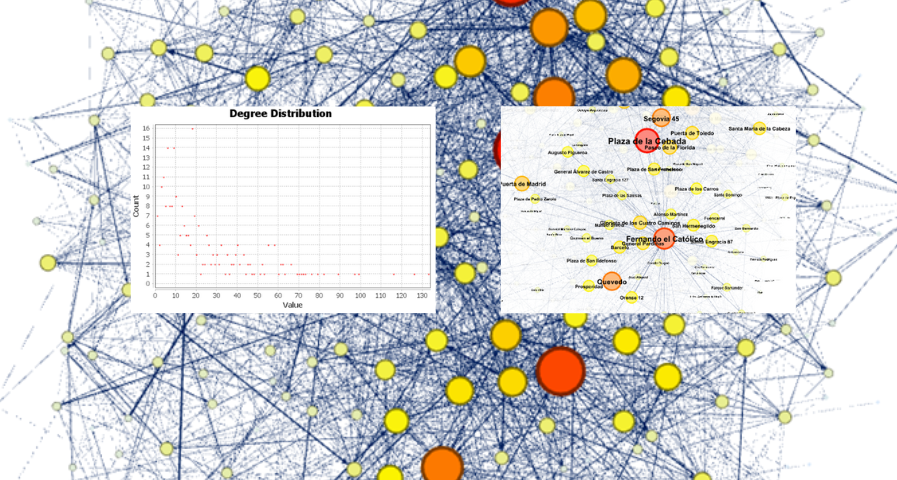
Analysis of travel networks in BICIMAD
1. Introduction
Visualizations are graphical representations of data that allow the information linked to them to be communicated in a simple and effective way. The visualization possibilities are very wide, from basic representations, such as line, bar or sector graphs, to visualizations…
- Data exercises
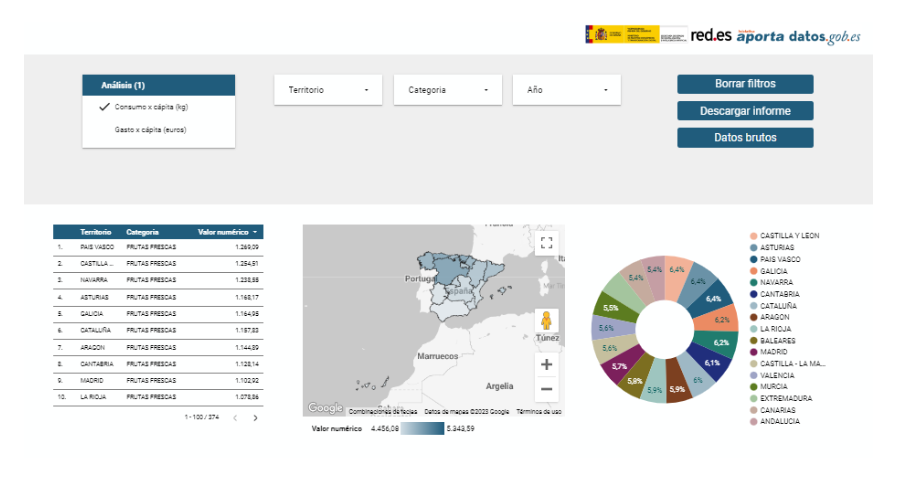
Study on nutrition in spanish homes
1. Introduction
Visualizations are graphical representations of data that allow the information linked to them to be communicated in a simple and effective way. The visualization possibilities are very wide, from basic representations, such as line, bar or sector graphs, to visualizations…
- Data exercises
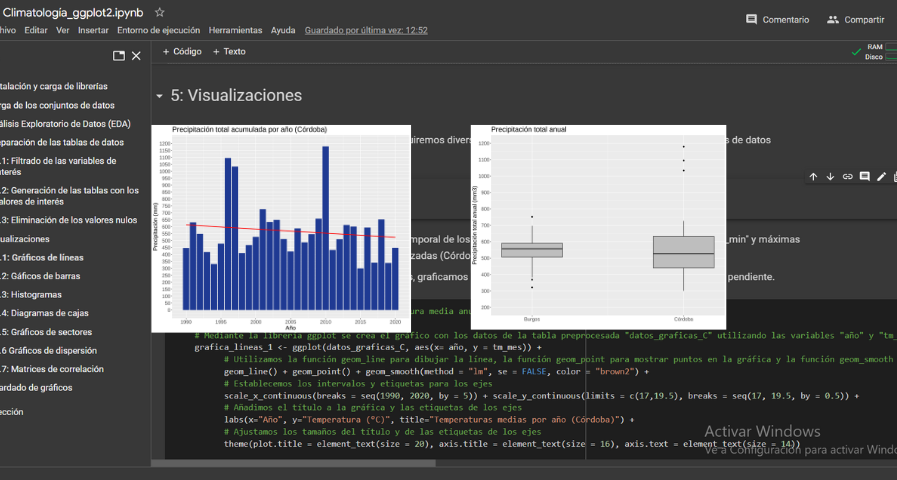
Analysis of meteorological data using the "ggplot2" library
1. Introduction
Visualizations are graphical representations of data that allow the information linked to them to be communicated in a simple and effective way. The visualization possibilities are very wide, from basic representations, such as a line chart, bars or sectors, to visualizations…
- Data exercises
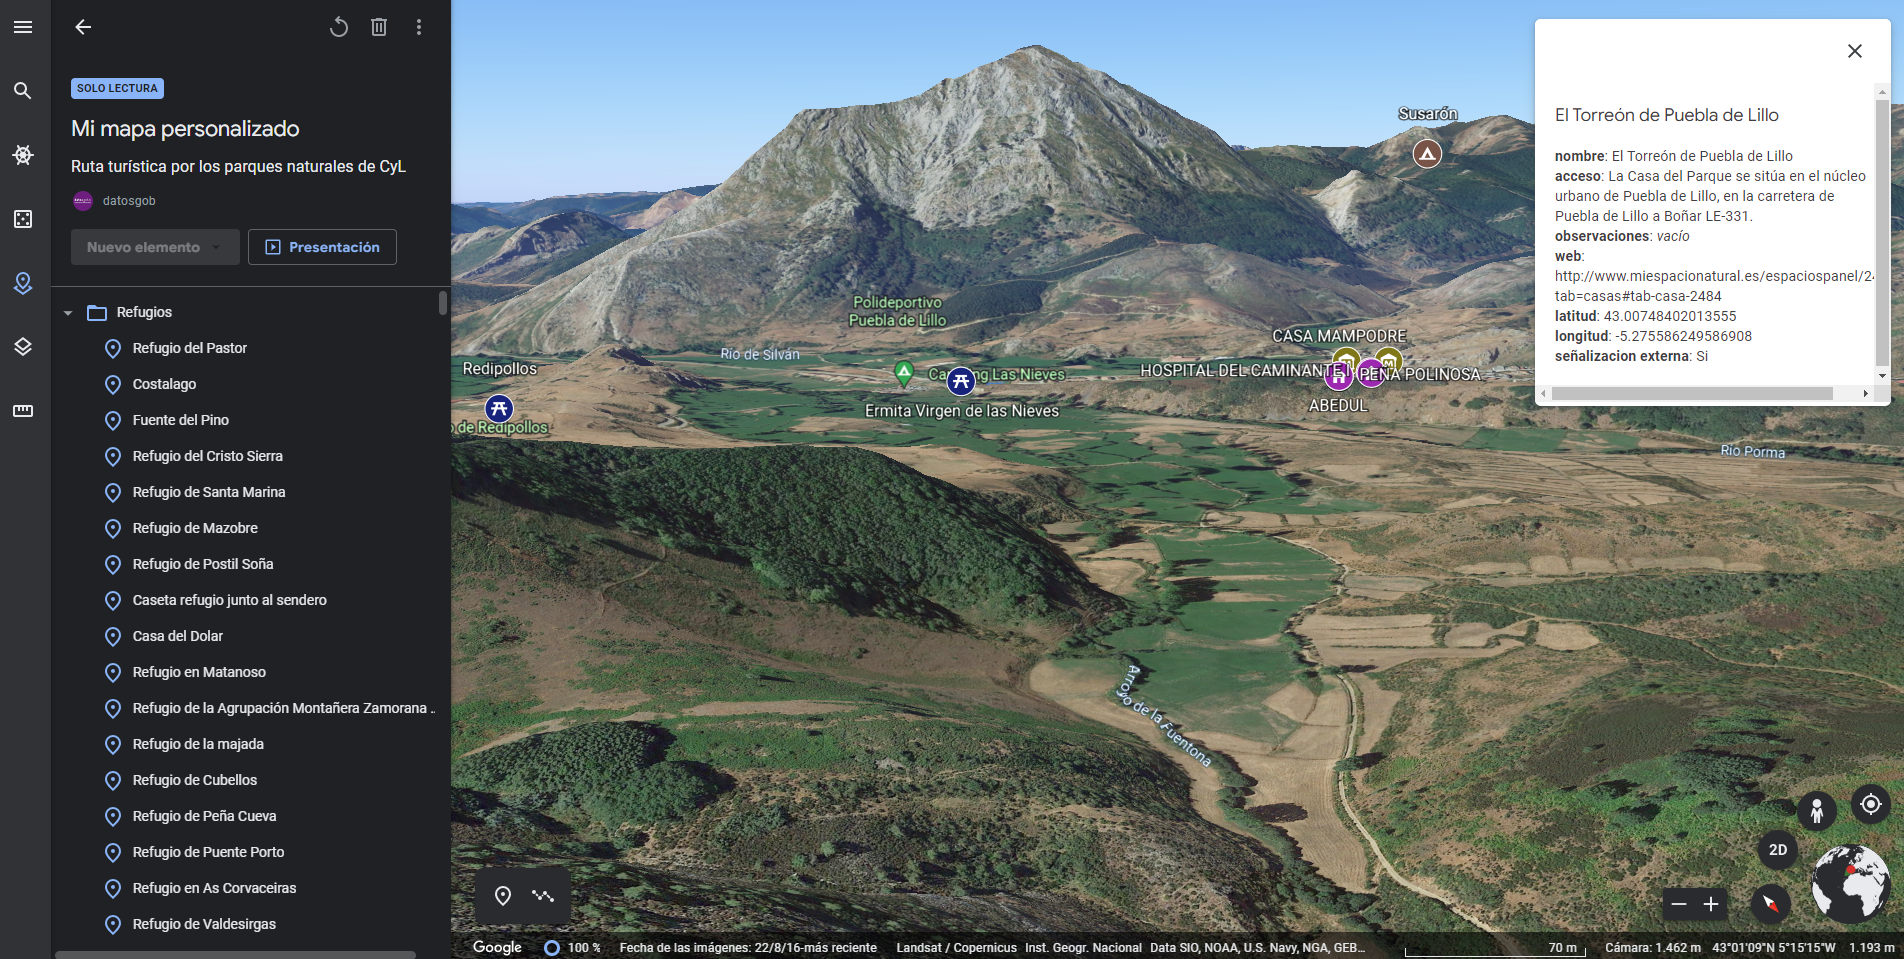
Generating personalized tourist map with "Google My Maps"
1. Introduction
Visualizations are graphical representations of the data allowing to transmit in a simple and effective way related information. The visualization capabilities are extensive, from basic representations, such as a line chart, bars or sectors, to visualizations configured on control…
- Data exercises