Blog
Cities account for more than two-thirds of Europe's population and consume around 80% of energy. In this context, climate change is having a particularly severe impact on urban environments, not only because of their density, but also because of their construction characteristics, their energy metabolism and the scarcity of vegetation in many consolidated areas. One of the most visible and worrying effects is the phenomenon known as urban heat island (UHI).
Heat islands occur when the temperature in urban areas is significantly higher than in nearby rural or peri-urban areas, especially at night. This thermal differential can easily exceed five degrees Celsius under certain conditions. The consequences of this phenomenon go beyond thermal discomfort: it directly affects health, air quality, energy consumption, urban biodiversity and social equity.
In recent years, the availability of open data—especially geospatial data—has made it possible to characterize, map, and analyze urban heat islands with unprecedented accuracy. This article explores how this data can be used to design urban solutions adapted to climate change, with heat island mitigation as its focus.
What are urban heat islands and why do they occur?
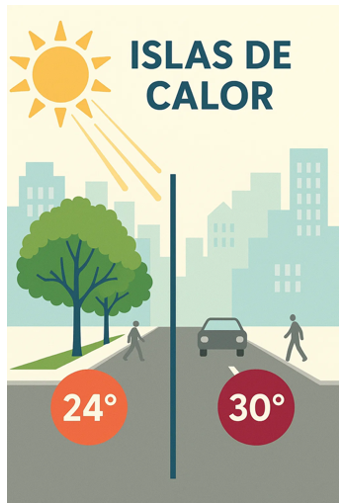
Figure 1. Illustrative element on heat islands.
To intervene effectively in heat islands, it is necessary to know where, when and how they occur. Unlike other natural hazards, the heat island effect is not visible to the naked eye, and its intensity varies depending on the time of day, time of year, and specific weather conditions. It therefore requires a solid and dynamic knowledge base, which can only be built through the integration of diverse, up-to-date and territorialized data.
At this point, open geospatial data is a critical tool. Through satellite images, urban maps, meteorological data, cadastral cartography and other publicly accessible sets, it is possible to build urban thermal models, identify critical areas, estimate differential exposures and evaluate the impact of the measures adopted.
The main categories of data that allow us to address the phenomenon of heat islands from a territorial and interdisciplinary perspective are detailed below.
Types of geoespatial data applicable to the study of the phenomenon
1. Earth observation satellite data
Thermal sensors on satellites such as Landsat 8/9 (NASA/USGS) or Sentinel-3 (Copernicus) make it possible to generate urban surface temperature maps with resolutions ranging from 30 to 1,000 metres. Although these images have spatial and temporal limitations, they are sufficient to detect patterns and trends, especially if combined with time series.
This data, accessible through platforms such as the Copernicus Open Access Hub or the USGS EarthExplorer, is essential for comparative studies between cities or for observing the temporal evolution of the same area.
2. Urban weather data
The network of AEMET stations, together with other automatic stations managed by autonomous communities or city councils, allows the evolution of air temperatures in different urban points to be analysed. In some cases, there are also citizen sensors or networks of sensors distributed in the urban space that allow real-time heat maps to be generated with high resolution.
3. Urban mapping and digital terrain models
Digital surface models (DSM), digital terrain models (DTM) and mappings derived from LIDAR allow the study of urban morphology, building density, street orientation, terrain slope and other factors that affect natural ventilation and heat accumulation. In Spain, this data is accessible through the National Center for Geographic Information (CNIG).
4. Land cover and land use databases
Databases such as Corine Land Cover of the Copernicus Programme, or land use maps at the regional level make it possible to distinguish between urbanised areas, green areas, impermeable surfaces and bodies of water. This information is key to calculating the degree of artificialization of an area and its relationship with the heat balance.
5. Inventories of urban trees and green spaces
Some municipalities publish on their open data portals the detailed inventory of urban trees, parks and gardens. These georeferenced data make it possible to analyse the effect of vegetation on thermal comfort, as well as to plan new plantations or green corridors.
6. Socioeconomic and vulnerability data
Data from the National Institute of Statistics (INE), together with the social information systems of autonomous communities and city councils, make it possible to identify the most vulnerable neighbourhoods from a social and economic point of view. Its cross-referencing with thermal data allows a climate justice dimension to be incorporated into decision-making.
Practical applications: how open data is used to act
Once the relevant data has been gathered and integrated, multiple analysis strategies can be applied to support public policies and urban projects with sustainability and equity criteria. Some of the main applications are described below.
· Heat zone mapping and vulnerability maps: Using thermal imagery, weather data, and urban layers together, heat island intensity maps can be generated at the neighborhood or block level. If these maps are combined with social, demographic and public health indicators, it is possible to build thermal vulnerability maps, which prioritize intervention in areas where high temperatures and high levels of social risk intersect. These maps allow, for example:
· Identify priority neighborhoods for urban greening.
· Plan evacuation routes or shaded areas during heat waves.
· Determine the optimal location of climate refuges.
· Assessing the impact of nature-based solutions: Open data also makes it possible to monitor the effects of certain urban actions. For example, using time series of satellite images or temperature sensors, it is possible to assess how the creation of a park or the planting of trees on a street has modified the surface temperature. This ex-post evaluation approach allows justifying public investments, adjusting designs and scaling effective solutions to other areas with similar conditions.
· Urban modelling and climate simulations: three-dimensional urban models, built from open LIDAR data or cadastral mapping, make it possible to simulate the thermal behaviour of a neighbourhood or city under different climatic and urban scenarios. These simulations, combined with tools such as ENVI-met or Urban Weather Generator, are essential to support decision-making in urban planning.
Existing studies and analysis on urban heat islands: what has been done and what we can learn
During the last decade, multiple studies have been carried out in Spain and Europe that show how open data, especially geospatial data, allow the phenomenon of urban heat islands to be characterised and analysed. These works are fundamental not only because of their specific results, but also because they illustrate replicable and scalable methodologies. Some of the most relevant are described below.
Polytechnic University of Madrid study on surface temperature in Madrid
A team from the Department of Topographic Engineering and Cartography of the UPM analysed the evolution of surface temperature in the municipality of Madrid using thermal images from the Landsat 8 satellite in the summer period. The study focused on detecting spatial changes in warmer areas and relating them to land use, urban vegetation and building density.
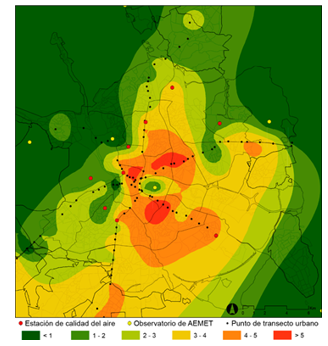
Figure 2. Illustrative image. Source: generated with AI
Methodology:
Remote sensing techniques were applied to extract the surface temperature from the TIRS thermal channel of the Landsat. Subsequently, a statistical analysis of correlation between thermal values and variables such as NDVI (vegetation index), type of land cover (CORINE data) and urban morphology was carried out.
Main results:
Areas with higher building density, such as the central and southern neighborhoods, showed higher surface temperatures. The presence of urban parks reduced the temperature of their immediate surroundings by 3 to 5 °C. It was confirmed that the heat island effect intensifies at night, especially during persistent heat waves.
This type of analysis is especially useful for designing urban greening strategies and for justifying interventions in vulnerable neighbourhoods.
Barcelona Climate Vulnerability Atlas
Barcelona City Council, in collaboration with experts in public health and urban geography, developed a Climate Vulnerability Atlas which includes detailed maps of heat exposure, population sensitivity, and adaptive capacity. The objective was to guide municipal policies against climate change, especially in the field of health and social services.

Figure 3. Image containing fence, exterior, buildings and grass. Source: generated with AI
Methodology:
The atlas was developed by combining open and administrative data at the census tract level. Three dimensions were analysed: exposure (air temperature and surface data), sensitivity (advanced age, density, morbidity) and adaptive capacity (access to green areas, quality of housing, facilities). The indicators were normalized and combined through multi-criteria spatial analysis to generate a climate vulnerability index. The result made it possible to locate the neighbourhoods most at risk from extreme heat and to guide municipal measures.
Main results:
Based on the atlas, the network of "climate shelters" was designed, which includes libraries, civic centers, schools and conditioned parks, activated during episodes of extreme heat. The selection of these spaces was based directly on the atlas data.
Multitemporal analysis of the heat island effect in Seville
Researchers from the University of Seville used satellite data from Sentinel-3 and Landsat 8 to study the evolution of the heat island phenomenon in the city between 2015 and 2022. The aim was to evaluate the effectiveness of certain urban actions – such as the "Green your neighbourhood" plan – and to anticipate the effects of climate change on the city.
Methodology:
Thermal imaging and NDVI data were used to calculate temperature differences between urban areas and surrounding rural areas. Supervised classification techniques were also applied to identify land uses and their evolution. Open data from tree inventories and urban shade maps were used to interpret the results.
Main results:
Specific renaturation actions have a very positive local impact, but their effect on the city as a whole is limited if they are not integrated into a metropolitan-scale strategy. The study concluded that a continuous network of vegetation and bodies of water is more effective than isolated actions.
European comparison of the Urban Heat Island Atlas (Copernicus) project
Although it is not a Spanish study, the viewer developed by Copernicus for the European Urban Atlas programme offers a comparative analysis between European cities.
Methodology:
The viewer integrates Sentinel-3 thermal imagery, land cover data, and urban mapping to assess the severity of the heat island effect.

Figure 4. Illustration: Infographic showing the main factors causing the urban heat island effect (UHI). Urban areas retain heat due to tall buildings, impermeable surfaces and heat-retaining materials, while green areas are cooler Source: Urban heat islands.
Main results:
This type of tool allows smaller cities to have a first approximation of the phenomenon without the need to develop their own models. As it is based on open and free data, the viewer allows direct consultations by technicians and citizens.
Current limitations and challenges
Despite progress in opening up data, there are still significant challenges:
-
Territorial inequality: not all cities have the same quality and quantity of data.
-
Irregular update: Some sets are released on a one-off basis and are not updated regularly.
-
Low granularity: Data is often aggregated by districts or census tracts, making street-scale interventions difficult.
-
Lack of technical capacities: Many local governments do not have staff specialized in geospatial analysis.
- Little connection with citizens: the knowledge generated from data does not always translate into visible or understandable actions for the population.
Conclusion: building climate resilience from geoespatial data
Urban heat islands are not a new phenomenon, but in the context of climate change they take on a critical dimension. Cities that do not plan based on data will be increasingly exposed to episodes of extreme heat, with unequal impacts among their populations.
Open data—and in particular geospatial data—offers a strategic opportunity to transform this threat into a lever for change. With them we can identify, anticipate, intervene and evaluate. But for this to happen, it is essential to:
· Consolidate accessible, up-to-date and quality data infrastructures.
· To promote collaboration between levels of government, research centres and citizens.
· Train municipal technicians in the use of geospatial tools.
· Promote a culture of evidence-based decision-making and climate sensitivity.
Data does not replace politics, but it allows it to be founded, improved and made more equitable. In a global warming scenario, having open geospatial data is a key tool to make our cities more livable and better prepared for the future.
Content prepared by Mayte Toscano, Senior Consultant in Data Economy Technologies. The contents and points of view reflected in this publication are the sole responsibility of the author.
Blog
In an increasingly interconnected and complex world, geospatial intelligence (GEOINT) has become an essential tool for defence and security decision-making . The ability to collect, analyse and interpret geospatial data enables armed forces and security agencies to better understand the operational environment, anticipate threats and plan operations more effectively.
In this context, satellite data, classified but also open data, have acquired significant relevance. Programmes such as Copernicus of the European Union provide free and open access to a wide range of Earth observation data, which democratises access to critical information and fosters collaboration between different actors.
This article explores the role of data in geospatial intelligence applied to defence, highlighting its importance, applications and Spain's leadership in this field.
Geospatial intelligence (GEOINT) is a discipline that combines the collection, analysis and interpretation of geospatial data to support decision making in a variety of areas, including defence, security and emergency management. This data may include satellite imagery, remotely sensed information, geographic information system (GIS) data and other sources that provide information on the location and characteristics of the terrain.
In the defence domain, GEOINT enables military analysts and planners to gain a detailed understanding of the operational environment, identify potential threats and plan operations with greater precision. It also facilitates coordination between different units and agencies, improving the effectiveness of joint operations.
Defence application
The integration of open satellite data into geospatial intelligence has significantly expanded defence capabilities. Some of the most relevant applications are presented below:

Figure 1. GEOINT applications in defence. Source: own elaboration
Geospatial intelligence not only supports the military in making tactical decisions, but also transforms the way military, surveillance and emergency response operations are planned and executed. Here we present concrete use cases where GEOINT, supported by open satellite data, has had a decisive impact.
Monitoring of military movements in conflicts
Case. Ukraine War (2,022-2,024)
Organisations such as the EU Satellite Centre (SatCen) and NGOs such as the Conflict Intelligence Team have used Sentinel-1 and Sentinel-2 (Copernicus) imagery for the Conflict Intelligence Team :
- Detect concentrations of Russian troops and military equipment.
- Analyse changes to airfields, bases or logistics routes.
- Support independent verification of events on the ground.
This has been key to EU and NATO decision-making, without the need to resort to classified data.
Maritime surveillance and border control
Case. FRONTEX operations in the Mediterranean
GEOINT powered by Sentinel-1 (radar) and Sentinel-3 (optical + altimeter) allows:
- Identify unauthorised vessels, even under cloud cover or at night.
- Integrate alerts with AIS (automatic ship identification system).
- Coordinate rescue and interdiction operations.
Advantage: Sentinel-1's synthetic aperture radar (SAR) can see through clouds, making it ideal for continuous surveillance.
Support to peace missions and humanitarian aid
Case. Earthquake in Syria/Turkey (2,023)
Open data (Sentinel-2, Landsat-8, PlanetScope free after catastrophe) were used for:
- Detect collapsed areas and assess damage.
- Plan safe access routes.
Coordinate camps and resources with military support.
Spain's role
Spain has demonstrated a significant commitment to the development and application of geospatial intelligence in defence.
|
European Union Satellite Centre (SatCen) |
Project Zeus of the Spanish Army |
Participation in European Programmes | National capacity building |
|
Located in Torrejón de Ardoz, SatCen is a European Union agency that provides geospatial intelligence products and services to support security and defence decision-making. Spain, as host country, plays a central role in SatCen operations. |
The Spanish Army has launched the Zeus project, a technological initiative that integrates artificial intelligence, 5G networks and satellite data to improve operational capabilities. This project aims to create a tactical combat cloud to enable greater interoperability and efficiency in military operations. |
Spain actively participates in European programmes related to Earth observation and geospatial intelligence, such as Copernicus and MUSIS. In addition, it collaborates in bilateral and multilateral initiatives for satellite capacity building and data sharing. |
At the national level, Spain has invested in the development of its own geospatial intelligence capabilities, including the training of specialised personnel and the acquisition of advanced technologies. These investments reinforce the country's strategic autonomy and its ability to contribute to international operations. |
Figure 2. Comparative table of Spain's participation in different satellite projects. Source: own elaboration
Challenges and opportunities
While open satellite data offers many advantages, it also presents certain challenges that need to be addressed to maximise its usefulness in the defence domain.
-
Data quality and resolution: While open data is valuable, it often has limitations in terms of spatial and temporal resolution compared to commercial or classified data. This may affect its applicability in certain operations requiring highly accurate information.
-
Data integration: The integration of data from multiple sources, including open, commercial and classified data, requires systems and processes to ensure interoperability and consistency of information. This involves technical and organisational challenges that must be overcome.
-
Security and confidentiality: The use of open data in defence contexts raises questions about the security and confidentiality of information. It is essential to establish security protocols and measures to protect sensitive information and prevent its misuse.
- Opportunities for collaboration: Despite these challenges, open satellite data offer significant opportunities for collaboration between different actors, including governments, international organisations, the private sector and civil society. Such collaboration can improve the effectiveness of defence operations and contribute to greater global security.
Recommendations for strengthening the use of open data in defence
Based on the above analysis, some key recommendations can be drawn to better exploit the potential of open data:
-
Strengthening open data infrastructures: consolidate national platforms integrating open satellite data for both civilian and military use, with a focus on security and interoperability.
-
Promotion of open geospatial standards (OGC, INSPIRE): Ensure that defence systems integrate international standards that allow the combined use of open and classified sources.
-
Specialised training: foster the development of capabilities in GEOINT analysis with open data, both in the military domain and in collaboration with universities and technology centres.
-
Civil-military cooperation: establish protocols to facilitate the exchange of data between civilian agencies (AEMET, IGN, Civil Protection) and defence actors in crisis or emergency situations.
- Support to R&D&I: to foster research projects exploring the advanced use of open data (e.g. AI applied to Sentinel) with dual applications (civilian and security).
Conclusion
Geospatial intelligence and the use of open satellite data have transformed the way armed forces and security agencies plan and execute their operations. In a context of multidimensional threats and constantly evolving scenarios, having accurate, accessible and up-to-date information is more than an advantage: it is a strategic necessity.
Open data has established itself as a fundamental asset not only because it is free of charge, but also because of its ability to democratise access to critical information, foster transparency and enable new forms of collaboration between military, civilian and scientific actors. In particular:
- Improve the resilience of defence systems by enabling broader, cross-cutting analysis of the operating environment.
- Increase interoperability, as open formats and standards facilitate exchange between countries and agencies.
- They drive innovationby providing startups, research centres and universities with access to quality data that would otherwise be inaccessible.
In this context, Spain has demonstrated a clear commitment to this strategic vision, both through its national institutions and its active role in European programmes such as Copernicus, Galileo and the common defence missions.
Content prepared by Mayte Toscano, Senior Consultant in Data Economy Technologies. The contents and points of view reflected in this publication are the sole responsibility of the author.
Blog
Satellite data has become a fundamental tool for understanding and monitoring our planet from a unique perspective. This data, collected by satellites in orbit around the Earth, provides a global and detailed view of various terrestrial, maritime and atmospheric phenomena that have applications in multiple sectors, such as environmental care or driving innovation in the energy sector.
In this article we will focus on a new sector: the field of fisheries, where satellite data have revolutionised the way fisheries are monitored and managed worldwide. We will review which fisheries satellite data are most commonly used to monitor fishing activity and look at possible uses, highlighting their relevance in detecting illegal activities.
The most popular fisheries-related satellite data: positioning data
Among the satellite data, we find a large amount ofpublic and open data , which are free and available in reusable formats, such as those coming from the European Copernicus programme. This data can be complemented with other data which, although also public, may have costs and restrictions on use or access. This is because obtaining and processing this data involves significant costs and requires purchasing from specialised suppliers such as ORBCOMM, exactEarth, Spire Maritime or Inmarsat. To this second type belong the data from the two most popular systems for obtaining fisheries data, namely:
- Automatic Identification System (AIS): transmits the location, speed and direction of vessels. It was created to improve maritime safety and prevent collisions between vessels, i.e. its aim was to prevent accidents by allowing vessels to communicate their position and obtain the location of other ships in real time. However, with the release of satellite data in the 2010s, academia and authorities realised that they could improve situational awareness by providing information about ships, including their identity, course, speed and other navigational data. AIS data went on to facilitate maritime traffic management, enabling coastal authorities and traffic centres to monitor and manage the movement of vessels in their waters. This technology has revolutionised maritime navigation, providing an additional layer of safety and efficiency in maritime operations. Data is available through websites such as MarineTraffic or VesselFinder, which offer basic tracking services for free, but require a subscription for advanced features..
- Vessel Monitoring System (VMS): designed specifically for fisheries monitoring, it provides position and movement data. It was created specifically for the monitoring and management of the modern fishing industry. Its development emerged about two decades ago as a response to the need for improved monitoring, control and surveillance of fishing activities. Access to VMS data varies according to jurisdiction and international agreements. The data are mainly used by government agencies, regional fisheries management organisations and surveillance authorities, who have restricted access and must comply with strict security and confidentiality regulations.The data are used mainly by government agencies, regional fisheries management organisations and surveillance authorities, who have restricted access and must comply with strict security and confidentiality regulations.. On the other hand, fishing companies also use VMS systems to manage their fleets and comply with local and international regulations.
Analysis of fisheries satellite data
Satellite data has proven to be particularly useful for fisheries observation, as it can provide both an overview of a marine area or fishing fleet, as well as the possibility of knowing the operational life of a single vessel. The following steps are usually followed:
- AIS and VMS data collection.
- Integration with other open or private sources. For example: ship registers, oceanographic data, delimitations of special economic zones or territorial waters.
- Application of machine learning algorithms to identify behavioural patterns and fishing manoeuvres.
- Visualisation of data on interactive maps.
- Generation of alerts on suspicious activity (for real-time monitoring).
Use cases of fisheries satellite data
Satellite fisheries data offer cost-effective options, especially for those with limited resources to patrol their waters to continuously monitor large expanses of ocean. Among other activities, these data make possible the development of systems that allow:
- Monitoring of compliance with fishing regulations, as satellites can track the position and movements of fishing vessels. This monitoring can be done with historical data, in order to perform an analysis of fishing activity patterns and trends. This supports long-term research and strategic analysis of the fisheries sector.
- The detection of illegal fishing, using both historical and real-time data. By analysing unusual movement patterns or the presence of vessels in restricted areas, possible illegal, unreported and unregulated (IUU) fishing activities can be identified. IUU fishing is worth up to US$23.5 billionper year in seafood products.
- The assessment of the fishing volume, with data on the carrying capacity of each vessel and the fish transhipments that take place both at sea and in port.
- The identification of areas of high fishing activity and the assessment of their impact on sensitive ecosystems.
A concrete example is work by the Overseas Development Institute (ODI), entitled "Turbid Water Fishing", which reveals how satellite data can identify vessels, determine their location, course and speed, and train algorithms, providing unprecedented insight into global fishing activities. The report is based on two sources: interviews with the heads of various private and public platforms dedicated to monitoring IUU fishing, as well as free and open resources such as Global Fishing Watch (GFW) - an organisation that is a collaboration between Oceana, SkyTruth and Google - which provides open data.
Challenges, ethical considerations and constraints in monitoring fishing activity
While these data offer great opportunities, it is important to note that they also have limitations. The study "Fishing for data: The role of private data platforms in addressing illegal, unreported and unregulated fishing and overfishing", mentions the problems of working with satellite data to combat illegal fishing, challenges that can be applied to fisheries monitoring in general:
- The lack of a unified universal fishing vessel register. There is a lack of a single database of fishing vessels, which makes it difficult to identify vessels and their owners or operators. Vessel information is scattered across multiple sources such as classification societies, national vessel registers and regional fisheries management organisations.
- Deficient algorithms. Algorithms used to identify fishing behaviour are sometimes unable to accurately identify fishing activity, making it difficult to identify illegal activities. For example, inferring the type of fishing gear used, target species or quantity caught from satellite data can be complex.
- Most of this data is not free and can be costly. The most commonly used data in this field, i.e. data from AIS and VMS systems, are of considerable cost.
- Incomplete satellite data. Automatic Identification Systems (AIS) are mandatory only for vessels over 300 gross tonnes, which leaves out many fishing vessels. In addition, vessels can turn off their AIS transmitters to avoid surveillance.
- The use of these tools for surveillance, monitoring and law enforcement carries risks, such as false positives and spurious correlations. In addition, over-reliance on these tools can divert enforcement efforts away from undetectable behaviour.
- Collaboration and coordination between various private initiatives, such as Global Fishing Watch, is not as smooth as it could be. If they joined forces, they could create a more powerful data platform, but it is difficult to incentivise such collaboration between competing organisations.
The future of satellite data in fisheries
The field of satellite data is in constant evolution, with new techniques for capture and analysis improving the accuracy and utility of the information obtained. Innovations in geospatial data capture include the use of drones, LiDAR (light detection and ranging) and high-resolution photogrammetry, which complement traditional satellite data. In the field of analytics, machine learning and artificial intelligence are playing a crucial role. For example, Global Fishing Watch uses machine learning algorithms to process millions of daily messages from more than 200,000 fishing vessels, allowing a global, real-time view of their activities.
The future of satellite data is promising, with technological advances offering improvements in the resolution, frequency, volume, quality and types of data that can be collected. The miniaturisation of satellites and the development of microsatellite constellations are improving access to space and the data that can be obtained from it.
In the context of fisheries, satellite data are expected to play an increasingly important role in the sustainable management of marine resources. Combining these data with other sources of information, such as in situ sensors and oceanographic models, will allow a more holistic understanding of marine ecosystems and the human activities that affect them.
Content prepared by Miren Gutiérrez, PhD and researcher at the University of Deusto, expert in data activism, data justice, data literacy and gender disinformation. The contents and views reflected in this publication are the sole responsibility of the author.
Blog
In a world increasingly exposed to natural hazards and humanitarian crises, accurate and up-to-date geospatial data can make the difference between effective response and delayed reaction. The building footprints, i.e. the contours of buildings as they appear on the ground, are one of the most valuable resources in emergency contexts.
In this post we will delve deeper into this concept, including where to obtain open building footprint data, and highlight its importance in one of its many use cases: emergency management.
What are buildings footprints
The building footprints are geospatial representations, usually in vector format, showing the outline of structures built on the ground. That is, they indicate the horizontal projection of a building on the ground, viewed from above, as if it were a floor plan.
These footprints can include residential buildings as well as industrial, commercial, institutional or even rural buildings. Depending on the data source, they may be accompanied by additional attributes such as height, number of floors, building use or date of construction, making them a rich source of information for multiple disciplines.
Unlike an architectural plan showing internal details, building footprints are limited to the perimeter of the building in contact with the ground. This simplicity makes them lightweight, interoperable and easily combined with other geographic information layers, such as road networks, risk areas, critical infrastructures or socio-demographic data.
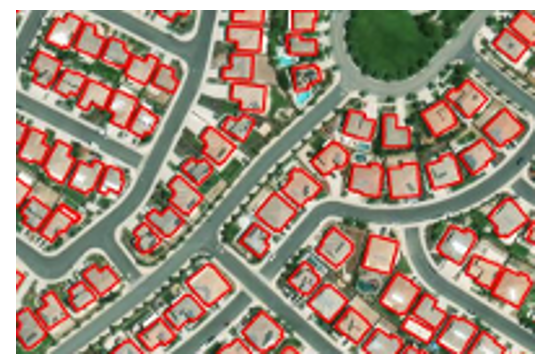
Figure 1. Example of building footprints: each polygon represents the outline of a building as seen from above.
How are they obtained?
There are several ways to generate building footprints:
- From satellite or aerial imagery: using photo-interpretation techniques or, more recently, artificial intelligence and machine learning algorithms.
- With cadastral data or official registers: as in the case of the Cadastre in Spain, which maintains precise vector bases of all registered constructions.
- By collaborative mapping: platforms such as OpenStreetMap (OSM) allow volunteer users to manually digitise visible footprints on orthophotos.
What are they for?
Building footprints are essential for:
- Urban and territorial analysis: allow the study of built density, urban sprawl or land use.
- Cadastral and real estate management: are key to calculating surface areas, applying taxes or regulating buildings.
- Planning of infrastructures and public services: they help to locate facilities, design transport networks or estimate energy demand.
- 3D modelling and smart cities: serve as a basis for generating three-dimensional urban models.
- Risk and emergency management: to identify vulnerable areas, estimate affected populations or plan evacuations.
In short, building footprints are a basic piece of the spatial data infrastructure and, when offered as open, accessible and up-to-date data, they multiply their value and usefulness for society as a whole.
Why are they key in emergency situations?
Of all the possible use cases, in this article we will focus on emergency management. During such a situation - such as an earthquake, flood or wildfire - responders need to know which areas are built-up, how many people can inhabit those structures, how to access them and where to concentrate resources. The building footprints allow:
- Rapidly estimate the number of people potentially affected.
- Prioritise intervention and rescue areas.
- Plan access and evacuation routes.
- Cross-reference data with other layers (social vulnerability, risk areas, etc.).
- Coordinate action between emergency services, local authorities and international cooperation.
Open data available
In an emergency, it is essential to know where to locate building footprint data. One of the most relevant developments in the field of data governance is the increasing availability of building footprints as open data. This type of information, previously restricted to administrations or specialised agencies, can now be freely used by local governments, NGOs, researchers and businesses.
Some of the main sources available for emergency management and other purposes are summarised below:
- JRC - Global Human Settlement Layer (GHSL): the Joint Research Centre of the European Commission offers a number of products derived from satellite imagery analysis:
- GHS-BUILT-S: raster data on global built-up areas.
- GHS-BUILD-V: AI-generated vector building footprints for Europe.
- Downloading data: https://ghsl.jrc.ec.europa.eu/download.php
- IGN and Cadastre of Spain: the footprints of official buildings in Spain can be obtained through the Cadastre and the Instituto Geográfico Nacional (IGN).. They are extremely detailed and up-to-date.
- Download centre of the IGN: https://centrodedescargas.cnig.es
- Cadastral Surveyor: https://www.sedecatastro.gob.es.
- Copernicus Emergency Management Service: provides mapping products generated in record time when an emergency (earthquakes, floods, fires, etc.) is triggered.. They include damage maps and footprints of affected buildings.
- Download centre: https://emergency.copernicus.eu/mapping/list-of-components/EMSR
- Important: to download detailed vector data (such as footprints), you need to register on the platform DIAS/Copernicus EMS or request access on a case-by-case basis.
- OpenStreetMap (OSM): collaborative platform where users from all over the world have digitised building footprints, especially in areas not covered by official sources. It is especially useful for humanitarian projects, rural and developing areas, and cases where rapid updating or local involvement is needed.
- Downloading data: https://download.geofabrik.de
- Google Open Buildings: this Google project offers more than 2 billion building footprints in Africa, Asia and other data-scarce regions, generated with artificial intelligence models. It is especially useful for humanitarian purposes, urban development in countries of the global south, and risk exposure assessment in places where there are no official cadastres.
- Direct access to the data: https://sites.research.google/open-buildings/
- Microsoft Building Footprints: Microsoft has published sets of building footprints generated with machine learning algorithms applied to aerial and satellite imagery. Coverage: United States, Canada, Uganda, Tanzania, Nigeria and recently India. The data is open access under the ODbL licence.
- Meta (ex Facebook) AI Buildings Footprints: Meta AI has published datasets generated through deep learning in collaboration with the Humanitarian OpenStreetMap Team (HOT). They focused on African and Southeast Asian countries.
- Direct access to the data: https://dataforgood.facebook.com/dfg/tools/buildings.
Comparative table of open building footprints sources
| Source/Project | Geographic coverage | Data type | Format | Requires registration | Main use |
|---|---|---|---|---|---|
| JRC GHSL | Global (raster) / Europe (vector) | Raster and vector | GeoTIFF / GeoPackage / Shapefile | No | Urban analysis, European planning, comparative studies |
| IGN + Cadastre Spain | Spain | Official vector | GML/Shapefile/WFS/WMS | No | Cadastral data, urban planning, municipal management |
| Copernicus EMS | Europe and global (upon activation) | Vector (post-emergency) | PDF / GeoTIFF / Shapefile | Yes (for detailed vector data) | Rapid mapping, emergency management |
| OpenStreetMap | Global (varies by area) | Collaborative vector | .osm / shapefile / GeoJSON | No | Base maps, rural areas, humanitarian aid |
| Google Open Buildings | Africa, Asia, LatAm (selected areas) | Vector (AI-generated) | CSV / GeoJSON | No | Risk assessment, planning in developing countries |
| Microsoft Buildings Footprints | USA, Canada, India, Africa | Vector (AI) | GeoJSON | No | Massive data, urban planning, rural areas |
| Meta AI | Africa, Asia (specific areas) | Vector (AI) | GeoJSON / CSV | No | Humanitarian aid, complementing OSM in uncovered areas |
Figure 2. Comparative table of open building footprint sources.
Combination and integrated use of data
One of the great advantages of these sources being open and documented is the possibility of combining them to improve the coverage, accuracy and operational utility of building footprints. Here are some recommended approaches:
1. Complementing areas without official coverage
- In regions where cadastre is not available or up to date (such as many rural areas or developing countries), it is useful to use Google Open Buildings or OpenStreetMap as a basis.
- GHSL also provides a harmonised view on a continental scale, useful for planning and comparative analysis.
2. Cross official and collaborative layers
- The Spanish cadastre footprints can be enriched with OSM data when new or modified areas are detected, especially after an event such as a catastrophe.
- This combination is ideal for small municipalities that do not have their own technical capacity, but want to keep their data up to date.
3. Integration with socio-demographic and risk data
- Footprints gain value when integrated into geographic information systems (GIS) alongside layers such as:
- Population per building (INE, WorldPop).
- Flood zones (MAPAMA, Copernicus).
- Health centres or schools.
- Critical infrastructure (electricity grid, water).
This allows modelling risk scenarios, planning evacuations or even simulating potential impacts of an emergency.
4. Combined use in actual activations
Some real-world examples of uses of this data include:
- In cases such as the eruption on La Palma, data from the Cadastre, OSM and Copernicus EMS products were used simultaneously to map damage, estimate the affected population and plan assistance.
- During the earthquake in Turkey in 2023, organisations such as UNOSAT and Copernicus combined satellite imagery with automatic algorithms to detect structural collapses and cross-reference them with existing footprints. This made it possible to quickly estimate the number of people potentially trapped.
In emergency situations, time is a critical resource. Artificial intelligence applied to satellite or aerial imagery makes it possible to generate building footprints much faster and more automated than traditional methods.
In short, the different sources are not exclusive, but complementary. Its strategic integration within a well-governed data infrastructure is what allows moving from data to impact, and putting geospatial knowledge at the service of security, planning and collective well-being.
Data governance and coordination
Having quality building footprints is an essential first step, but their true value is only activated when these data are well governed, coordinated between actors and prepared to be used efficiently in real-world situations. This is where data governancecomes into play: the set of policies, processes and organisational structures that ensure that data is available, reliable, up-to-date and used responsibly.
Why is data governance key?
In emergency or territorial planning contexts, the lack of coordination between institutions or the existence of duplicated, incomplete or outdated data can have serious consequences: delays in decision-making, duplication of efforts or, in the worst case, erroneous decisions. Good data governance ensures that:
- Data must be known and findable: It is not enough that it exists; it must be documented, catalogued and accessible on platforms where users can easily find it.
- Have standards and interoperability: building footprints should follow common formats (such as GeoJSON, GML, shapefile), use consistent reference systems, and be aligned with other geospatial layers (utility networks, administrative boundaries, risk zones...).
- Keep up to date: especially in urban or developing areas, where new construction is rapidly emerging. Data from five years ago may be useless in a current crisis.
- Coordination between levels of government: municipal, regional, national and European. Efficient sharing avoids duplication and facilitates joint responses, especially in cross-border or international contexts.
- Clear roles and responsibilities are defined: who produces the data, who validates it, who distributes it, who activates it in case of emergency?
The value of collaboration
A robust data governance ecosystem must also foster multi-sector collaboration. Public administrations, emergency services, universities, the private sector, humanitarian organisations and citizens can benefit from (and contribute to) the use and improvement of this data.
For example, in many countries, local cadastres work in collaboration with agencies such as national geographic institutes, while citizen science and collaborative mapping initiatives (such as OpenStreetMap) can complement or update official data in less covered areas.
Emergency preparedness
In crisis situations, coordination must be anticipated. It is not just about having the data, but about having clear operational plans on how to access it, who activates it, in what formats, and how it integrates with response systems (such as Emergency Coordination Centres or civil protection GIS).
Therefore, many institutions are developing protocols for activating geospatial data in emergencies, and platforms such as Copernicus Emergency Management Service already work on this principle, offering products based on well-governed data that can be activated in record time.
Conclusion
Building footprints are not just a technical resource for urban planners or cartographers: they are a critical tool for risk management, sustainable urban planning and citizen protection. In emergency situations, where time and accurate information are critical factors, having this data can make the difference between an effective intervention and an avoidable tragedy.
Advances in Earth observation technologies, the use of artificial intelligence and the commitment to open data by institutions such as the JRC and the IGN have democratised access to highly valuable geospatial information. Today it is possible for a local administration, an NGO or a group of volunteers to access building footprints to plan evacuations, estimate affected populations or design logistical routes in real time.
However, the challenge is not only technological, but also organisational and cultural. It is imperative to strengthen data governance: to ensure that these sets are well documented, updated, accessible and that their use is integrated into emergency and planning protocols. It is also essential to train key actors, promote interoperability and foster collaboration between public institutions, the private sector and civil society.
Ultimately, building footprints represent much more than geometries on a map: they are a foundation on which to build resilience, save lives and improve decision-making at critical moments. Betting for its responsible and open use means betting for a smarter, more coordinated and people-centred public management.
Content prepared by Mayte Toscano, Senior Consultant in Data Economy Technologies. The contents and points of view reflected in this publication are the sole responsibility of the author.
Blog
Geospatial data has driven improvements in a number of sectors, and energy is no exception. This data allows us to better understand our environment in order to promote sustainability, innovation and informed decision-making.
One of the main providers of open geospatial data is Copernicus, the European Union's Earth observation programme. Through a network of satellites called Sentinel and data from ground, sea and airborne sources, Copernicus provides geospatial information freely accessible through various platforms.
Although Copernicus data is useful in many areas, such as fighting climate change, urban planning or agriculture, in this article we will focus on its role in driving sustainability and energy efficiency. The availability of high quality open data fosters innovation in this sector by promoting the development of new tools and applications that improve energy management and use. Here are some examples.
Climate prediction to improve production
Geospatial data provide detailed information on weather conditions, air quality and other factors, which are essential for understanding and predicting environmental phenomena, such as storms or droughts, that affect energy production and distribution.
One example is this project which provides high-resolution wind forecasts to serve the oil and gas, aviation, shipping and defence sectors. It uses data from satellite observations and numerical models, including information on ocean currents, waves and sea surface temperature from the "Copernicus Marine Service". Thanks to its granularity, it can provide an accurate weather forecasting system at a very local scale, allowing a higher level of accuracy in the behaviour of extreme weather and climate phenomena.
Optimisation of resources
The data provided by Copernicus also allows the identification of the best locations for the installation of energy generation centres, such as solar and wind farms, by facilitating the analysis of factors such as solar radiation and wind speed. In addition, they help monitor the efficiency of these facilities, ensuring that they are operating at maximum capacity.
In this regard, a project has been developed to find the best site for a combined floating wind and wave energy system (i.e. based on wave motion). By obtaining both energies with a single platform, this solution saves space and reduces the impact on the ground, while improving efficiency. Wind and waves arrive at different times at the platform, so capturing both elements helps reduce variability and smoothes overall electricity production. Thanks to the Copernicus data (obtained from the Atlantic Service - Biscay Iberia Ireland - Ocean Wave Reanalysis), the provider of this situation was able to obtain separate components of wind and wave waves, which allowed a more complete understanding of the directionality of both elements. This work led to the selection of Biscay Marine Energy Platform (BiMEP). for the deployment of the device.
Another example is Mon Toit Solaire, an integrated web-based decision support system for the development of rooftop photovoltaic power generation. This tool simulates and calculates the energy potential of a PV project and provides users with reliable technical and financial information. It uses solar radiation data produced by the "Copernicus Atmospheric Monitoring Service", together with three-dimensional urban topographic data and simulations of tax incentives, energy costs and prices, allowing the return on investment to be calculated.
Environmental monitoring and impact assessment.
Geospatial information allows for improved environmental monitoring and accurate impact assessments in the energy sector. This data allows energy companies to identify environmental risks associated with their operations, design strategies to mitigate their impact and optimise their processes towards greater sustainability. In addition, they support environmental compliance by providing objective data-driven reporting, encouraging more responsible and environmentally friendly energy development.
Among the challenges posed by the conservation of ocean biodiversity, man-made underwater noise is recognised as a serious threat and is regulated at European level. In order to assess the impact on marine life of wind farms along the southern coast of France, this project uses high-resolution statistical sound maps, which provide a detailed view of coastal processes, with an hourly time frequency and a high spatial resolution of up to 1.8 km. In particular, they use information from the "Mediterranean Sea Physics Analysis and Forecasting" and "World Ocean Hourly Sea Surface Wind and Stress" services.
Emergency and environmental disaster management.
In disaster situations or extreme weather events, geospatial data can help quickly assess damage and coordinate emergency responses more efficiently.
They can also predict how spills will behave. This is the aim of the Marine Research Institute of the University of Klaipeda, which has developed a system for monitoring and forecasting chemical and microbiological pollution episodes using a high-resolution 3D operational hydrodynamic model. They use the Copernicus "Physical Analysis and Forecasts of the Baltic Sea". The model provides real-time, five-day forecasts of water currents, addressing the challenges posed by shallow waters and port areas. It aims to help manage pollution incidents, particularly in pollution-prone regions such as ports and oil terminals.
These examples highlight the usefulness of geospatial data, especially those provided by programmes such as Copernicus. The fact that companies and institutions can freely access this data is revolutionising the energy sector, contributing to a more efficient, sustainable and resilient system.
Blog
The value of open satellite data in Europe
Satellites have become essential tools for understanding the planet and managing resources efficiently. The European Union (EU) has developed an advanced space infrastructure with the aim of providing real-time data on the environment, navigation and meteorology.
This satellite network is driven by four key programmes:.
- Copernicus: Earth observation, environmental monitoring and climate change.
- Galileo: high-precision satellite navigation, alternative to GPS.
- EGNOS: improved positioning accuracy, key to aviation and navigation.
- Meteosat: padvanced meteorological prediction and atmospheric monitoring.
Through these programmes, Europe not only ensures its technological independence, but also obtains data that is made available to citizens to drive strategic applications in agriculture, security, disaster management and urban planning.
In this article we will explore each programme, its satellites and their impact on society, including Spain''s role in each of them.
Copernicus: Europe''s Earth observation network
Copernicus is the EU Earth observation programme, managed by the European Commission with the technical support of the European Space Agency (ESA) and the European Organisation for the Exploitation of Meteorological Satellites (EUMETSAT).. It aims to provide free and open data about the planet to monitor climate change, manage natural resources and respond to emergencies.
The programme is structured into three main components:
- Space component: consists of a series of satellites called Sentinel, developed specifically for the needs of Copernicus. These satellites provide high quality data for various applications, such as land, sea and atmospheric monitoring.
- Component in situ: includes data collected through ground, air and sea stations. These data are essential to calibrate and validate the information obtained by the satellites, ensuring its accuracy and reliability.
- Operational Services: offers six thematic services that transform collected data into useful information for users:
- Atmospheric monitoring
- Marine monitoring
- Terrestrial monitoring
- Climate change
- Emergency management
- Safety
These services provide information in areas such as air quality, ocean status, land use, climate trends, disaster response and security, supporting informed decision-making in Europe.
Spain has played a key role in the manufacture of components for the Sentinel satellites. Spanish companies have developed critical structures and sensors, and have contributed to the development of data processing software. Spain is also leading projects such as the Atlantic Constellation, which will develop small satellites for climate and oceanic monitoring.
Sentinel satellite
| Satellite | Technical characteristics | Resolution | Coverage (capture frequency) | Uses |
|---|---|---|---|---|
| Sentinel-1 | C-band SAR radar, resolution up to 5m | Up to 5m | Every 6 days | Land and ocean monitoring, natural disasters |
| Sentinel-2 | Multispectral camera (13 bands), resolution up to 10m | 10m, 20m, 60m | Every 5 days | Agricultural management, forestry monitoring, water quality |
| Sentinel-3 | Radiometer SLSTR, Spectrometer OLCI, Altimeter SRAL | 300m (OLCI), 500m (SLSTR) | Every 1-2 days | Oceanic, climatic and terrestrial observation |
| Sentinel-5P | Tropomi spectrometer, resolution 7x3.5 km². | 7x3.5 km² | Daily global coverage | Air quality monitoring, trace gases |
| Sentinel-6 | Altimeter Poseidon-4, vertical resolution 1 cm | 1cm | Every 10 days | Sea level measurement, climate change |
Figure 1. Table satellites Sentinel. Source: own elaboration
Galileo: the european GPS
Galileo is the global navigation satellite system developed by the European Union, managed by the European Space Agency (ESA) and operated by the European Union Space Programme Agency (EUSPA). It aims to provide a reliable and highly accurate global positioning service, independent of other systems such as the US GPS, China''s Beidou or Russia''s GLONASS. Galileo is designed for civilian use and offers free and paid services for various sectors, including transport, telecommunications, energy and finance.
Spain has played a leading role in the Galileo programme. The European GNSS Service Centre (GSC), located in Torrejón de Ardoz, Madrid, acts as the main contact point for users of the Galileo system. In addition, Spanish industry has contributed to the development and manufacture of components for satellites and ground infrastructure, strengthening Spain''s position in the European aerospace sector.
| Satellite | Technical characteristics | Resolution | Coverage (capture frequency) | Uses |
|---|---|---|---|---|
| Galileo FOC | Medium Earth Orbit (MEO), 24 operatives | N/A | Continuous | Precise positioning, land and maritime navigation |
| Galileo IOV | First test satellites of the Galileo system | N/A | Continuous | Initial testing of Galileo before FOC |
Figure 2. Satellite Galileo. Source: own elaboration
EGNOS: improving the accuracy of GPS and Galileo
The European Geostationary Navigation Overlay Service (EGNOS) is the European satellite-based augmentation system (Satellite Based Augmentation System or SBAS) designed to improve the accuracy and reliability of global navigation satellite systems ( Global Navigation Satellite System, GNSS), such as GPS and, in the future, Galileo. EGNOS provides corrections and integrity data that allow users in Europe to determine their position with an accuracy of up to 1.5 metres, making it suitable for safety-critical applications such as aviation and maritime navigation.
Spain has played a leading role in the development and operation of EGNOS. Through ENAIRE, Spain hosts five RIMS Reference Stations located in Santiago, Palma, Malaga, Gran Canaria and La Palma. In addition, the Madrid Air Traffic Control Centre, located in Torrejón de Ardoz, hosts one of the EGNOS Mission Control Centres (MCC), operated by ENAIRE. The Spanish space industry has contributed significantly to the development of the system, with companies participating in studies for the next generation of EGNOS.
| Satellite | Technical characteristics | Resolution | Coverage (capture frequency) | Uses |
|---|---|---|---|---|
| EGNOS Geo | Geostationary GNSS correction satellites | N/A | Real-time GNSS correction | GNSS signal correction for aviation and transportation |
Figure 3. Table satellite EGNOS. Source: own elaboration
Meteosat: high precision weather forecasting
The Meteosat programme consists of a series of geostationary meteorological satellites initially developed by the European Space Agency (ESA) and currently operated by the European Organisation for the Exploitation of Meteorological Satellites (EUMETSAT). These satellites are positioned in geostationary orbit above the Earth''s equator, allowing continuous monitoring of weather conditions over Europe, Africa and the Atlantic Ocean. Its main function is to provide images and data to facilitate weather prediction and climate monitoring.
Spain has been an active participant in the Meteosat programme since its inception. Through the Agencia Estatal de Meteorología (AEMET), Spain contributes financially to EUMETSAT and participates in the programme''s decision-making and operations. In addition, the Spanish space industry has played a key role in the development of the Meteosat satellites. Spanish companies have been responsible for the design and supply of critical components for third-generation satellites, including scanning and calibration mechanisms.
| Satellite | Technical characteristics | Resolution | Cobertura (frecuencia de captura) | Usos |
|---|---|---|---|---|
| Meteosat Primera Gen. | Initial weather satellites, low resolution | Low resolution | Every 30min | Basic weather forecast, images every 30 min. |
| Meteosat Segunda Gen. | Higher spectral and temporal resolution, data every 15 min. | High resolution | Every 15min | Improved accuracy, early detection of weather events |
| Meteosat Tercera Gen. | High-precision weather imaging, lightning detection | High resolution | High frequency | High-precision weather imaging, lightning detection |
Figure 4. Metosat satellite. Source: own elaboration
Access to the data of each programme
Each programme has different conditions and distribution platforms in terms of access to data:
- Copernicus: provides free and open data through various platforms. Users can access satellite imagery and products through the Copernicus Data Space Ecosystem, which offers search, download and processing tools. Data can also be obtained through APIs for integration into automated systems.
- Galileo: its open service (Open Service - OS) allows free use of the navigation signals for any user with a compatible receiver, free of charge. However, direct access to raw satellite data is not provided. For information on services and documentation, access is via the European GNSS Services Centre (GSC):
- Galileo Portal.
- Registration for access to the High Accuracy Service (HAS) (registration required).
- EGNOS: This system improves navigation accuracy with GNSS correction signals. Data on service availability and status can be found on the EGNOS User Support platform..
- Meteosat: Meteosat satellite data are available through the EUMETSAT platform. There are different levels of access, including some free data and some subject to registration or payment. For imagery and meteorological products you can access the EUMETSAT Data Centre..
In terms of open access, Copernicus is the only programme that offers open and unrestricted data. In contrast, Galileo and EGNOS provide free services, but not access to raw satellite data, while Meteosat requires registration and in some cases payment for access to specific data.
Conclusions
The Copernicus, Galileo, EGNOS and Meteosat programmes not only reinforce Europe''s space sovereignty, but also ensure access to strategic data essential for the management of the planet. Through them, Europe can monitor climate change, optimise global navigation, improve the accuracy of its positioning systems and strengthen its weather predictioncapabilities, ensuring more effective responses to environmental crises and emergencies.
Spain plays a fundamental role in this space infrastructure, not only with its aerospace industry, but also with its control centres and reference stations, consolidating itself as a key player in the development and operation of these systems.
Satellite imagery and data have evolved from scientific tools to become essential resources for security, environmental management and sustainable growth. In a world increasingly dependent on real-time information, access to this data is critical for climate resilience, spatial planning, sustainable agriculture and ecosystem protection.
The future of Earth observation and satellite navigation is constantly evolving, and Europe, with its advanced space programmes, is positioning itself as a leader in the exploration, analysis and management of the planet from space.
Access to this data allows researchers, businesses and governments to make more informed and effective decisions. With these systems, Europe and Spain guarantee their technological independence and strengthen their leadership in the space sector.
Ready to explore more? Access the links for each programme and discover how this data can transform our world.
| Copernicus | https://dataspace.copernicus.eu/ | Download centre |
|---|---|---|
| Meteosat | https://user.eumetsat.int/data-access/data-centre/ | Download centre |
| Galileo | https://www.gsc-europa.eu/galileo/services/galileo-high-accuracy-servic…/ | Download centre, after registration |
| EGNOS | https://egnos-user-support.essp-sas.eu/ | Project |
Figure 5. Source: own elaboration
Content prepared by Mayte Toscano, Senior Consultant in Data Economy Technologies. The contents and points of view reflected in this publication are the sole responsibility of the author.
Noticia
The European Data Portal (EDP) has presented its report "Copernicus data for the open data community", prepared by con.terra as part of the EDP consortium. As we have reported before, Copernicus is the European Union's Earth Observation program that provides accurate, timely and easily accessible information to improve environmental management, understand and mitigate the effects of climate change and ensure civil security.
The report aims to help users harness the potential of Copernicus data to create Earth observation applications by answering three basic questions:
- What can I do with Copernicus data?
- How can I access the data?
- What tools do I need to use the data?
After an introduction reviewing the main activities and services available from the program, the report is divided into two parts: a first part where examples of Copernicus data applications are examined and a second, more practical part, where a particular use case is replicated in depth.
Copernicus use cases
The first part covers a series of possible use cases at a general level to answer the first of the questions posed above: what can be done with Copernicus data?
The use cases discussed are linked to the thematic areas addressed by the Copernicus program (emergency, security, marine, land, climate change and atmospheric monitoring), as well as to its services and tools. These examples cover the observation of plastic pollution of the oceans, land change due to mining activities, the impact of volcanic activities, ice loss, the creation of artificial islands, deforestation, forest fires, storms or pests.

The report highlights the importance of knowing what data are appropriate for each specific use case. For example, SENTINEL 2 MSI data is suitable for land monitoring, emergency management and security services, while SENTINEL 3 Altimetry data is linked to the areas of marine monitoring and climate change. To assist in this identification task, the guide includes references to various user guides with specifications on the missions, the instruments used to collect the data and the data products generated.
Case study on the use of Copernicus data
The second part of the report focuses on a particular use case that it addresses in depth, including how to download the appropriate data, process it and build applications with it. Specifically, it addresses the mapping of the lava flow of the Etna volcano using data from the Copernicus emergency management service. The aim is to track the impact of volcanic activities on nature and urban areas.
First, the report shows how to search and download data for this area of interest. In this case, Sentinel-2 products are used from the Copernicus Open Access Hub. The entry point for accessing the Copernicus data is their own website, which provides an overview of the data access points. Through different images, the report shows search and filter options to locate the appropriate data.

To visualize and process the data, it is proposed to use commercial software such as ArcGIS Pro, free GIS tools such as QGIS, open source processing tools such as SNAP or programming libraries such as GDAL. In the case of the example, SNAP (Sentinel Application Platform), the European Space Agency (ESA) platform, is used to view the lava flow.
Some explanations on workflow automation with the Open Access Hub API and the SNAPgraph tool are given at the end of the chapter.
Final conclusions
The report ends with several conclusions, among which the following stand out:
- Users can extract great value from Copernicus data but to do so they need to be familiar with the platforms involved and the necessary tools.
- For most use cases, it is necessary to combine Copernicus data with in situ data. The Copernicus program itself uses data from ground-based sensors, for example, for calibration and validation of its products.
Spain's role in Copernicus
The Ministry of Transport, Mobility and Urban Agenda, through the National Geographic Institute, and the Ministry for Ecological Transition (MITECO) represent Spain in the Copernicus User Forum, for the monitoring and evolution of the program. In this interview Nuria Valcárcel, Deputy Assistant Director (Observation of the Territory) of the General Directorate of Geodesy and Cartography, in the D.G. National Geographic Institute (IGN) delves into the services of Copernicus and its usefulness in the economic and social field.
In datos.gob.es you can also find this other interview with Stéphane Ourevitch, founder of SpaceTec, who participated as a speaker at the Encuentro Aporta 2019, where he tells us about the usefulness of data for space observation and how the Copernicus program promotes entrepreneurship through actions such as hackathons.
Copernicus data are very useful all over the world. In our country, we also find multiple services and applications developed based on Copernicus data, some of which are collected in this article.
Noticia
After having been postponed due to the confinement before the Covid-19, last Thursday 24 September the XVII edition of Databeers was held by videoconference, in the framework of the Hackaton Copernicus Malaga. The event could also be followed by streaming via Youtube, maintaining the open and free character of the community meetings, which started in Malaga five years ago. This new format aroused the interest of the audience, with more than a hundred people registered and a wide repercussion on social networks.
A new format with many advantages
Held in the context of the Hackaton Copernicus Malaga, this edition of Databeers focused on the projects and applications based on open data and services from the European Earth Observation Programme Copernicus.
There were five talks, all of them of short duration, informative tone and close to pecha-kucha format, given by prestigious national and international experts. A tasting of different varieties of beer was interspersed with these talks. San Miguel, a brand that has supported Databeers Málaga since 2018, brought the beers to the homes of those attending the event.
The event began with a presentation by María Sánchez, coordinator of the Initiative, who highlighted that this edition meant a great challenge in terms of organisation, given the need to carry out the event safely, but without losing its essence "through a screen, beer and networking included, differentiating us from the many webinars held nowadays". Although - commented Sánchez - the screen limits the interaction and experience that takes place in a bar, the virtual format opens up new possibilities, and made it possible to have speakers from different geographical locations and to connect many people beyond Malaga.
5 interesting talks on applications of Copernicus data
The opening speaker for this Databeers Málaga Copernicus special was Kevin Ramírez, Copernicus coordinator at Climate-KIC, who showed the potential of the initiative and its data as a tool to support a sustainable future. He was followed by Felipe Fernández, head of the Information Technology and Supercomputing Group at IHCantabria, who shared the results of the ApliCop project, designed to identify the actors in Copernicus Spain and to promote their collaboration and innovation through projects with data, some of which we have already covered in this article.
In this sense, from GMV Aerospace and Defence S.A.U., Jesús Ortuño and Julia Yagüe presented their work with remote data for sustainable forest management, while Juan Arévalo Torres, director of the Malaga-based company Randbee Consultants, focused on the way in which content and stories can be constructed, through storytelling and different visualisation techniques, to make the data attractive and understandable for citizens.
The event was closed by Sonia Castro, coordinator of open data at the public entity Red.es, who explained to those present the role of the Aporta Initiative in promoting interaction and citizen participation in the generation, use and reuse of open data. During her presentation, she toured the different sections of datos.gob.es, highlighting its usefulness for users who want both to locate new datasets and to identify use cases and keep up to date with all the new developments in the open data ecosystem in Spain. She also highlighted the guides we offer users and the interaction channels through which they can send us their requests and suggestions.

As usual, the event was recorded thanks to the collaboration of David Bueno (CEMI Málaga) and is available through the Databeers Málaga Youtube channel. Recordings of the talks and presentations used will soon be shared via www.databeersmlg.com. In this space you can find a lot of material, from this and other events, whose license allows its use and reuse. It is a good way to generate knowledge beyond the face-to-face events and the local environment.
Blog
Copernicus is one of the geospatial data programmes that is most in demand and the focus of attention of various organisations, private companies and citizens. The programme is run jointly by the European Space Agency (ESA) and the European Union through the European Environment Agency, and has two clear objectives: to observe the environment in order to support strategies for mitigating and adapting to climate change, to manage emergencies efficiently and to improve the security of each citizen; and to provide accurate and up-to-date information that is easily accessible to everyone.
The Copernicus programme provides data and information services without restrictions and free of charge on many areas of application thanks to the different technologies used, ranging from satellites in space - including Sentinel satellites - to sensor systems on land, at sea and in the air. Copernicus transforms the data obtained from the satellite into valuable information, thanks to the processing and analysis of the information, its integration with other sources, and the validation of the results.
Through these data, both private and public organisations can create products and services of great economic and social value. The Copernicus programme itself highlights three of these on its website that are linked to our country:
Carbon mapping of forest trees
Agresta S.Coop in collaboration with several Universities of Almeria (Spain) and Delaware (USA), has developed a new methodological approach to improve the national aerial carbon map. The ecosystems of the Iberian Mediterranean area are highly sensitive to climate change and it is therefore essential to monitor and manage organic carbon in these areas. Traditionally, LIDAR technology has been used to measure the carbon density of vegetation, but the data obtained by this means have longer repetition cycles than those provided continuously by satellites. For this reason, programmes such as Copernicus are essential to develop better management of the study area. In this case, thanks to Copernicus Global Land Service it has been possible to integrate the necessary data with high resolution vegetation images, thereby improving the viability and study of the area.
More information in this fact sheet.

Forest Fire Risk through vegetation stress
At present, forest fires are a constant threat to the ecosystem in Spain, which continues to grow due to the drought that the land suffers as a result of climate change and a decreasing forest control. Monitoring, studying and controlling the state of vegetation and wooded areas through geospatial programmes such as Copernicus is essential to curb fires. Thanks to them, it is possible to know the dryness of the land and the load of inflammable elements in the area. The Castilla-La Mancha Forest Fire Service is working in this direction, using this data for management and decision-making in the forest environment, not only in operational phases but also in emergency situations.
More information in this fact sheet.

Customs: arrest of drug traffickers
The maritime accesses to Spain and Portugal are strategic entry points for drug smuggling. A large deployment of customs authorities fights every day side by side to stop drug trafficking by investigating the different transit routes already known. Geolocation systems such as Copernicus help in this difficult task. Thanks to the combination of different technologies and available SAR satellites, the search for suspicious vessels at sea becomes less complicated. A real example of use is this joint operation of the National Police and the Tax Agency, which has involved the collaboration of the Portuguese police, the American DEA and the British NCA, where nearly two and a half tonnes of cocaine were intercepted.
More information in this fact sheet.

Other use cases of Copernicus
In addition to these 3 examples highlighted on Copernicus' own website, there are many more Copernicus' use cases.
One way to find out more about Copernicus' use cases is to visit Aplicop's website. Aplicop is a project funded by the European Commission, responsible for "disseminating the Copernicus programme, facilitating the use of the programme's products in Spain, and connecting users and providers of the Copernicus ecosystem in Spain". Among other actions, its website collects examples of use cases, through the following form. These examples are shown on a knowledge map, together with other components of the Copernicus ecosystem.
On ApliCop's website we also find information about upcoming events that promote the construction of services and applications based on Copernicus information services, such as the next Copernicus Hackathon Malaga to be held from 18 September to 3 October in the Andalusian city.
Copernicus continues to drive the reuse of the data it provides
As we have seen, the opportunities for geospatial data to generate benefits for society, the economy and the environment are numerous. The Copernicus programme itself aims to continue promoting the creation of valuable services based on geospatial information, which it provides through different acceleration and incubation programmes. A great opportunity for entrepreneurs and start-ups who want to be part of this interesting ecosystem.
More information about Copernicus
If you want to know more about the project, you can visit the following links:
- In this article you can find out more about Copernicus' information services and Spain's role in the European Observation Programme.
- In this interview, Nuria Valcárcel, Deputy Director (Territory Observation) of the Subdirectorate General of Geodesy and Cartography, in the D.G. National Geographic Institute (IGN) of the Ministry of Development, the body that represents Spain in the Copernicus Users' Forum, for the monitoring and evolution of the programme, together with the Ministry for Ecological Transition (MITECO), looks in depth at the Copernicus services and highlights other examples of use such as this application for the environmental control of ports developed by NOLOGIN.
Content elaborated by datos.gob.es team.
Evento
After postponing the Databeers Málaga, scheduled for April in the framework of the Hackathon Copernicus Málaga, due to the confinement before the Covid-19, both events have a new date of realization:
- The XVII Databeers Málaga will take place on September 24th from 20 hours and will be held by videoconference.
- On the other hand, the hackathon will start on September 18th, also online, and will last until October 1st.
Databeers Malaga addresses the opportunities of Copernicus data
Given the context, the new edition of Databeers Málaga will be focused on talks about data visualization projects and applications with open data and services around the Copernicus lines of action.
The Copernicus project collects and stores data about the planet, through satellites in space and technologies such as measurement systems on land, sea and air. Copernicus offers this data in open format for use and reuse.
The Aporta Initiative, among the participants of the event
On this occasion there will be five talks, all of them of short duration, informative tone and format close to pecha-kucha. Almost all of them will show projects and applications around Copernicus' lines of action, atmospheric monitoring, marine environmental monitoring, land monitoring, climate change, emergency management and security.
The speakers will be the following:

- Kevin Ramirez, Copernicus coordinator at Climate-KIC, will open the event by showing its potential as a tool to support a sustainable future.
- Felipe Fernández, head of the Information Technology and Supercomputing Group of IHCantabria, will bring us closer to the Copernicus Spain network through a project designed to identify its actors and generate network (ApliCop).
- Juan Arevalo Torres, director of the company Randbee Consultants, will give a talk on "Storytelling with Copernicus data and services".
- Julia Yagüe, Member of the Remote Sensing and Platform Services Division of GMV Aerospace and Defence S.A.U., will show us the potential of remote data for sustainable forest management.
- Sonia Castro, Coordinator of open data in the public entity Red.es, will give a tour of datos.gob.es, highlighting those contents of most interest to the target audience of the meeting. It will be highlighted how to find data and practical applications of them; where to locate materials of interest for those who are entering into the development of digital content solutions, as well as the latest developments that from the Aporta Initiative are being carried out.
All this is coordinated by María Sánchez, who has already told us about the advantages of this type of event in this interview.
Digital format without losing the essence
Databeers Málaga has opted for the online format to facilitate the participation of speakers from different backgrounds and their follow-up in a secure way by the participants. "During the summer we held a virtual tasting, with talks also on data, by the hand of San Miguel, one of our sponsors", says Maria Sanchez, "and the experience was successful”. She explains how, despite the distance, the event did not lose the essence of the Databeers community, "including interaction with the speakers over beers, but this time at home”.
Trusting in the response of the community and considering that it can be, in addition, of interest for the own assistants to the hackathon, Databeers Malaga has decided for it to be launched online, recovering to the speakers foreseen for April and with the same approach that then.
How can you participate?
Registration is, as always, free of charge. For this event, it is essential to register previously online before September 18th, both in the Meetup space of the event, where you can also see the complete program, and through the form.
As has been the case in previous events, it will be recorded and the videos will be offered openly, together with the talks’ presentations, through the online space, www.databeersmlg.com, where there is already a large amount of material, whose license also allows its use and reuse. The aim is to generate knowledge beyond the face-to-face events and the local environment.
About Databeers Málaga and collaborators
Databeers Málaga is a community dedicated to organizing events, informative talks and networking around big data, data analysis and visualization applied to different disciplines. Since it started at the end of 2015, there have already been sixteen editions, so far face to face, which have brought together more than 2,200 participants. It is currently coordinated by María Sánchez (@cibermarikiya), professor and researcher in Journalism at the University of Málaga and technician in Innovation at the International of Andalucía, and has the collaboration of the photographer Koke Pérez, Diario Sur, the Municipal Center of Informatics of the Málaga City Council and Cervezas San Miguel. The beer brand, as part of its commitment to economic and social development of the Malaga province, supports Databeers Malaga since the beginning of 2018.