Noticia
After New Year, it seems that Christmas comes to an end, but we still have a date marked on our agenda: Three Kings Day. Adults and children hope to get up on January 6 and discover what the Three Wise Men from the East have brought us. And what better gift than a book that can help us expand our knowledge and skills.
For those who have not yet finished their Christmas purchases and are rushing at the last minute, in datos.gob.es we have collected a selection of books on data and disruptive technologies that can be a good option to gift to your loved ones. We have all levels books: basic, to encourage your younger relatives to study a career focused on data management and analysis (professions that will be highly demanded in the coming years) or advanced, for those professionals who want to improve their knowledge and gain a competitive advantage to boost their career in 2020.
Las bases de Big Data, by Rafael Caballero and Enrique Martín.
What is it about? Disclosure book that explains what Big Data is and how it works, including details and curiosities that allow the reader to better understand the big data world, its processing and the business involved. It also explains basic aspects of the Hadoop ecosystem or databases, both relational and non-relational.
Who is it for? It is an introductory and easy-to-read book. The book does not include a technical vision, but it is detailed and critical so that the reader wants to continue going deeper into the subject.
Storytelling with data. Data visualization for Business professionals, by Cole Nussbaumer Knaflic.
What is it about? A book to learn how to tell stories using data. Cole Nussbaumer tells us about the fundamentals of data visualization through real examples that help to understand the theory in a simple way. The book helps the user to reflect on the stories he/she wants to tell and how to tell them, teaching him to choose different types of graphics and tools according to the audience.
Who is it for? It is a simple and quick-to-read book, perfect for those who work with data, do not have a technical profile and want to improve the way they show the results.
Introduction to Data Science: Data Analysis and Prediction Algorithms with R, by Rafael A. Irizarry.
What is it about? Rafael A. Irizarry presents concepts and skills to solve the challenges of real-world data analysis. The book covers concepts from probability, statistical inference, linear regression, machine learning, R programming, data visualization, predictive algorithms building, file organization with UNIX / Linux shell, version control with Git and GitHub and preparation of reproducible documents.
Who is it for? To first-year data science students, so it is perfect to introduce this subject.
Learning Path: Understanding Tool Integration for Big Data Architecture, by O'Reilly Media
What is it about? The book explains how to integrate Hadoop components with the goal of implementing big data solutions for a variety of use cases, including clickstream analytics, time series problems, transferring data between Hadoop and relational databases, and applications in the finance sector.
Who is it for? Book aimed at professionals with technical knowledge related to the universe of data or advanced students.
Prediction Machines: The Simple Economics of Artificial Intelligence by Ajay Agrawal, Joshua Gans y Avi Goldfarb
What is it about? The book starts from a question: how should companies establish strategies, governments design policies and citizens plan their lives in a world marked by technology and Artificial Intelligence? 3 eminent economists try to clarify this issue by demystifying artificial intelligence and examining it through standard economic theory.
Who is it for? To all those who want to understand the reality of artificial intelligence, although it is especially aimed at entrepreneurs, business leaders or public policy makers.
The State of Open Data: Histories and Horizons, by Tim Davies, Stephen B. Walker y Mor Rubinstein.
What is it about? Book that reviews the lessons learned in the 10 years of the open data movement and looks to the future to make the reader reflect on how open data initiatives will respond to new privacy concerns, and the inclusion of artificial intelligence.
Who is it for? For those involved in the open data ecosystem, but also those who are curious about the evolution of the movement. The book is also available in free version here.
As in previous years, the list is just a selection that we have prepared based on recommendations from experts who collaborate with data.gob.es, but we know that there are many more interesting books on these topics. Therefore, we encourage you to share new recommendations in the comments.
Entrevista
El Bosco, Tiziano, El Greco, Rubens, Velázquez, Goya ... The Prado National Museum has more than 35,000 works of unquestionable value, which make it one of the most important art galleries in the world.
In the year of its bicentennial, we approached the Prado joint with Javier Pantoja, Head of the Digital Development Area, to know what innovative projects has been implemented to enrich the visitors experience.
- In recent years, the Prado Museum has launched a series of technological projects aimed at bringing its collections closer to citizens. How did this idea come about? What is the digital strategy of the Prado Museum?
The Prado Museum teams does not only seek to develop a digital strategy, but we want “the digital” to be part of the global museum's strategy. Therefore, the last 3 strategic plans have included a specific line of action for the digital area.
When we talk about digital strategy in the Prado, we refer to two aspects. On the one hand, we talk about processes, that is, the improvement of internal management. But, on the other hand, we also use digital tools to attract a higher audience to the Prado.
Our intention is considering technology as a tool, not as an end. We have a strong commitment to technologies such as linked data or artificial intelligence, but always without losing the objective of spreading the
- What kind of technologies are you implementing and how are you doing it? Can you tell us some concrete projects?
The most interesting point of the project was the launch of the current Prado website at the end of 2015. We were looking to create a semantic web, conceiving collections and the related information in a different way, that allow us to go further, and generate projects as augmented reading or the timeline that we have recently launched using Artificial Intelligence.
It has been a many-years process. The first task was to digitize and document the collection. For that we needed internal applications that allowed all areas of the museum to nurture the databases with their knowledge in a homogeneous way.
Then, we had to make that information available to the public using semantic web models. That is, we needed to define each element semantically: what a “technique”, a “support”, a “painter”, a “sculptor”, etc. are. It was about creating relationships between all the data to result in knowledge graphs. For example, we want to link Goya to the books that speak about him, the kings who ruled in his time, the techniques he used, etc. The work was tedious, but necessary to obtain good results.
This allowed to create a faceted search engine, which helped bring the collection closer to a much more users. With a boolean search engine, you have to know what you are looking for, while a faceted one is easier to find relationships.
All this informative work of updating, reviewing and publishing information open the way for a second part of the project: it was necessary to make the information attractive, through an aesthetic, beautiful and high-usability web. Do not forget that our goal was "position the Prado on the Internet." We had to create an easy-to-use data web. In the end, the Prado is a museum full of works of art and we seek to bring that art closer to the citizens.
The result was a website that has won several awards and recognitions.
- And how did the augmented reading projects and the timeline come about?
They come up from a very simple matter. Let me give an example. An user accesses to the La Anunciación by Fra Angelico work sheet. This sheet mentions terms such as Fiésole or Taddeo Gaddi. Probably, the majority of the users does not know what or who they are. That is, the information was very well written and documented, but it did not reach the entire audience.
Here, we had two solutions. On the one hand, we could make a basic-level worksheet, but creating a text adapted to anyone is very complex, regardless of their age, nationality, etc. That is why we chose another solution: What does a user do to find something he/she didn´t know? In this situation, users search on Google and click on Wikipedia.
As the Prado Museum cannot be an encyclopedia, we took advantage of the knowledge of Wikipedia and DBpedia. Mainly for 3 reasons:
- It has the precise knowledge structure
- It is a context encyclopedia
- It is an open source
- What challenges and barriers have you found when reusing this data?
First of all, we had to write down all the entities, cities, kings… one by one. The work was impossible, since there are currently 16,000 worksheets published on the web. In addition, the Prado is constantly studying and reviewing publications.
That is why we used a natural language recognition engine: the machine reads the text and the Artificial Intelligence understands it as a human, extracts entities and disambiguates the terms. The machine is processing the language, which it understands based on the context. In this task, we use the knowledge graph we already had and the relationships between the different entities through DBpedia.
The work is carried out together with Telefónica -sponsoring company- and GNOSS -developing company-; and the degree of reliability was very high, between 80% and 90%. Even so, there were complex issues. For example, when we talk about “the virgin's announcement”, we do not know if we refer to the concept, to the church in Milan, to some of the paintings related to this subject... In order to ensure that everything was correct, the documentation service reviewed the information.
- What was the next step?
We already had an increased reading. At this point, we asked ourselves why not making these relationships visible. And so that, the Timeline emerged: a cluster of new knowledge graphs that allowed the user to see in a simpler way the relationships between concepts, result of the exploitation of the linked data web.
Timelines tend to had just one layer, but we wanted to go further and create a multilayer structure that would allow us to understand and deepen the concepts: a layer of history, another layer of literature, architecture, philosophy, performing arts ... In this way we can easily see, for example, what works were created during the 100-year war.
For this, we had to review the datasets and select the concepts according to the interest they generate and their context into the Prado collection.
- These types of projects have great potential to be used in the educational field ...
Yes, our tool has a marked informative intention and has great potential to be exploited in educational environments. We have tried to make it easy for any teacher or disseminator to have at a glance the entire context of a work.
But it could also be used to learn history. For example, you can teach the Spanish Independence War using “The second of May” and “The third of May”, paintings elaborated by Goya. In this way, more active learning could be achieved, based on the relationships between concepts.
The tool has an appropriate approach for secondary and high school students, but could also be used at other stages.
- What profiles are necessary to carry out such a project?
We create multidisciplinary teams, composed of designers, computer scientists, documentaries, etc. to carry out the entire project
There are very good specialists doing semantics, working on linked data, artificial intelligence, etc. But it is also necessary to have people with the ideas to join the puzzle into something usable and useful for the user. That is to say, linking wills and knowledge, around a global idea and objectives. Technological advances are very good, and you have to know them to take advantage of their benefits, but always with a clear objective
- Could you tell us what are the next steps to be followed in terms of technological innovation?
We would like to reach agreements with other museums and entities so that all knowledge is integrated. We would like to enrich the information and link it with data from international and national cultural and museum institutions.
We already have some alliances, for example, an agreement with the National Film Library and the RTVE visual archive, and we would like to continue working on that line.
In addition, we will continue working with our data to bring the Prado collection closer to all citizens. The Museum has to be the first reuser of its data sources because it is who best knows them and who can get a good result from them.
Blog
When planning our vacations, we all look for the perfect destination that meets our expectations: beach, mountain, city... But once we have decided where to go, we still have to make many decisions: how am I going to organize my trip so that everything goes perfect? Luckily, we have hundreds of applications that make our lives much easier.
Nowadays you can use some apps to calculate the most suitable route to reach your destination or to decide where to fill up the car during the journey without damaging your pocket. You can also look for accommodation or restaurants with a good value for money, using your mobile. Or consult the cultural activities of the area, looking for activities aimed at the youngest members of the family. And, if you want to go to the beach, you can easily check the state of the sea, the wind or the temperature of the water without leaving the hotel.
All these applications, in addition to helping us organize our vacations in a simple way, have something in common: their functioning is based on open data from public administrations.
The fact that an increasing number of local administrations are opening their tourism data allows us to generate services that help to manage our trips in a more efficient way, integrating information that is sometimes difficult to find. As an example, Asturias or Aragón are promoting catalogues of specific datasets focused on this area.
Many of these applications have been designed by individuals and companies, reusing available open data, but others have been promoted by the public administrations. This is because tourism open data not only help visitors, but also have great advantages for municipalities.
Tourism is a fundamental economic activity for our country. During the first 5 months of 2018, Spain exceeded 28.6 million international tourists, representing an increase of 2% over the same period of the previous year. These tourists are a great source of economic income: just in May, the average expenditure per tourist was 1,009 euros, 1.8% more than in 2017. It is not surprising, therefore, that all city councils wants to promote their services and attract visitors.
Tourism applications based on open data can favor interaction between visitors and the local community, promoting local services and fostering economic growth. In addition, some applications even allow to collect information from users under their consent. The analysis of this anonymized information, combined with other data sets such as the total expenditure on trips of international tourists who participate in cultural activities or tourists housed by municipalities, allows knowing tourists behavior patterns and designing specific policies with the focus on innovation and intelligent management of tourist destinations.
Traditionally, the tourism sector has a great weight in Spain, but like all sectors, it has to keep renewing itself so as not to be left behind, integrating new elements that help improve the visitor's experience. Open data linked to the use of new technologies such as Big Data analysis and artificial intelligence are a good option - for example to make recommendations and customizations based on user behavior-. The ultimate goal is to provide a high quality global service that allows us to continue being leaders and receiving millions of visitors year after year.
Blog
Data science is reaching all sectors, from agriculture to health, tourism or transport. And culture, as illustrated by the DataLab of Juan March Foundation, a knowledge laboratory that not only seeks to manage and disseminate the contents from the Library, but also extracts valuable information that can be used to optimize processes, take better decisions or create new services.
This DataLab was created in 2013, collecting the experiences learned in the Data Library of the former Center for Advanced Studies in Social Sciences (CEACS) of Juan March Institute. The DataLab was born inside the Juan March Foundation Library in order to lead the organization of digital knowledge produced by the Library itself and the rest of the Foundation's areas, dealing with the structure, curation and analytics of digital data.
The challenge was big. The Foundation had been created in 1955, and, since then, it had accumulated a valuable collection composed of contents with different formats: videos, images, audios, texts... in addition to the large amount of knowledge organized and conserved for internal purposes in the Foundation's departments.
In order to face this challenge, a multidisciplinary team was chosen, integrating librarians, technologists and mathematicians. Using technologies and methodologies specific to data science, they were able to explore new ways of analyzing and visualizing information.
Specifically, the DataLab has 4 areas of action:
- Data curation: One of the main tasks of this DataLab is the management and continuous maintenance of the digital repositories property of Juan March Foundation. Their responsibilities include the classification, documentation, storage, integration and digital preservation of data. Currently these data are disseminated through thematic knowledge portals (for example, focused on contemporary Spanish music or Spanish musical theater), visited by an average of 10,000 users per month, including researchers and specialists in social sciences and humanities that look for an inspiration source for new projects.
- Analytics: One of the new features of this DataLab is its commitment to analytics applied to cultural data. On the one hand, they apply analytical technologies to data curation, which results in automated processes that facilitate the classification of information. On the other hand, they also make use of data analytically. In other words, the DataLab functions as a transversal service that provides business intelligence to other Foundation's areas, through the creation of scorecards and the resolution of specific requests for information and analysis.
- Infrastructure: To implement a project of this magnitude, it was necessary to create an entire technological infrastructure that allow capturing data from different sources, organizing and structuring to take advantage using different tools and processes. Therefore, they are in a continuous process of development to redifine data capture, normalization, analysis and enrichment. All this is carried out using specialized Big Data environments in the cloud.
- Innovation. One of the fundamental pillars of this DataLab is the experimentation with new technologies that can provide an additional value layer to data. For example, data capture processes are enriched thanks to Artificial Intelligence tools, which carry out from sentiment analysis of social media to content transcriptions and automatic classifications.
All this work has resulted in a project in continuous evolution and growth, which makes valuable information available to users, demonstrating the potential of data science applied to culture.
Blog
Until relatively recently, talking about art and data in the same conversation might seem strange. However, recent advances in data science and artificial intelligence seem to open the door to a new discipline in which science, art and technology go hand in hand.
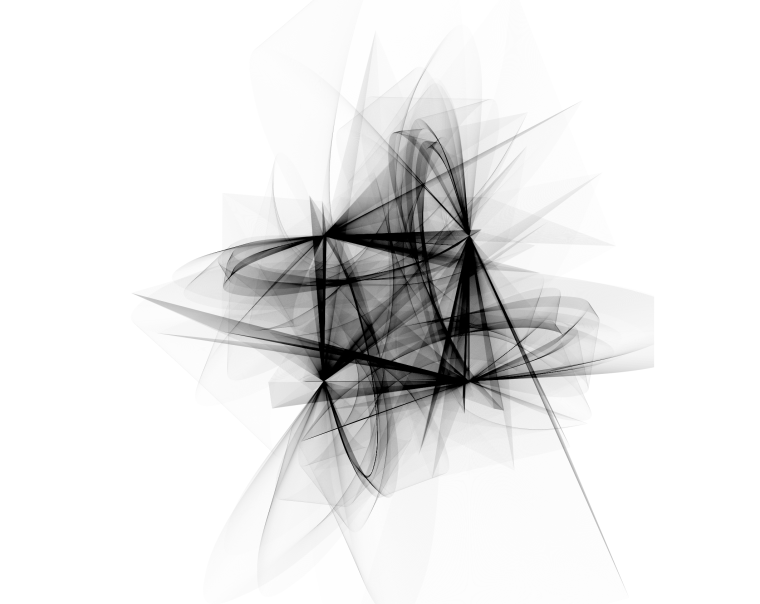
The cover image has been extracted from the blog https://www.r-graph-gallery.com and was originally created by Marcus Volz on his website.
The image above could be an abstract painting created by some modern art author and exhibited at the MoMA in New York. However, it is an image created with some R-code lines that use complex mathematical expressions. Despite the spectacularity of the resulting figure, the beautiful shape of the strokes does not represent a real form. But the ability to create art with data is not limited to generating abstract forms. The possibilities of creating art with code go much further. Here you are two examples:
Real art and representation of plants
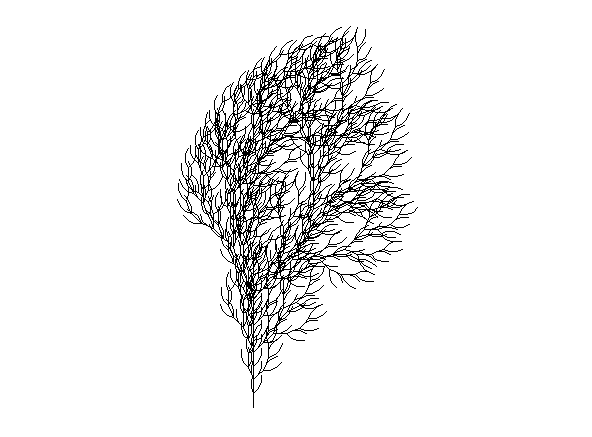
With less than 100 lines of R code we can create this plant and infinite variations in terms of branches, symmetry and complexity. Without being an expert in plants and algae, I am sure that I have seen plants and algae similar to this in many occasions. With these representations, we just try to reproduce what nature creates naturally, taking into account physics and mathematics laws. The figures shown below have been created using the R code originally extracted from Antonio Sánchez Chinchón blog.
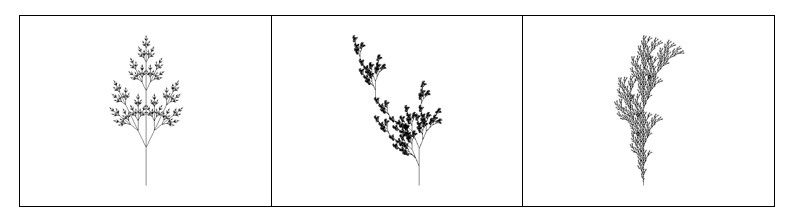
Variations of plants artificially created by R code and fractal expressions.
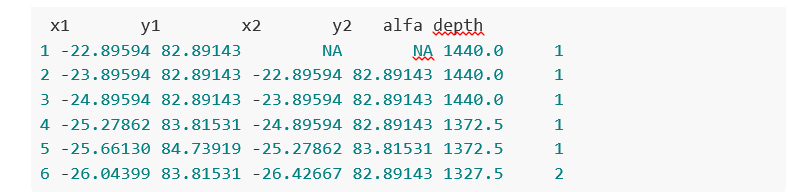
As an example, these are the data that make up some of the figures discussed above:
Photography and art with data
But it is not just possible to construct abstract figures or representations that imitate the forms of plants. With the help of data tools and artificial intelligence we can imitate, and even create new works. In the following example, we obtain simplified versions of photographs, using subsets of pixels from the original photograph. Let's see this example in detail.
We take a photograph of a bank of open images, in this case Wikimedia Commons website, such as the following:
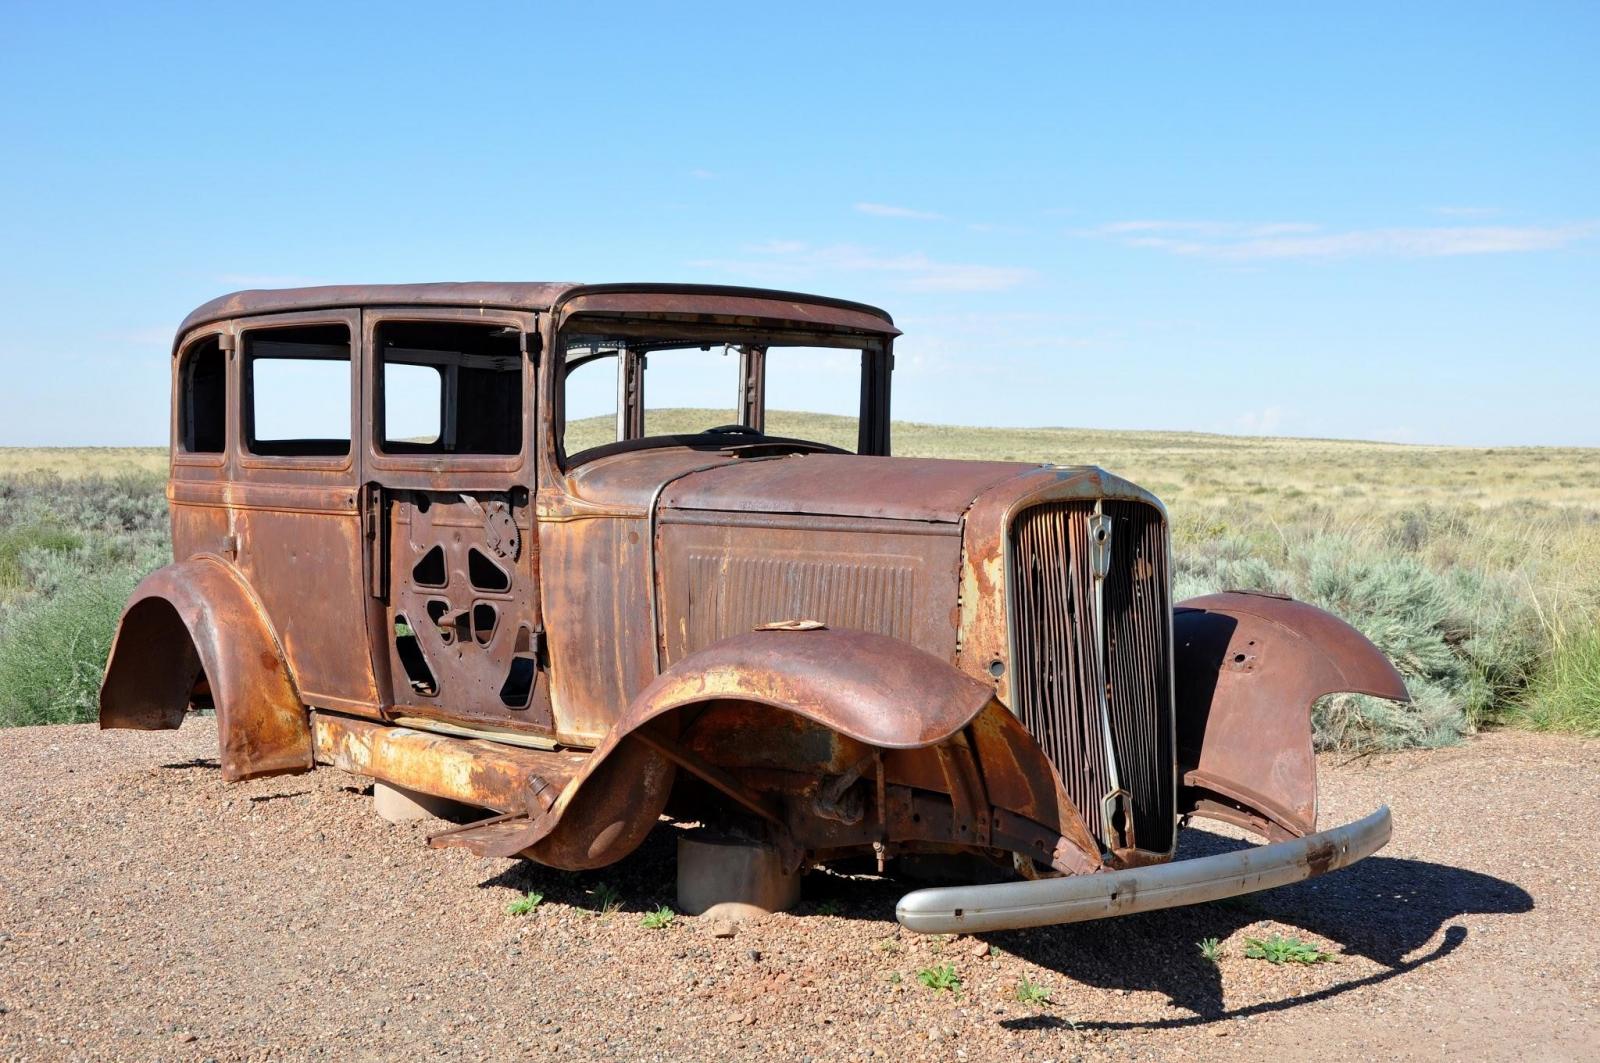
By Finetooth - Own work, CC BY-SA 3.0, https://commons.wikimedia.org/w/index.php?curid=11692574
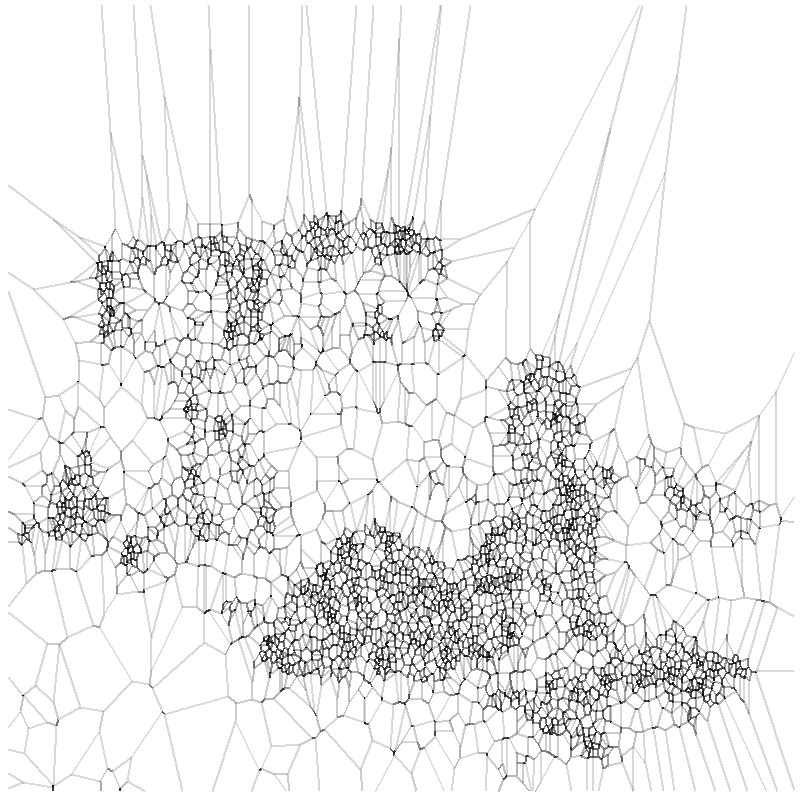
Next, we execute a relatively simple algorithm that generates polygonal shapes around the main pixels of the original image. In addition to a simple images treatment to turn this photograph into a flat black and white image, this algorithm applies a mathematical method called Voronoid diagram. When the subset of data (on which we apply the Voronoid diagram) is small, the result of the treatment is poor and we can barely distinguish the underlying form of the figure.
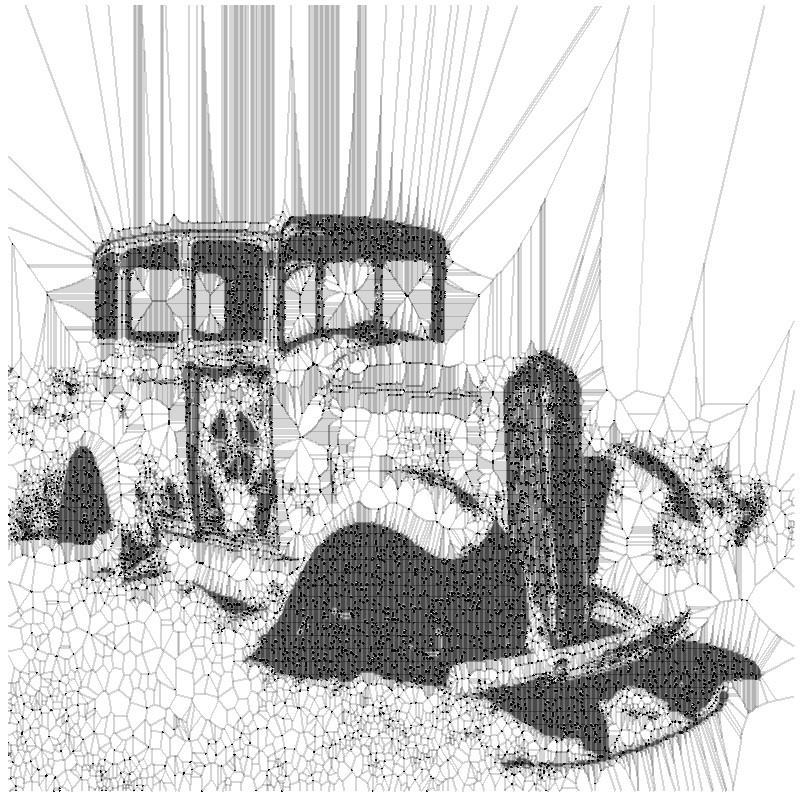
However, as we increase the subset of points to reproduce the initial photograph, we begin to find fascinating results. Finally, with less than 20% of all the points that make up the original image, we obtain a really beautiful and artistic result. This experiment is based on the original post by Antonio Sánchez Chinchón on his blog Fronkostin.
The ability to generate art with the powerful combination of mathematics and programming codes is absolutely powerful. In the following link it is possible to appreciate some of the most impressive works that exist in this art form. The author of this blog is Marcus Volz, researcher at the University of Melbourne. Marcus works with R to generate the figures in two dimensions and with Houdini for 3D and animation.
Content prepared by Alejandro Alija, expert in Digital Transformation and innovation.
Contents and points of view expressed in this publication are the exclusive responsibility of its author.
Empresa reutilizadora
They use data to make current visualizations (graphs and maps). These graphics are subsequently published on different websites, mainly digital media.
Noticia
The presentation of the BNEscolar project took place on July 2. The event was attended by the Secretary of State for Education, Alejandro Tiana, the General Director of the National Library of Spain (BNE), Ana Santos, and the General Director of Red.es, David Cierco.
BNEscolar is a portal aimed at the educational community where you can find digital content created using the documentary collection of the Biblioteca Digital Hispánica. The project, developed by the BNE and Red.es, is framed in BNElab, a space that concentrate BNE's new digital strategy. This portal and all its resources aim to promote access and reuse of the library's digital resources, showing the Spanish-speaking educational community formulas and methodologies that allow creating new content for its teaching application.
Specifically, BNEscolar is aimed at teachers and pre-university students, with special focus on the last levels of Primary and Secondary Education. All of them will have at their disposal various contents and functionalities:
- Search engine. After a detailed analysis, the BNE has selected those contents of the Hispanic Digital Library that have a high potential to be used as learning resources, in accordance with the educational programs of the formal education. These contents have been enriched with metadata that facilitate their search. Through a search engine, users can filter the contents according to different parameters, such as the educational level or the subject they are most appropriate for. Other filters that are included are authors, languages or types of resources (texts, illustrations, audios, etc.).
- Didactic sequences. Teachers and students have at their disposal didactic sequences with different activities and challenges to resolve using BNE resources. All the contents are accompanied by methodological guides for its use in the classroom. The objective is to promote project-based learning, and the active and collaborative participation of students. For example, one of the didactic sequences is a role-playing game for a better knowledge of the Semana Trágica: Students will have to put themselves in the shoes of the people involved and recreate the events that took place in real time using Twitter or Instagram.
- Interactive challenges. One aspect that has been taken into account from the origin of the project is the incorporation of playful elements that invite to work with the BNE resources. Two applications have been created based on the reuse of its contents: a digital escape game, located at the San Petesburg Arts Academy, and a geolocalized question-answer game.
- Workshops and videos. Through different workshops, students will be able to deepen in a selection of contents in a practical way, using digital tools. In addition, a series of short videos have been included to review the contents in a fun and entertaining way.
- My BN Escolar. BNEscolar also includes a personal section for teachers where they can organize their resources and create collections. The BNE invites teachers to reuse the materials of the Library to develop their own contents or dynamic sequences
The portal has been valued, in a first pilot phase, by a set of educational centers. This collaboration has allowed to validate the contents so that they respond to the technical and curricular needs of the students and teachers. Now a second phase begins, in which a broad dissemination is planned through social networks in order to reach the entire educational community. The expansion of the BNEscolar contents is also underway. Developing BNEscolar has taken months of work. BNEscolar expands, develops and improves an initial proposal.
BNEscolar joins the list of projects developed by the BNE in favor of opening and reusing our cultural heritage, such as comunidad.bne.es or ChefBNE. On this occasion, the focus is on education and the informational competence of teachers and students, a key aspect to be critical, creative and autonomous citizens in the digital society.
Noticia
After months of work, the second edition of the Barcelona Dades Obertes Challenge has come to end. Leading by the City Council of Barcelona and with the collaboration of the Consorci d'Educació de Barcelona and CESIRE, the project seeks to promote the knowledge and use of open data in schools in the city.
The final act took place on May 8 at the Fábrica de Creació de Fabra i Coats. In front of more than 300 attendees, Laia Servera, journalist and director of InfoK - the news program of Super3, the children's channel of Catalonian Television - acted as master of ceremonies. The event was also attended by Màrius Boada i Pla, Director of the Municipal Office of Dades, responsible for opening and closing the session, and national and international experts through video-conference: Martin Alvarez Espinar, director in Spain of the World Wide Web Consortium (W3C), Antje Kirchner, Survey Methodologist and head of the BigSurv18 congress, Esther Huyer, representative of the European Data Portal, and Taisuke Matsuzaki, representative of the Kobe City Council who commented on the experience of the World Data Viz Challenge 2018 Barcelona-Kobe .
During the event, the students of the 8 finalist centres had the opportunity to present and defend their work. After the jury deliberation, the prizes were awarded as follows:
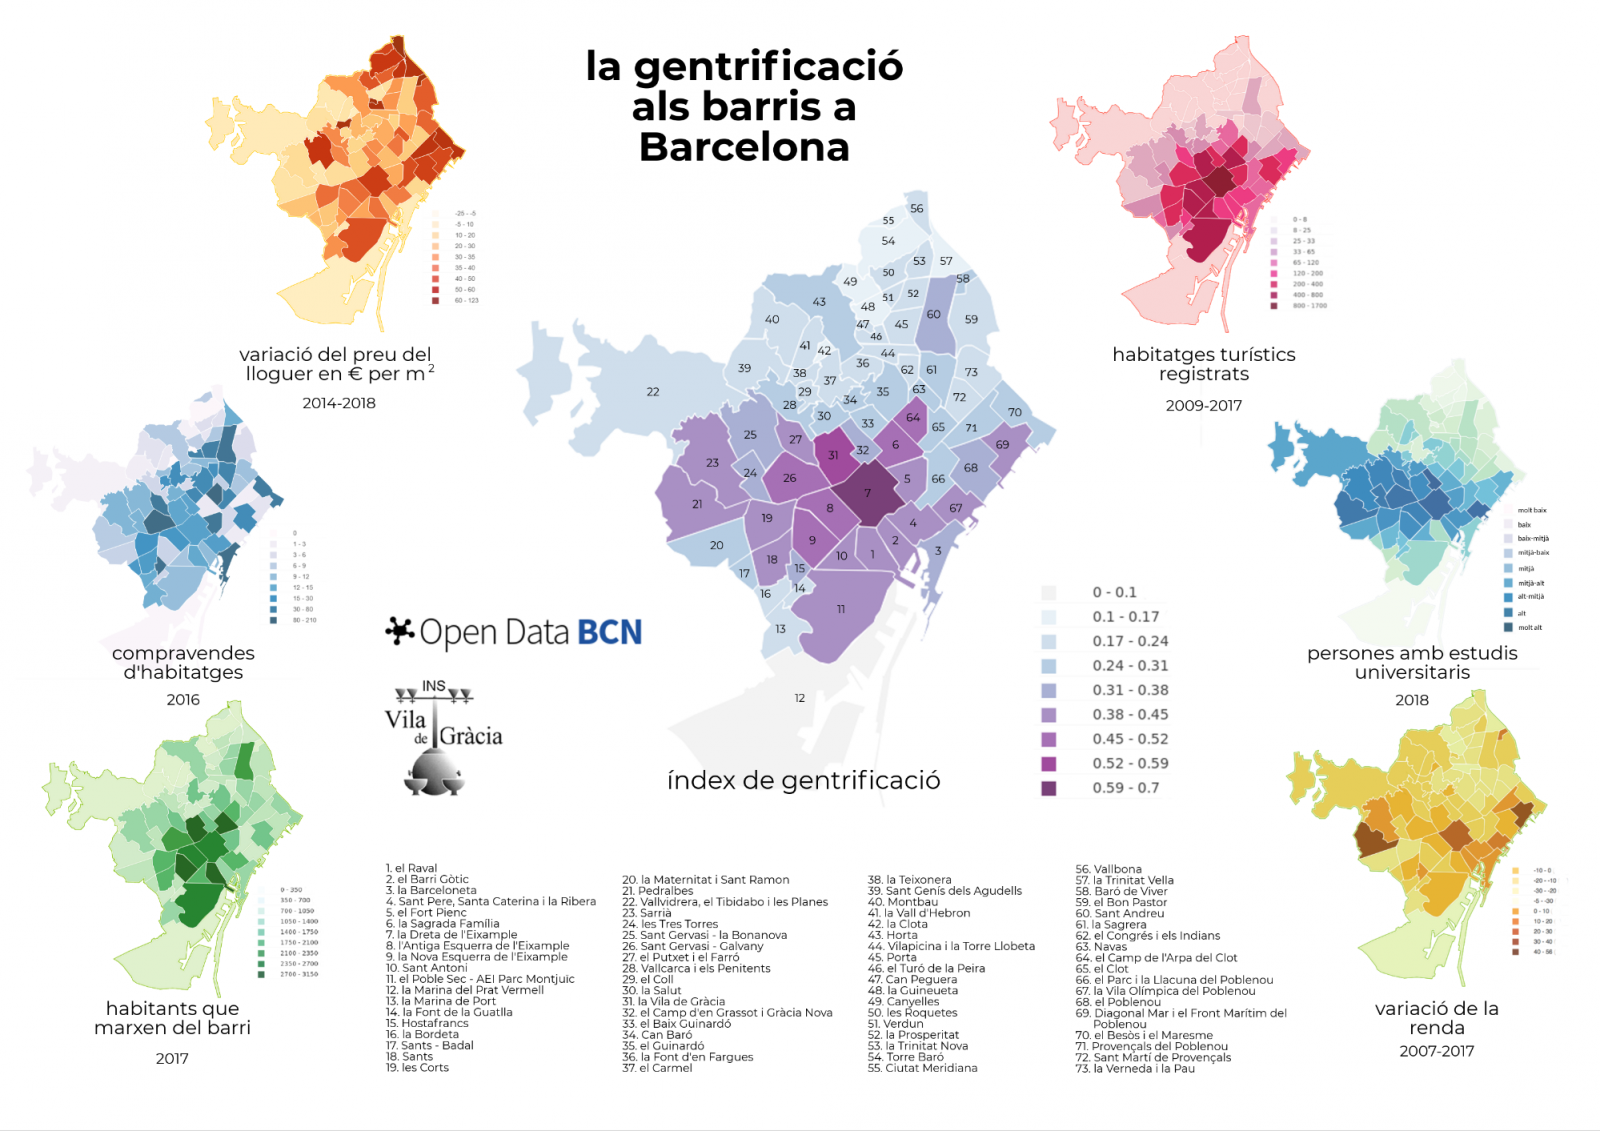
- The first prize went to the Institut Vila de Gràcia in Barcelona, with the project "La gentrificació als barris a Barcelona" (Gentrification in Barcelona neighbourhoods). The objective of the project was to show the process of urban transformation caused by strategic speculative actions that cause the displacement of the original population from one neighbourhood to another. To do this, the students developed a gentrification index, using datasets such as Number of inhabitants that leave their neighbourhoods, Purchase in relation to total housing or Rent variation in € / m2.
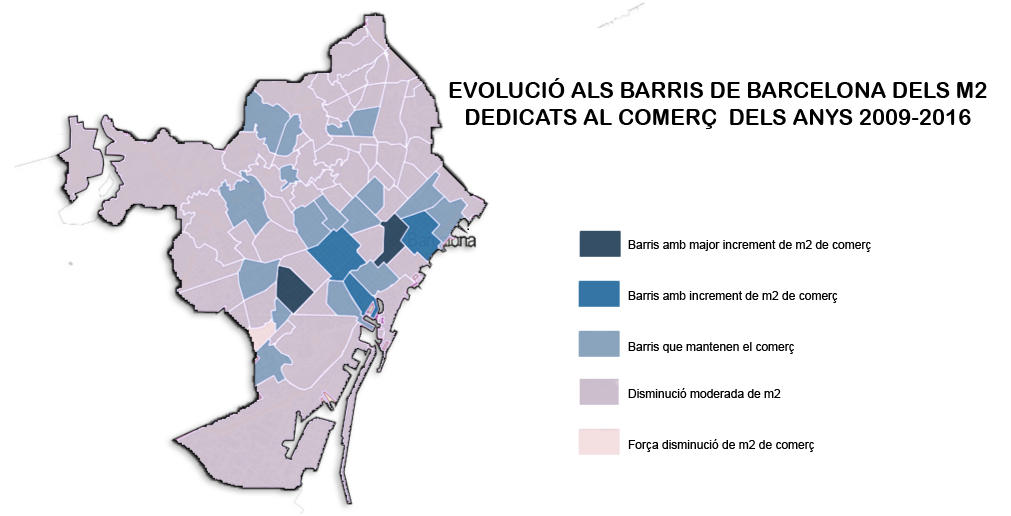
- The second prize went to the Institut Lluïsa Cura with "Evolució del comerç als barris de Barcelona" (Commerce evolution in Barcelona neighbourhoods). With this projects, the students wanted to confirm that traditional commerce was losing market share due to international brand stores and new forms of small convenience stores. For this, they used data related to the surface of the cadastral premises in Barcelona city.
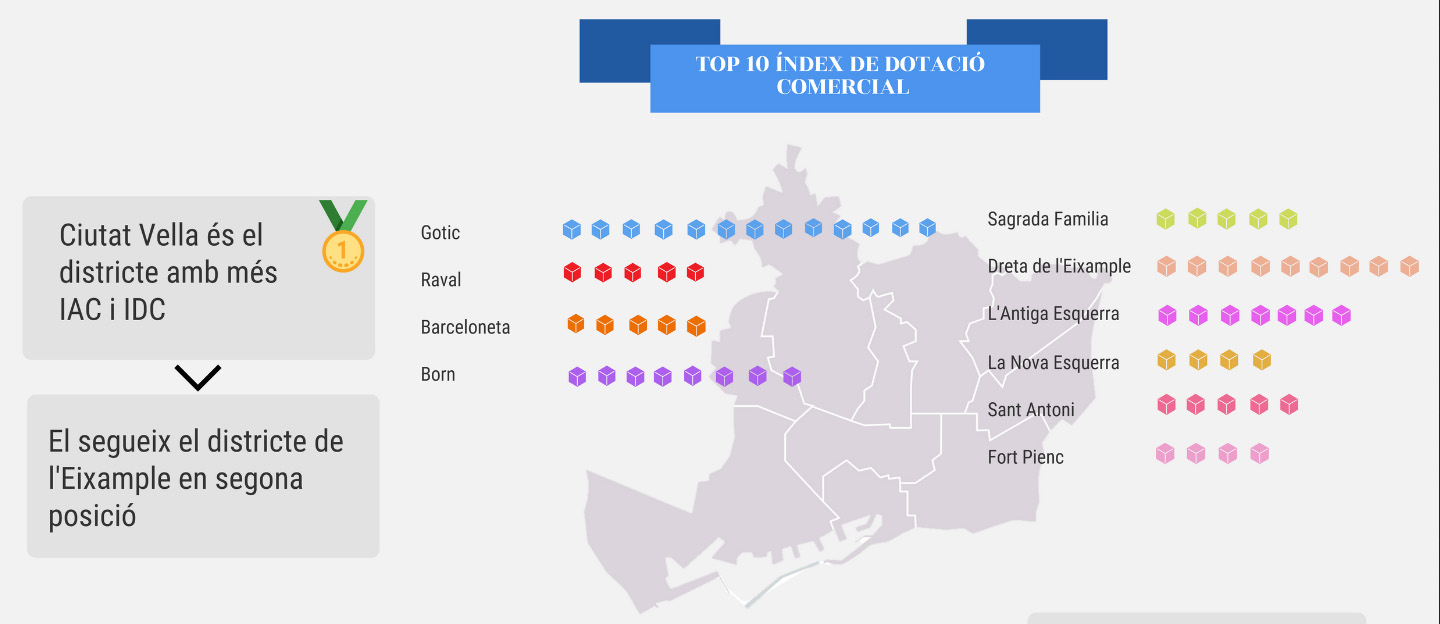
- The third prize went to the Institut Joan Brossa and his "On locate the meva botiga to Barcelona?" (Where to locate my store in Barcelona?). The analysis was based on the comparison of the Commercial Endowment Index and the Commercial Attraction Index.
Highlight the great effort that teachers and students have made one more year to create very interesting projects. You can learn more about the winning projects and the rest of the finalist projects here.
Congratulations to the winners and all the participants! Now we only have to wait for the third edition 2020, which will surely be also a success.
Noticia
A couple of weeks ago, the Spanish National Library (BNE) presented its collaborative work platform, comunidad.bne.es, developed together with Red.es, in an event that brought together dozens of collaborators interested in our cultural heritage.
Since then, almost 200 people have participated in the proposed projects, with 2,000 completed tasks, which shows the success of the initiative. However, they are still looking for collaborators who want to help enrich the Library data, making them more accessible and easy to reuse.
Any citizen can collaborate, either anonymously or by registering on the platform, which allows participating in the rankings and statistics of the portal.
The projects open to citizen participation are structured around 5 areas: identification and transcription, georeferencing, audio transcription, marking and labeling, and data enrichment. As an example and starting point, 7 projects have been proposed to show the available functionalities, using different types of collections:
- Jean Laurent was here - and that is how he saw us -. The collaborators will help to place on the current map the places that appear in the images of Jean Laurent. French by birth, Jean Laurent, lived a great part of his life in our country and immortalized with his camera some of the most convulsive moments of our history: the reign of Isabel II, the democratic Sexenio with the reign of Amadeo de Saboya, the I Spanish Republic and the Bourbon Restoration with the arrival of Alfonso XII.
- Unidentified. The BNE has selected a series of photographs of the Civil War whit unidentified characters. Knowing who these, often anonymous, people were would be practically impossible without citizens help, who can recognize a relative or acquaintance in the images. The BNE gives the opportunity to name these characters and tell their story.
- What does it sound like? The objective of this project is to obtain as much information as possible about musical groups from the BNE catalog. To do this, people who want to collaborate must answer a series of questions about the different bands, such as what the group musical genre is, where they come from or if the group is still active.
- Candilejas. This project seeks to identify actors, actresses and people from the theater (pointers, orchestra and stage directors, musicians...) through a series of nineteenth-century theater posters. The collaborators will help transcribing the names that appear in the images, relating them with certain companies and represented works, which will allow us to get an idea of the Spanish theater panorama of two centuries ago.
- A dictionary, a Swedish diplomat and ninetheenth-century Spain. In the 19th century Gustaf Daniel Lorich, a Swedish diplomat expert in numismatics who lived in Spain, wrote a dictionary called Graphic description of ancient Spain and its correspondence with modern Spain. This manuscript document, whitout known printed version, collects place names and descriptions of the locations that hevisited or studied during his work. The BNE looks for collaborators that help transcribe it to know its correspondence with our current environment.
- Who is who? This project consists of transcribing information about the members of the 1869Constituent Assembly, portrayed in one of the library albums. Collaborators can see various portraits and indicate the character name, position and location.
- To my distinguished friend. Many of the collections guarded by the BNE have handwritten dedications between their pages and images, documents of great value that need to be transcribed to facilitate their conservation and identification.
In addition, the BNE developed a sample project to illustrate the result of this kind of projects: Clifford´s Madrid, where is identified the different places of Madrid that appeared in a series of images taken by Charles Clifford, contemporary of Jean Laurent. The result of the project was the generation of new data (in JSON, CSV and XMLformat), a visualization and a timeline.
These projects are just a sample of the potential of citizen collaboration. During the next weeks and months, the BNE will suggest new proposals for collaborative enrichment and increase the platform's functionalities. In addition, any citizen could suggest new ideas, just sending an email to bnelab@bne.es.
Citizens possess a great knowledge, result of our learning, but also of our daily experiences, a knowledge that sometimes is not easy to acquire otherwise. Therefore, our collaboration is essential to enrich our cultural heritage, while making it more accessible and reusable.
Empresa reutilizadora
Smartvel builds b2b content marketing solutions for airlines, hotel chains, travel agencies and tourism entities. They collect, monitor, classify, index, geolocate and translate segmented content from different sources. Then, they integrate this content, easily and quickly, into their client websites, driving user experience
In short, they provide a content solution that lets tourist know what to do in a specific place, mixing the destination's living agenda (events, culture, sports, etc.) with the points of interest (monuments, restaurants, etc.) and the own layers that their customers want to show.