Blog
Programming libraries refer to the sets of code files that have been created to develop software in a simple way . Thanks to them, developers can avoid code duplication and minimize errors with greater agility and lower cost. There are many bookstores, focused on different activities. A few weeks ago we saw some examples of libraries for creating visualizations , and this time we are going to focus on useful libraries for machine learning tasks .
These libraries are highly practical when implementing Machine Learning flows . This discipline, belonging to the field of Artificial Intelligence, uses algorithms that offer, for example, the ability to identify patterns in massive data or the ability to help develop predictive analysis.
Below, we show you some of the most popular data analysis and Machine Learning libraries that currently exist for the main programming languages, such as Python or R:
Libraries for Python
NumPy
- Description:
This Python library is specialized in mathematical computation and big data analysis . It allows working with arrays that allow representing collections of data of the same type in various dimensions, as well as very efficient functions for their manipulation.
- Support materials:
Here we find the Beginner's Guide , with basic concepts and tutorials, the User's Guide , with information on general features, or the Contributor's Guide , to help maintain and develop the code or write technical documentation. NumPy also has a Reference Guide that details functions, modules and objects included in this library, as well as a series of tutorials to learn how to use it easily.
Pandas
- Description :
It is one of the most used libraries for data processing in Python . This data analysis and manipulation tool is characterized, among other aspects, by defining new data functionalities based on the arrays of the NumPy library . It allows you to easily read and write files in CSV, Excel format and specify queries to SQL databases .
- Support materials:
Its website has different documents such as the User's Guide , with detailed basic information and useful explanations, the Developer's Guide , which details the steps to follow when identifying errors or suggestions for improvements in functionalities, as well as the Reference Guide , with a detailed description of its API. In addition, it offers a series of tutorials contributed by the community and references on equivalent operations in other software and languages such as SAS, SQL or R.
Scikit-learn
- Description:
Scikit-Learn is a library that implements a large number of Machine Learning algorithms for classification, regression, clustering , and dimensionality reduction tasks . In addition, it is compatible with other Python libraries such as NumPy, SciPy and Matplotlib (Matpotlib is a data visualization library and as such is included in the previous article ).
- Support materials:
This library has different help documents such as an Installation Manual , a User's Guide or a Glossary of common terms and elements of its API . In addition, it offers a section with different examples that illustrate the features of the library, as well as other sections of interest with tutorials , frequently asked questions or access to its GitHub .
Scipy
- Description:
This library features a collection of mathematical algorithms and functions built on top of the NumPy extension . It includes extension modules for Python on statistics, optimization, integration, linear algebra or image processing, among others.
- Support materials:
Like the previous examples, this library also has materials such as Installation Guides , User Guides , Developer Guides or a document with detailed descriptions of its API . It also provides information on act , a tool for running GitHub actions locally.
Libraries for R
mlr
- Description:
This library offers essential components to develop machine learning tasks, among others, preprocessing, pipelining , feature selection, visualization and implementation of supervised and unsupervised techniques using a wide range of algorithms.
- Support materials:
On its website, it has multiple resources for users and developers, among which a reference tutorial stands out that presents an extensive tour that covers the basic aspects of tasks, predictions or data preprocessing to the implementation of complex projects using advanced functions.
In addition, it has a section that redirects to GitHub in which it offers talks, videos and workshops of interest on the operation and uses of this library.
Tidyverse
- Description:
This library offers a collection of R packages designed for data science that provide very useful functionality to import, transform, visualize, model and communicate information from data. They all share the same design philosophy, grammar, and underlying data structures. The main packages that make it up are: dplyr, ggplot2, forcats, tibble, readr, stringr, tidyr and purrr.
- Support materials:
Tidyverse has a blog where you can find posts about programming, packages or tricks and techniques to work with this library. In addition, it has a section that recommends books and workshops to learn how to use this library in a simpler and more enjoyable way.
Caret
- Description:
This popular library contains an interface that unifies hundreds of functions for training classifiers and regressors under a single framework , greatly facilitating all stages of preprocessing, training, optimization and validation of predictive models.
- Support materials:
The project website contains exhaustive information that makes it easier for the user to tackle the aforementioned tasks. References can also be found on CRAN and the project is hosted on GitHub . Some resources of interest for managing this library can be found through books such as Applied Predictive Modeling , articles , seminars or tutorials , among others.
Libraries to tackle Big Data tasks
TensorFlow
- Description:
In addition to Python and R, this library is also compatible with other languages such as JavaScript, C++ or Julia. TensorFlow offers the ability to build and train ML models using APIs . The most prominent API is Keras , which allows building and training deep learning models (Deep Learning).
- Support materials:
On its website you can find resources such as previously established and developed models and data sets, tools , libraries and extensions , certification programs , knowledge about machine learning or resources and tools to integrate responsible AI practices . You can access their GitHub page here .
Dmlc XGBoost
- Description:
Scalable, portable and distributed "Gradient Boosting" (GBM, GBRT, GBDT) library supports C ++, Python, R, Java, Scala, Perl and Julia programming languages . This library allows you to solve many data science problems quickly and accurately and can be integrated with Flink, Spark and other cloud data flow systems to tackle Big Data tasks.
- Support materials:
On its website it has a blog with related topics such as algorithm updates or integrations, as well as a documentation section that has installation guides, tutorials, frequently asked questions, a user forum or packages for the different programming languages. You can access their GitHub page via this link .
H20
- Description:
This library combines the main algorithms of Machine Learning and statistical learning with Big Data , as well as being able to work with millions of records. H20 is written in Java , and follows the Key/Value paradigm to store data and Map/Reduce to implement algorithms. Thanks to its API , it can be accessed from R, Python or Scala.
- Support materials:
It has a series of videos in the form of a tutorial to teach and facilitate its use for users. On its GitHub page you can find additional resources such as blogs , projects, resources, research papers, courses or books about H20 .
In this article we have offered a sample of some of the most popular libraries that offer versatile functionality to tackle typical data science and machine learning tasks, although there are many others . This type of library is constantly evolving thanks to the possibility it offers its users to participate in its improvement through actions such as contributing to code writing, generating new documentation or reporting errors. All this allows you to continuously enrich and refine your results.
If you know of any other bookstore of interest that you want to recommend, you can leave us a message in comments or send us an email to dinamizacion@datos.gob.es
Content prepared by the datos.gob.es team.
Blog
Last December, the Congress of Deputies approved Royal Decree-Law 24/2021, which included the transposition of Directive (EU) 2019/1024 on open data and the reuse of public sector information. This Royal Decree amends Law 37/2007 on the reuse of public sector information, including new requirements for public bodies, including facilitating access to high-value data.
High-value data are data whose reuse is associated with considerable benefits to society, the environment and the economy. Initially, the European Commission highlighted as high-value data those belonging to the categories of geospatial, environmental, meteorological, statistical, societal and mobility data, although these classes can be extended both by the Commission and by the Ministry of Economic Affairs and Digital Transformation through the Data Office. According to the Directive, this type of data "shall be made available for reuse in a machine-readable format, through appropriate application programming interfaces and, where appropriate, in the form of bulk download". In other words, among other things, an API is required.
What is an API?
An application programming interface or API is a set of definitions and protocols that enable the exchange of information between systems. It should be noted that there are different types of APIs based on their architecture, communication protocols and operating systems.
APIs offer a number of advantages for developers, since they automate data and metadata consumption, facilitate mass downloading and optimize information retrieval by supporting filtering, sorting and paging functionalities. All of this results in both economic and time savings.
In this sense, many open data portals in our country already have their own APIs to facilitate access to data and metadata. In the following infographic you can see some examples at national, regional and local level, including information about the API of datos.gob.es. The infographic also includes brief information on what an API is and what is needed to use it.

Click here to see the infographic in full size and in its accessible version
These examples show the effort that public agencies in our country are making to facilitate access to the information they keep in a more efficient and automated way, in order to promote the reuse of their open data.
In datos.gob.es we have a Practical Guide for the publication of open data using APIs where a series of guidelines and good practices are detailed to define and implement this mechanism in an open data portal.
Content prepared by the datos.gob.es team.
Blog
A couple of weeks ago, we commented in this article the importance of data analysis tools to generate representations that allow a better understanding of the information and make better decisions. In this article we divide these tools into 2 categories: generic data visualization tools - such as Kibana, Tableau Public, SpagoBI (now Knowage) and Grafana - and visualization libraries and APIs. We are going to dedicate this new post to the latter.
Libraries and visualization APIs are more versatile than generic visualization tools, but in order to work with them it is necessary for the user to know the programming language where the library is implemented.
There is a wide range of libraries and APIs for different programming languages or platforms, which implement functionalities related to data visualization. Next, we will show you a selection taking as a fundamental criterion the popularity that the User Community grants them.
Google Chart Tools
Functionality:
Google Chart Tools is Google's API for creating interactive visualizations. It allows the creation of dashboards using different types of widgets, such as category selectors, time ranges or autocompleters, among others.
Main advantages:
It is a very easy-to-use and intuitive tool that allows interaction with data in real time. Furthermore, the generated visualizations can be integrated into web portals using HTML5 / SVG technology.
Do you want to know more?
- Support materials: On Youtube we find various tutorials made by API users.
- Repository: On Github we can access a common library for graphics packages, as well as know the supported chart types and examples of how to customize the components of each graphic, among others.
- User community: Users of Google Chart Tools can raise their questions in the Google community, in the space enabled for it.
JavaScript InfoVis Toolkit
Functionality:
JavaScript InfoVis Toolkit is the JavaScript library that provides functions for creating multiple interactive visualizations such as maps, hierarchical trees or line graphs.
Main advantages:
It is efficient in handling complex data structures and has a wide variety of display options, so it adapts to any developer need.
Do you want to know more?
- Support materials: East user manual explains the main display options and how to work with the library. Also available demos for creating different types of graphics.
- Repository: Users must download the project from http://thejit.org, although they also have available a repository on Github where, among other things, they can download extras.
- User community: Both in the Google user community like in Stackoverflow We found spaces dedicated to JavaScript InfoVis Tookit for users to share doubts and experiences.
Data-Driven Documents (D3.js)
Functionality:
Data-Driven Documents (D3.js) is the Javascript library that allows the creation of interactive graphics and complex visualizations. Thanks to it, data-based documents can be manipulated using open web standards (HTML, SVG and CSS), so that browsers can interpret them to create visualizations independently of proprietary software.
Main advantages:
This library allows the manipulation of a DOM (Object Model for Document Representation) by applying the necessary transformations to the structure based on the data linked to an HTML or XML document. This provides virtually unlimited versatility.
Do you want to know more?
- Support materials: On Github You can find numerous tutorials, although mainly dedicated to the old versions (they are currently in the process of updating this section of the wiki and writing new tutorials on version 4.0 of D3).
- Repository: Also on Github we find up to 53 repositories, which cover different materials to manage thousands of simultaneous animations, group two-dimensional points in hexagonal trays or work with the d3-color module, among others. In this Gallery you can see some of the work done.
- User community:There are spaces for discussion about D3 in the Community of Google,Stackoverflow, Gitter Y Slack.
- Social media: On the Twitter account @ d3js_org experiences, news and use cases are shared. There is also a group in LinkedIn.
Matplotlib
Functionality:
Matplotlib is one of the most popular libraries in Python for creating high-quality graphics and visualizations. It is characterized by presenting a hierarchical organization that goes from the most general level, such as the outline of a 2D matrix, to a very specific level, such as coloring a certain pixel.
Main advantages:
Matplotlib supports text and labels in LaTeX format. In addition, users can customize its functionality through packages designed by third parties (Cartopy, Ridge Map, holoviews, among others).
Do you want to know more?
- Support materials: On its own website we find a user's GuideIt includes information on the installation and use of the various functionalities. Also available tutorials for both beginners, intermediate or advanced users.
- Repository: In this repository Github are the materials you need for installation. On the web you can see a Gallery with examples of works for your inspiration.
- User community: The official website has a community section, although you can also find user groups to help you with your questions in Stackoverflow and Gitter.
- Social media: On Twitter profile @matplotlib Examples of user work and visualizations are also shared, as well as information on the latest news in the tool.
Bokeh
Functionality:
Bokeh is the Python library oriented to the creation of interactive graphs based on HTML / JS. It has the ability to generate interactive visualizations with features such as floating text, zoom, filters or selections, among others.
Main advantages:
Its main advantage is simplicity in implementation: complex interactive visualizations can be created with just a few lines of code. In addition, it allows embedding JavaScript code to implement specific functionalities.
Do you want to know more?
- Support materials: This User's guide provides detailed descriptions and examples that describe many common tasks that can be performed with Bokeh. On the Bokeh website we also find this tutorial and application examples built with this tool.
- Repository: In this repository Github There are the materials and instructions for its installation, as well as examples of use. Examples are also available in this Gallery.
- User community: The official community can be found on the website of Bokeh, although the users of this tool also meet in Stackoverflow.
- Social media:To keep up to date with news, you can follow the Twitter account @bokeh or your profile in LinkedIn.
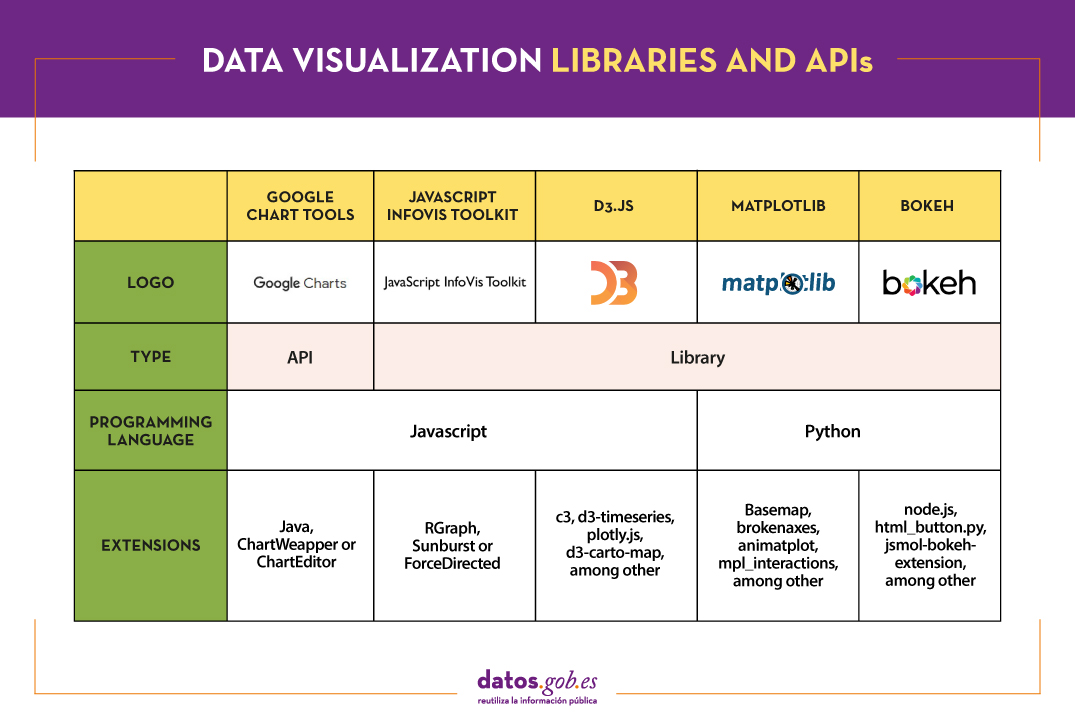
The following table shows a summary of the tools mentioned above:
Are you agree with our selection? We invite you to share your experience with these or other tools in the comments section.
If you are looking for tools to help you in data processing, from datos.gob.es we put at your disposal the report "Data processing and visualization tools”, Recently updated, as well as the following monographic articles:
- The most popular data conversion and data cleaning tools
- The most popular data analysis tools
- The most popular data visualisation tools
- The most popular geospatial visualisation tools
- The most popular network analysis tools
Content elaborated by datos.gob.es team.