Documentación
The pandemic that originated last year has brought about a significant change in the way we see the world and how we relate to it. As far as the education sector is concerned, students and teachers at all levels have been forced to change the face-to-face teaching and learning methodology for a telematic system.
In this context, within the framework of the Aporta Initiative, the study "Data-based educational technology to improve learning in the classroom and at home", by José Luis Marín, has been developed. This report offers several keys to reflect on the new challenges posed by this situation, which can be turned into opportunities if we manage to introduce changes that promote the improvement of the teaching-learning process beyond simply replacing face-to-face classes with online training.
The importance of data to improve the education sector
Through innovative educational technology based on data and artificial intelligence, some of the challenges facing the education system can be addressed. For this report, 4 of these challenges have been selected:
· Non-presential supervision of assessment tests: monitoring and surveillance of evaluative tests through telematic resources.
· Identification of behavioral or attention problems: alerting teachers to activities and behaviors that indicate attention, motivation or behavioral problems.
· Personalized and more attractive training programs: adaptation of learning routes and pace of students' learning.
· Improved performance on standardized tests: use of online learning platforms to improve results on standardized tests, to reinforce mastery of a particular subject, and to achieve fairer and more equitable assessment.
To address each of these four challenges, a simple structure divided into three sections is proposed:
1. Description of the problem, which allows us to put the challenge in context.
2. Analysis of some of the approaches based on the use of data and artificial intelligence that are used to offer a technological solution to the challenge in question.
3. Examples of relevant or highly innovative solutions or experiences.
The report also highlights the enormous complexity involved in this type of issues, so they should be approached with caution to avoid negative consequences on individuals, such as cybersecurity issues, invasion of privacy or risk of exclusion of some groups, among others. To this end, the document ends with a series of conclusions that converge in the idea that the best way to generate better results for all students, alleviating inequalities, is to combine excellent teachers and excellent technology that enhances their capabilities. In this process, open data can play an even more relevant role in improving the state of the art in educational technology and ensuring more widespread access to certain innovations that are largely based on machine learning or artificial intelligence technologies.
In this video, the author tells us more about the report:
Documentación
The saying "a picture is worth a thousand words" is a clear example of popular wisdom based on science. 90% of the information we process is visual, thanks to a million nerve fibers that link the eye to the brain and more than 20,000 million neurons that perform the processing of the impulses received at high speed. That is why we are able to remember 80% of the images we see, while in the case of text and sound the percentages are reduced to 20% and 10%, respectively.
These data explain the importance of data visualization in any sector of activity. It is not the same to tell how an indicator evolves, as to see it through visual elements, such as graphs or maps. Data visualization helps us understand complex concepts and is an accessible way to detect and understand trends and patterns in the data.
Data Visualization and Smart Cities
In the case of Smart Cities, where so much information is generated and captured, data visualization is fundamental. Throughout the length and breadth of a smart city, there are a large number of sensors and smart devices, with different detection capabilities, which generate a large amount of raw data. To give an example, only the city of Barcelona has more than 18,000 sensors spread throughout the city that capture millions of data. This data allows from real time monitoring of the environment to informed decision making or accountability. Visualizing this data through visual dashboards speeds up all these processes.
To help Smart Cities in this task, from the Open Cities project, led by Red.es and four city councils (A Coruña, Madrid, Santiago de Compostela and Zaragoza), a series of visualization tools have been selected and an extension has been developed for CKAN similar to the functionality "Open With Apps", initially designed for the Data.gov portal, which facilitates the integration with this type of tools.
The integration method inspired by "Open with Apps"
The idea behind "Open With Apps" is to allow integration with some third party services, for some formats published in the open data portals, such as CSV or XLS, without the need to download and upload data manually, through the APIs or URIs of the external service.
But not all display systems allow this functionality. Therefore, since the Open Cities project they have analyzed several platforms and online tools for creating visualizations and data analysis, and have selected 3 that meet the necessary characteristics for the described operation:
- The integration is done through links to websites without the need to download any software.
- In the invocation it is only necessary to pass as a parameter the download URL of the data file.
The result of this analysis has given rise to the report "Analysis and definition of specifications for integration with external visualization systems", where 3 tools that comply with these functionalities are highlighted.
3 simple data visualization and analysis tools
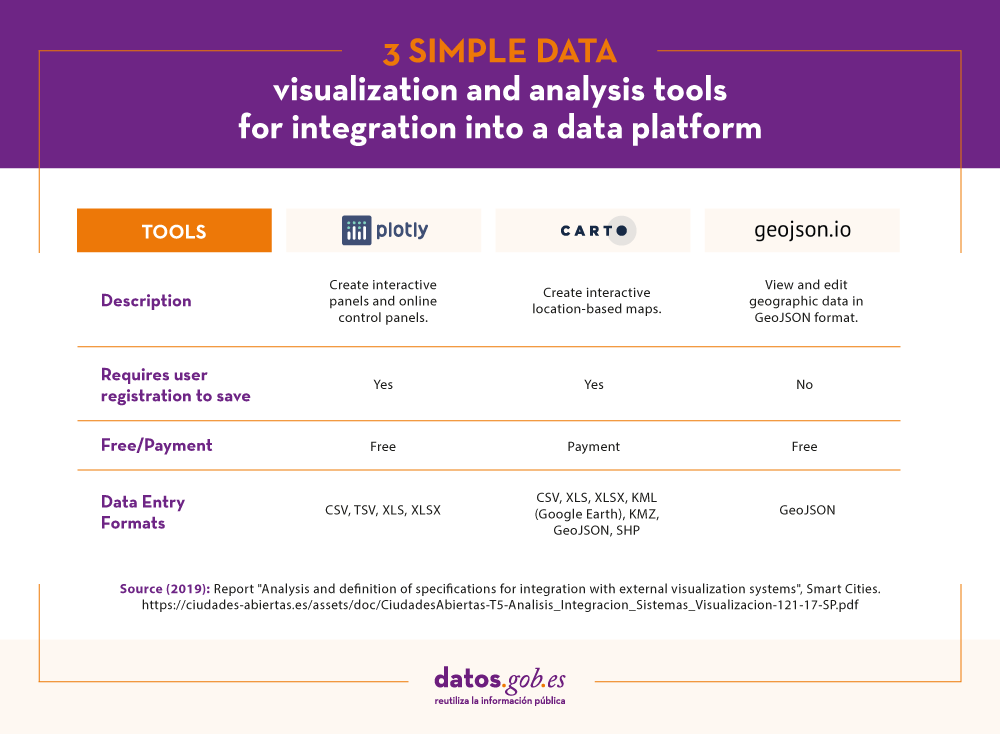
According to the aforementioned report, the 3 platforms that meet the necessary characteristics to achieve such operation are:
- Plotly: facilitates the creation of interactive data visualizations and control panels to share online with the audience. More advanced users can process data with any custom function, as well as create simulations with Python scripts. Supported formats are CSV, TSV, XLS and XLSX.
- Carto: formerly known as CartoDB, it generates interactive maps from geospatial data. The maps are automatically created and the user can filter and refine the data for more information. It accepts files in CSV, XLS, XLSX, KML (Google Earth), KMZ, GeoJSON and SHP formats.
- Geojson.io: allows to visualize and edit geographic data in GeoJSON format, as well as to export to a large number of formats.
For each of these tools the report includes a description of its requirements and limitations, its mode of use, a generic call and specific examples of calls along with the result obtained.
The "Open with" extension
As mentioned above, within the project a CKAN extension called "Open with" has also been developed. This extension allows to visualize the data files using the external visualization systems described above. It can be accessed through the project's GitHub account.
The report explains how to carry out its installation in a simple way, although if any doubt arises about its operation, users can contact Open Cities through the e-mail contacto@ciudadesabiertas.es.
Those interested in other CKAN extensions related to data visualization have at their disposal the report Analysis of the Visualization Extensions for CKAN, carried out within the framework of the same initiative. In the Gighub account, it is expected that examples of visualizations made will be published.
In short, data visualization is a fundamental leg of Smart Cities, and thanks to the work of the Open Cities team it will now be easier for any initiative to integrate simple data visualization solutions into their information management platforms.
Documentación
A large number of different data sources with different contents and formats coexist in an open data portal. It is therefore necessary to provide each file, resource or content on the network with a context or definition that allows people, and also machines, to interpret its meaning. This is where the concept of Linked data comes in.
Linked Data allows the web to be used as a single large global database. Following this publishing paradigm, data is available in context and interconnected for reuse. Linked Data emerged from the Semantic Web project inspired by Tim Berners-Lee, the father of the Web, from the need to introduce contextual information in the form of metadata on the Web.
The document "LinkedData as an open data model" briefly explains the basic concepts to understand how the semantic web and linked data works, such as the case of URIs or unique resource identifiers, ontologies or vocabularies that allow the description of relationships between them, to focus on how Aragon has implemented these technologies to develop different services, such as:
- The Interoperable Information Structure (EI2A), an ontology that homogenises structures, vocabularies and characteristics to respond to the diversity and heterogeneity of existing data within the Administration, within the framework of Aragon Open Data. The document explains some of the ontologies and vocabularies used for the development.
- The European Legislation Identifier (ELI), which allows online access to legislation in a formalised format that facilitates its reuse.
- The semantic infrastructure in Aragon Open Data, where the use of the Virtuoso tool for the storage of linked data stands out. The document explains the characteristics of this universal server, whose architecture allows the persistence of data in RDF-XML formats, among others. In addition, it explains how the bank that stores triplets in a native way for resources relationships works and shows examples of services of Aragon Open data that exploit these triplets of data as Aragopedia and Aragon Open Data Pool.
You can then download the full document (only available in Spanish).
This document is part of the series of educational materials and technological articles that Aragón open Data is producing in order to explain how they have deployed different solutions to respond to the needs for location, access and reuse of the different sets of data. You can complete your reading with another volume in the series: "How to implement CKAN: real case of the Aragon Open Data portal".
Documentación
Aragon Open Data is one of the most active open data initiatives on the Spanish scene. In addition to the implementation, management and maintenance of an interoperable data catalogue, since its inception Aragon Open Data has carried out actions to bring the culture of open data closer to citizens, companies and all types of organisations. These initiatives include the development of services to offer the data and facilitate its reuse in a simple way such as Aragopedia, Open Social Data or the recent Aragón Open Data Focus (more information available in this interview).
Given the knowledge that they hold, it is not surprising that they have begun to develop educational materials and technological articles with the aim of explaining how they have deployed different solutions to respond to the needs of localisation, access and reuse of the different sets of data.
Below is one such material, which focuses on explaining how they have implemented the CKAN software solution to improve the availability of data on the portal.
CKAN as an open data management software solution in a real case for the Aragon Open Data portal
CKAN is a free, open-source platform developed by the Open Knowledge Foundation for publishing and cataloguing data collections. Due to its free and open nature, as well as its rapid implementation, it has become a worldwide reference for the opening of data.
Since its birth in 2012, Aragon Open Data has bet on CKAN technology for the management of its open data system. The document "CKAN, cornerstone for the management of an open data system" shows us how its architecture works and serves as an example for other initiatives that want to implement a platform of this type.
The document describes the challenges they encountered when migrating the original platform to a higher version and how they solved it by building a client application. This process resulted in the current architecture of the portal, which is shown in the figure below:
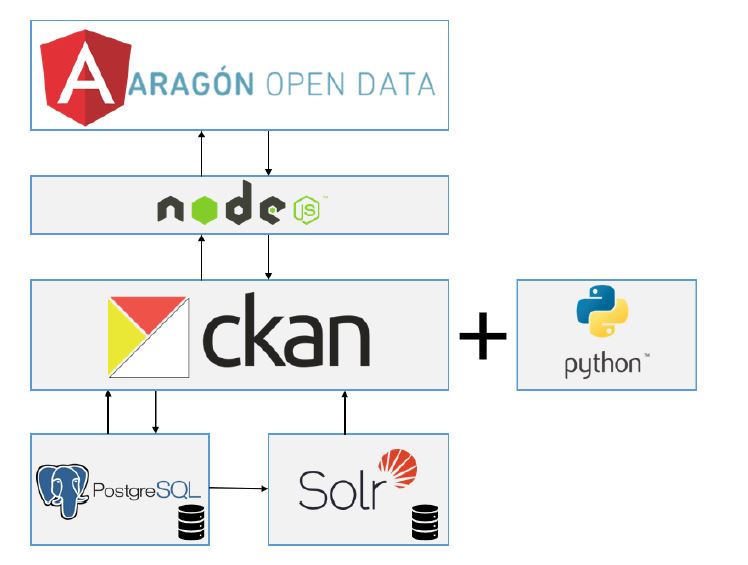
The CKAN backend is developed entirely in Python, with its own Javascript front end, and allows the deployment of a layer of services that can be managed from an API, and the use of base plugins or extensions that provide additional functionalities to the platform. CKAN is supported by a PostgreSQL database, where the datasets it houses, its resources and other metadata required for the operation of the platform are stored, and makes use of Solr, a search engine that helps to speed up the location and availability of the datasets.
In addition to explaining this architecture, the document discusses the functionalities and extensions used in the customised CKAN instance, and how the set of components integrated into the platform: Angular, NodeJS, PostgreSQL and Solr coexist to provide data sets that are the basis for the development of open data services and solutions such as Presupuestos de Aragón or the already mentioned Aragón Open Data Focus.
CKAN incorporates an extension that supports RFD data serialisation which, in addition to allowing the exposure of linked data in formats such as RDF-XML or Turtle, is used to federate datasets that follow the DCAT specification of metadata, making CKAN a more versatile and appropriate platform for the publication of Linked Data, something that Aragon Open Data has also done as we can see in this other document.
You can download the document "CKAN as an open data management software solution in a real case for the Aragon Open Data portal" below (only available in Spanish). You can also complement your reading with these two additional articles:
- Automatic collection of open data: Explains how Aragon Open Data federates open data using a CKAN plugin.
- ELK architecture as an open data tool: Explains how Aragon Open Data uses an architecture based on the ELK technology stack (Elasticsearch, Logstash and Kibana).
Documentación
In Spain, there are numerous open data initiatives promoted by different levels of the administration: city councils, autonomous communities and state bodies. This ecosystem, as rich as it is diverse, generates a large volume of valuable information, but it also poses an obvious challenge: how to make it easier for any person or entity to easily locate the data they need, without having to go through dozens of different catalogs?
To respond to this need, the National Open Data Catalogue, hosted in datos.gob.es, acts as a single point of access to the set of data made available to citizens by the Spanish public sector. Its harmonizing function allows information from multiple initiatives to be centralized, offering reusers a common space to search for data more efficiently. In addition, thanks to its federation with the European Data Portal (data.europa.eu), the datasets published by Spanish administrations gain visibility at the international level.
Steps to follow
Publishing open data in the National Catalogue is a simpler process than it seems if you know the key phases.
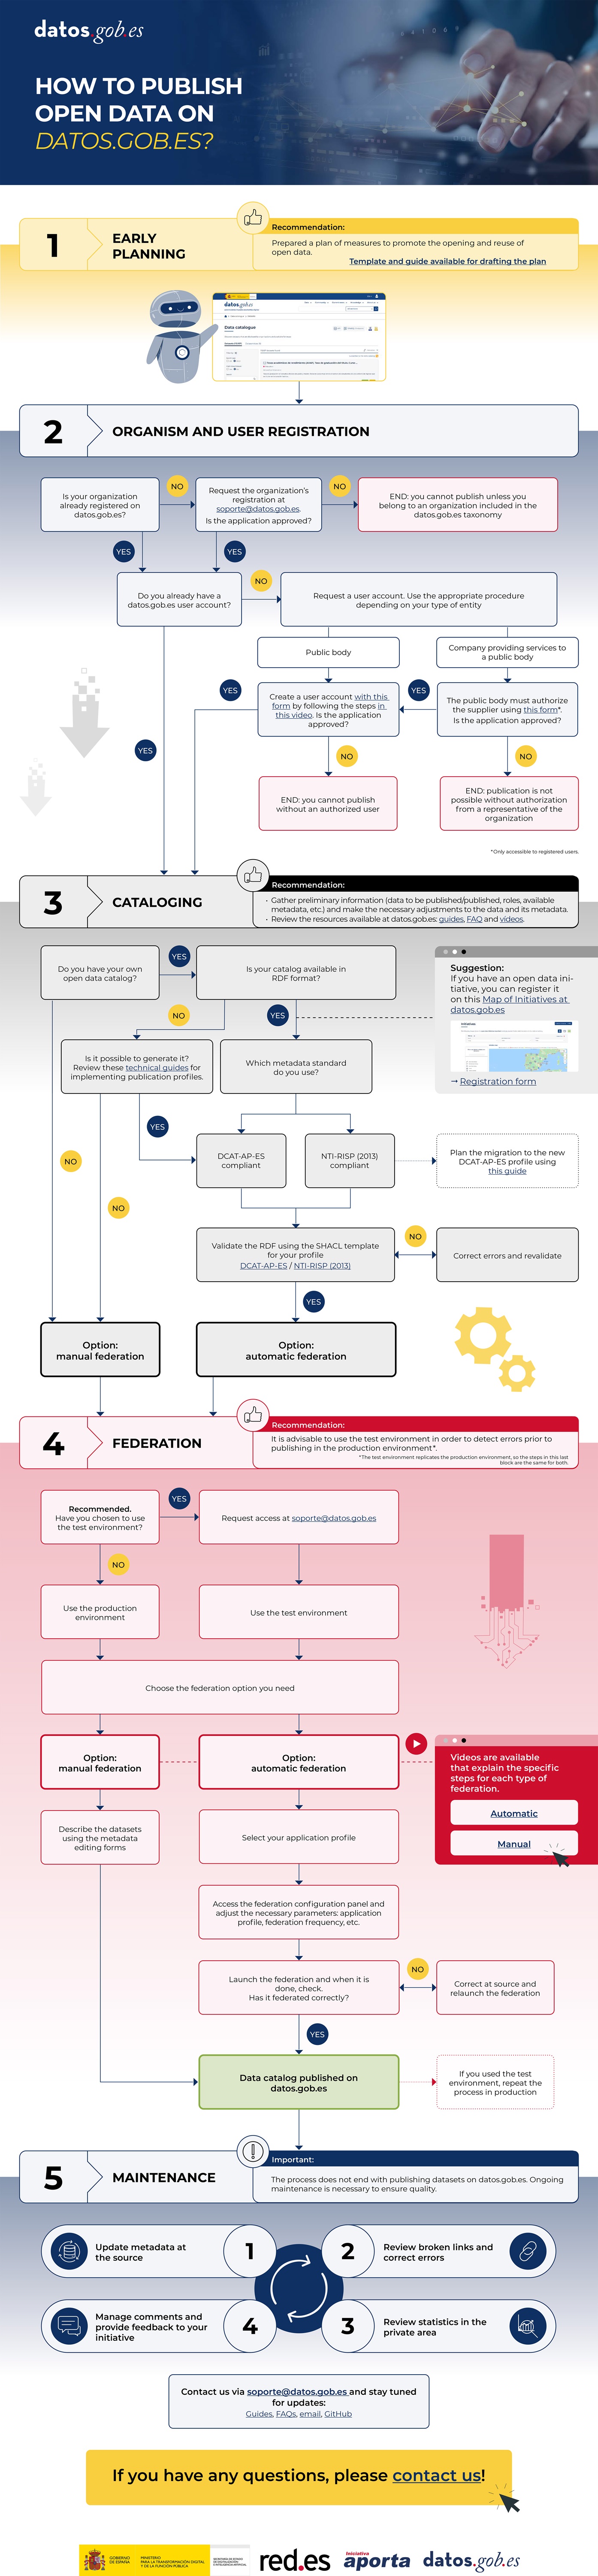
1. Pre-planning
Before you start, it's a good idea to prepare the ground. To this end, it is recommended to carry out a plan of measures to promote the opening and reuse of open data, in which the agency defines, among other issues, what data it is going to open, for what purpose and under what criteria of quality, updating and format. Good planning allows you to anticipate technical needs, coordinate the teams involved and ensure that the published data will be really useful for reusers.
In datos.gob.es you can find multiple resources to help in this task, such as this template, or various guides, such as the Guide for the deployment of data portals. Good practices and recommendations.
2. Registration of the organism and the user
The second phase focuses on managing the registration of the body and the users who will be in charge of the publication. User accounts are reserved only for open data publishers or organizations (they are not required to access or download catalog datasets).
In order to federate data in the national catalog, the agency must be registered in the official taxonomy and validated by the datos.gob.es team. In turn, responsible users need to have an authorised account, either as staff of the organisation itself or as accredited external providers (previously authorised). Without this administrative step, it is not possible to access the tools needed to catalog and publish data. This video explains how to apply for a user account:
3. Cataloguing
In this phase, the agency prepares the metadata of its datasets following the established application profiles, preferably DCAT-AP-ES. At this point, it is determined if it has its own catalog capable of generating metadata in RDF or if it will be necessary to resort to other alternatives. Validation using SHACL templates is critical to ensure that metadata meets technical and semantic requirements, avoiding errors that can impede federation.
4. Federation
Federation is the process by which the agency's metadata is incorporated into the national catalog. This federation can be carried out in two ways:
- Manual: involves registering each dataset individually, completing a form for each dataset detailing its metadata.
- Automatic: the registration and update is done periodically from an RDF file where the metadata available through a url on the publisher's website is included. It is no longer necessary to work individually with each dataset, but the process can automatically span multiple datasets.
In both modes, before federating to production, we recommend that you use the sandbox to verify that the datasets are integrated correctly and that the metadata is displayed as expected.
5. Maintenance
In order for published data to remain useful, up-to-date, and accessible, ongoing maintenance is necessary. This involves reviewing and updating metadata and resources when necessary or fixing broken links, among others. These activities are essential to ensure the quality of the catalogue and to ensure that open data continues to generate value over time.
Infographic summary of the flow to follow
To facilitate the understanding of the steps to follow, we make available to users the following infographic-summary. However, the datos.gob.es support team will be happy to answer any questions or comments.
Documentación
Natural language processing is making machines (computers) understand human language: spoken or in the form of text. More formally, natural language processing is a hybrid field between computer science and linguistics, which uses different techniques, some of them based on artificial intelligence, to interpret human language.
In this report, prepared by the digital transformation expert Alejandro Alija, we will see how natural language processing is much closer to our day-to-day life than we may initially think. Applications such as automatic translation of texts; sentiment analysis in social networks; the searches we carry out on the internet; the generation of meteorological summaries or the simple requests that we make to our smart speaker, have a strong technological component of natural language processing.
The specific weight that natural language processing has (and will have) in industry and the economy is increasing, since most of the data that is produced in the world (mainly through the Internet) is data in the form of texts and voice (unstructured data). Open data plays a crucial role for this technology. The artificial intelligence algorithms that are used to analyze and understand natural language require a huge amount of quality data to be trained. Many of these data come from the open data repositories of both public and private institutions.
Throughout this report, the history of natural language processing is reviewed, from its inception to the present day. Additionally, the Inspire section describes some of the most representative use cases that harness the potential of natural language processing. The prediction of text when writing a new email, the classification of texts in categories or the generation of false news, are just some of the cases that are reviewed in this report.
Finally, for those more enthusiastic readers, in the Action section, a complete use case (using programming tools) is developed on sentiment analysis in conversations about citizen public debates.
The report ends with a list of resources and readings for those users who wish to continue expanding their knowledge of Artificial Intelligence.
You can download the full report and other additional materials at the following links:
Note: The published code is intended to be a guide for the reader, but may require external dependencies or specific configurations for each user who wants to run it.
Documentación
We release a new series of reports in datos.gob.es, which under the methodology “Awareness, Inspire, Action” tries to explain how different emerging technologies work and their relationship with open data. The objective is to introduce the reader to the subject through the use of practical, simple and recognizable use cases.
The first report of the series is dedicated to Artificial Intelligence. We can define Artificial Intelligence (AI) as the ability of a machine to mimic human intelligence. This technology will have a great impact on our lives, in two ways: the automation of daily, routine and dangerous tasks and the increase of human capacities, helping to strengthen the work force of the future.
The report has been prepared by Alejandro Alija, expert in Digital Transformation and Innovation, and addresses the following contents:
- The report begins with the Awareness section where the concept of AI is explained in a simple way, briefly outlining two of its sub-fields: Machine Learning and Deep Learning. This section also includes a brief historical review, where the evolution of AI is reviewed, and the factors that make it possible are compiled and explained.
- Next, in the Inspire section, we deep on the AI use cases. For this, the author has taken as reference his two areas of impact: AI as an amplifier of human language, with tasks such as reports translation or conversion of written to spoken language (and vice versa), and AI as an extension of human vision, illustrated through examples of the use of image recognition and classification.
- Finally, in the Action section one of the use case mentioned in the Inspire section is developed: the recognition and classification of images. For them, a set of images has been selected available in the data catalogue of data.gob.es (the photographic archive of the Basque Government: images about Euskadi and the Government activity). Using AI tools, the images have been classified and their description noted. This example can be replicated by the reader since the code necessary for its development has been made available.
The report ends with a list of resources and readings for those users who wish to continue expanding their knowledge about Artificial Intelligence.
You can also download the full report and other additional materials in the following links:
Note: The published code is intended to be a guide for the reader, but may require external dependencies or specific configurations for each user who wants to run it.
Documentación
Open data is one of the key elements of smart cities. The collection of information, its analysis and its use make possible to address many of the challenges facing cities today, such as the creation of public services that respond to a growing population.
Among all the open datasets that are published related to cities, real-time data provides multiple advantages. Knowing the situation of our cities in real time can serve to make decisions and improve efficiency in urban mobility, energy management or environmental conditions, among other aspects.
In this context, the report "Open data in real time: use cases for smart cities" seeks to boost the opening of this type of data showing the advantages of its use. The report analyses the relationship between open data and smart cities, and shows a series of datasets that local entities should publish in real time, according to the report “Open Data 2019 - 40 datasets to be published by Local Entities”, elaborated by the FEMP (Spanish Federation of Municipalities and Provinces). These data sets belong to the fields of transport and mobility - public car park, public bicycles, traffic, public transport - and the environment - air quality and noise pollution.
Each dataset has been analysed highlighting some use cases and reuse examples, paying special attention to the positive impact they have on citizens. The technologies involved in its deployment, the stakeholders or future challenges, among other factors, have also been addressed.
The conclusions of the analysis are collected in each of the files that you can see below:
Datasets
You can also download the full report and other additional materials using the following links:
Evento
On September 25, the Secretary of State for Digital Advance organizes the Infoday about language technologies. The event is part of the XXXV International Conference of the SEPLN (Spanish Society for Natural Language Processing) and the dissemination activities of the Plan for the Advancement of Language Technologies, whose objective is to promote the development of natural language processing and automatic translation in Spanish and co-official languages.
With this event, the organizers want to show and highlight the importance of natural language processing campaigns in all areas, but especially the field of health and biomedicine, as well as raise awareness of the different elements necessary for language technology projects come to fruition, such as open data.
The event will take place in the morning from 9:00 a.m. to 2:00 p.m. at the headquarters of the University of the Basque Country, in Bilbao (Avenida Abandoibarra, 3), and it is divided into two parts:
- Part I: Developments in the Plan for the Advacement Language Technologies (TL Plan). In the first part of the event, the main initiatives that are being carried out within the TL Plan will be addressed. The focus will be on some highlights, such as linguistic infrastructures and European machine translation projects. In addition, the results of some of the latest studies will be shown. One of these studies is “Reusable data as linguistic resources”, whose presentation will be defended by Leonardo Campillos, of the Autonomous University of Madrid (UAM), and which has been carried out with funding from the Secretary of State for Digital Advancement and Red.es within of the scope of the TL Plan.
- Part II: Health assessment campaigns. In the second part, the situation of the different campaigns carried out in the field of health and biomedicine will be analysed, paying special attention to anonymization tasks. For this, two round tables will be held, under the title of “Evaluation campaigns, experiences, needs, impact and vision of participants” and “Protection of health data, legal aspects, knowledge transfer, clinical PLN solutions and opportunities for the TL academy and industry”.
Through this agenda, the organizers seek to generate a space to sharing experiences, which allow us to avoid duplication and take advantage of synergies between the different actors involved in the universe of language technologies: public entities, private companies, academic sector, researchers, etc.
The attendance to the event is free, but it is necessary to register previously through this link.
Documentación
The European Open Data Portal (data.europa.eu) academy makes an online training programme available to citizens for those interested in developing their skills in open data. These free access materials allow you to become familiar with the ecosystem from different angles: basic concepts, legal frameworks, emerging trends, success stories or good practices of publication and reuse. These free access materials allow you to become familiar with the open data ecosystem from different angles: basic concepts, legal frameworks, emerging trends, success stories or good practices of publication and reuse.
Who are they for?
The data.europa academy courses are aimed at professionals and organisations working with public data in Europe – especially administrations, academic institutions and entities that publish, manage or reuse open data – but also anyone interested in understanding how data can drive transparency, innovation and decision-making.
In addition, they are designed for different levels of experience, from those who are new to the basics to specialists who seek to delve into legal, technical or quality aspects, which allows very diverse profiles to find a training path adapted to their needs.
How are the courses organized?
The training materials are organized by theme:
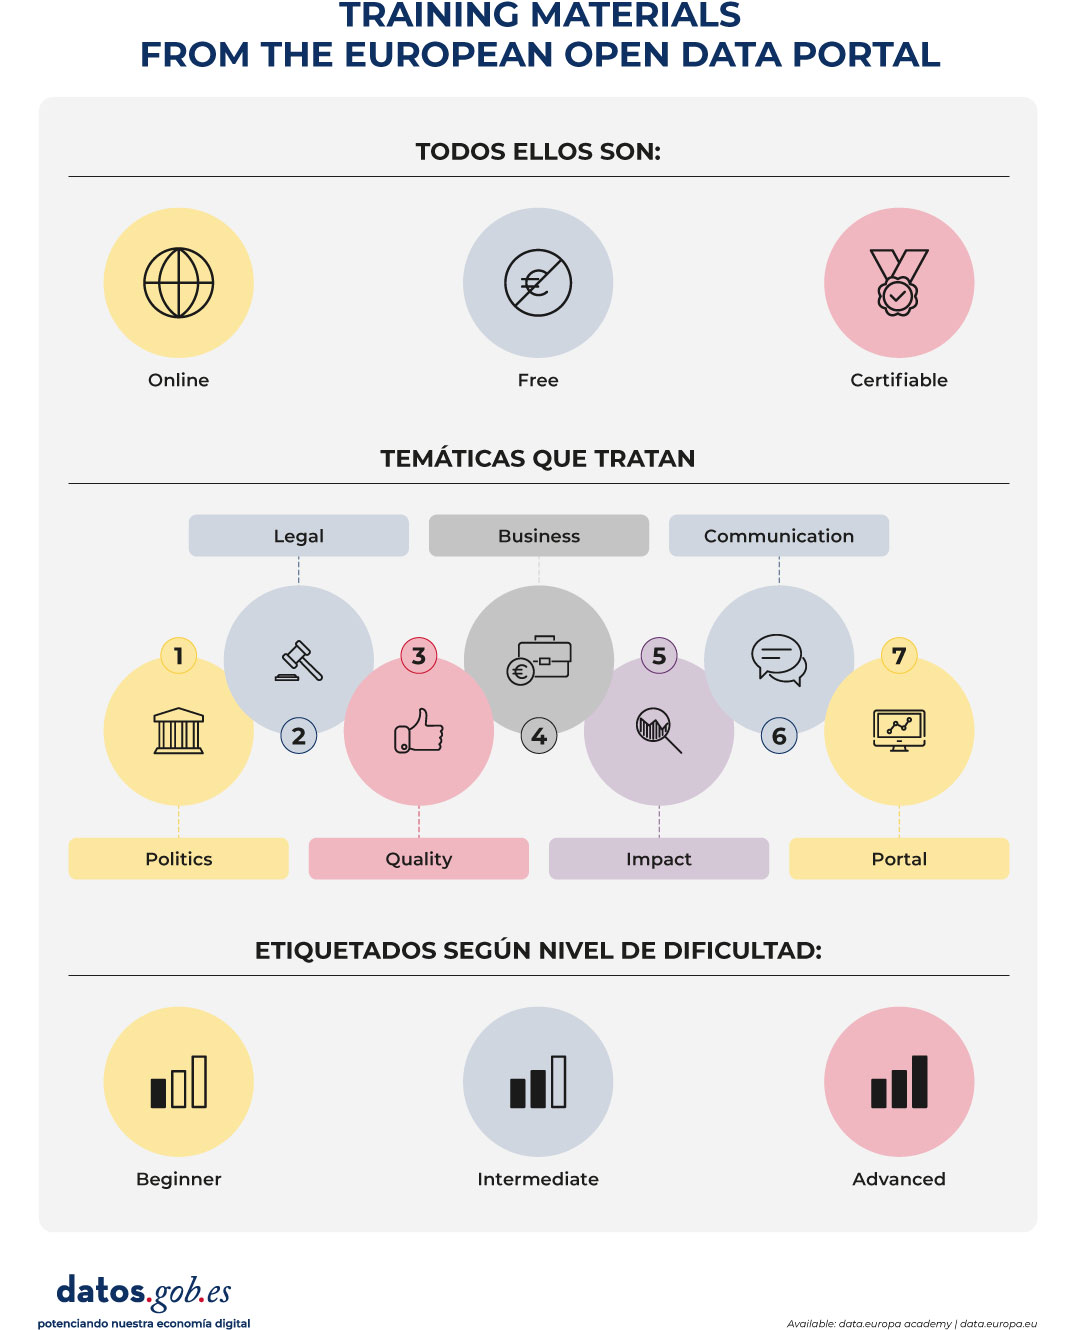
Figure 1. Training materials from the European open data portal. Source: data.europa.eu.
For each subject, various materials are available: readings, videos, tools, webinars, quizzes, etc. that seek to help understand, use, and share open data effectively.
As mentioned previously, courses are divided by experience level (beginner, intermediate, or advanced). Users can also filter by the audience they are targeting (data providers, developers, journalists, etc.), as well as subject matter or format.
Users can choose to follow an entire theme or select specific content based on their interests. This flexibility allows training to be adapted to different professional needs.
In addition, from 2026 a series of learning paths are available designed as structured training paths that group content from various subject areas in a logical and progressive order for different purposes.
Digital Certificates & Badges
One of the most valued aspects of the training itineraries is the possibility of obtaining official certificates that allow the skills acquired to be formally accredited. These certificates are available for the various itineraries. To achieve them, all you have to do is complete all the modules of the course, pass the final evaluation and download the certificate generated at the end.
Along with these recognitions, the platform also offers digital badges that are unlocked as the content progresses. These badges can be incorporated into professional profiles and serve as clear and verifiable evidence of mastery in different areas related to open data.
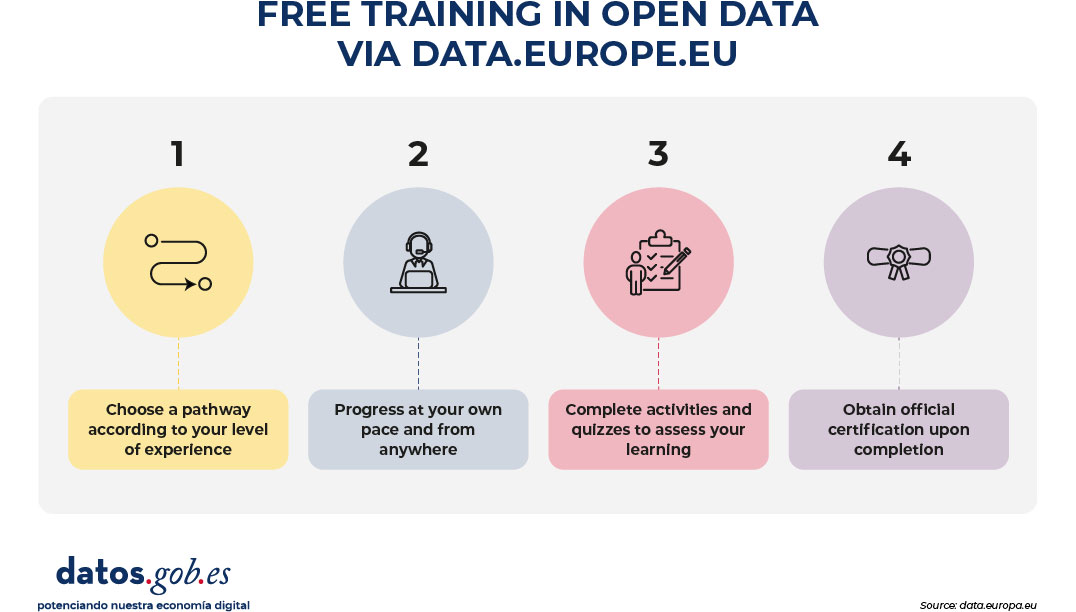
Figure 2. Free training process in open data via data.europe.eu. Source: data.europa.eu.