Blog
At the crossroads of the 21st century, cities are facing challenges of enormous magnitude. Explosive population growth, rapid urbanization and pressure on natural resources are generating unprecedented demand for innovative solutions to build and manage more efficient, sustainable and livable urban environments.
Added to these challenges is the impact of climate change on cities. As the world experiences alterations in weather patterns, cities must adapt and transform to ensure long-term sustainability and resilience.
One of the most direct manifestations of climate change in the urban environment is the increase in temperatures. The urban heat island effect, aggravated by the concentration of buildings and asphalt surfaces that absorb and retain heat, is intensified by the global increase in temperature. Not only does this affect quality of life by increasing cooling costs and energy demand, but it can also lead to serious public health problems, such as heat stroke and the aggravation of respiratory and cardiovascular diseases.
The change in precipitation patterns is another of the critical effects of climate change affecting cities. Heavy rainfall episodes and more frequent and severe storms can lead to urban flooding, especially in areas with insufficient or outdated drainage infrastructure. This situation causes significant structural damage, and also disrupts daily life, affects the local economy and increases public health risks due to the spread of waterborne diseases.
In the face of these challenges, urban planning and design must evolve. Cities are adopting sustainable urban planning strategies that include the creation of green infrastructure, such as parks and green roofs, capable of mitigating the heat island effect and improving water absorption during episodes of heavy rainfall. In addition, the integration of efficient public transport systems and the promotion of non-motorised mobility are essential to reduce carbon emissions.
The challenges described also influence building regulations and building codes. New buildings must meet higher standards of energy efficiency, resistance to extreme weather conditions and reduced environmental impact. This involves the use of sustainable materials and construction techniques that not only reduce greenhouse gas emissions, but also offer safety and durability in the face of extreme weather events.
In this context, urban digital twins have established themselves as one of the key tools to support planning, management and decision-making in cities. Its potential is wide and transversal: from the simulation of urban growth scenarios to the analysis of climate risks, the evaluation of regulatory impacts or the optimization of public services. However, beyond technological discourse and 3D visualizations, the real viability of an urban digital twin depends on a fundamental data governance issue: the availability, quality, and consistent use of standardized open data.
What do we mean by urban digital twin?
An urban digital twin is not simply a three-dimensional model of the city or an advanced visualization platform. It is a structured and dynamic digital representation of the urban environment, which integrates:
-
The geometry and semantics of the city (buildings, infrastructures, plots, public spaces).
-
Geospatial reference data (cadastre, planning, networks, environment).
-
Temporal and contextual information, which allows the evolution of the territory to be analysed and scenarios to be simulated.
-
In certain cases, updatable data streams from sensors, municipal information systems or other operational sources.
From a standards perspective, an urban digital twin can be understood as an ecosystem of interoperable data and services, where different models, scales and domains (urban planning, building, mobility, environment, energy) are connected in a coherent way. Its value lies not so much in the specific technology used as in its ability to align heterogeneous data under common, reusable and governable models.
In addition, the integration of real-time data into digital twins allows for more efficient city management in emergency situations. From natural disaster management to coordinating mass events, digital twins provide decision-makers with a real-time view of the urban situation, facilitating a rapid and coordinated response.
In order to contextualize the role of standards and facilitate the understanding of the inner workings of an urban digital twin, Figure 1 presents a conceptual diagram of the network of interfaces, data models, and processes that underpin it. The diagram illustrates how different sources of urban information – geospatial reference data, 3D city models, regulatory information and, in certain cases, dynamic flows – are integrated through standardised data structures and interoperable services.
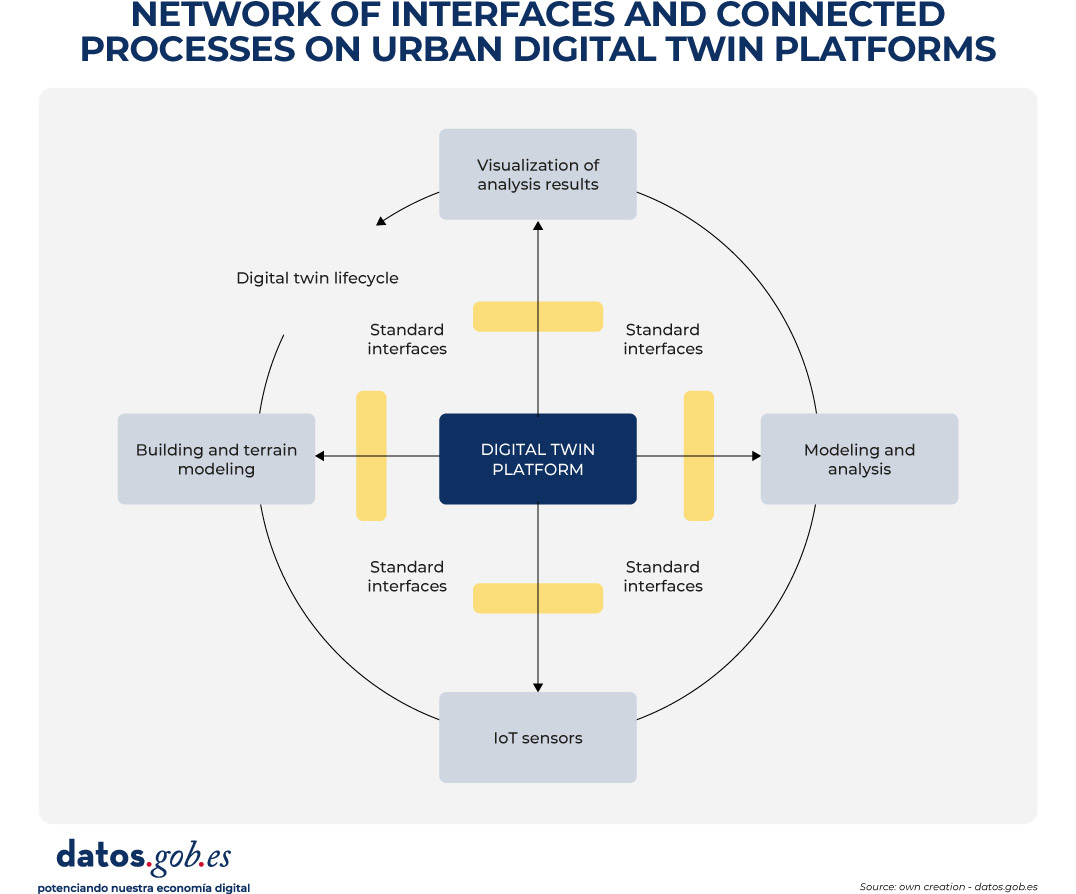
Figure 1. Conceptual diagram of the network of interfaces and connected processes in urban digital twin platforms. Source: own elaboration – datos.gob.es.
In these environments, CityGML and CityJSON act as urban information models that allow the city to be digitally described in a structured and understandable way. In practice, they function as "common languages" to represent buildings, infrastructures and public spaces, not only from the point of view of their shape (geometry), but also from the point of view of their meaning (e.g. whether an object is a residential building, a public road or a green area). As a result, these models form the basis on which urban analyses and the simulation of different scenarios are based.
In order for these three-dimensional models to be visualized in an agile way in web browsers and digital applications, especially when dealing with large volumes of information, 3D Tiles can be incorporated. This standard allows urban models to be divided into manageable fragments, facilitating their progressive loading and interactive exploration, even on devices with limited capacities.
The access, exchange and reuse of all this information is usually articulated through OGC APIs, which can be understood as standardised interfaces that allow different applications to consult and combine urban data in a consistent way. These interfaces make it possible, for example, for an urban planning platform, a climate analysis tool or a citizen viewer to access the same data without the need to duplicate or transform it in a specific way.
In this way, the diagram reflects the flow of data from the original sources to the final applications, showing how the use of open standards allows for a clear separation of data, services, and use cases. This separation is key to ensuring interoperability between systems, the scalability of digital solutions and the sustainability of the urban digital twin over time, aspects that are addressed transversally in the rest of the document.
Real example: Urban regeneration project in Barcelona
An example of the impact of urban digital twins on urban construction and management can be found in the urban regeneration project of the Plaza de las Glòries Catalanes, in Barcelona (Spain). This project aimed to transform one of the city's most iconic urban areas into a more accessible, greener and sustainable public space.
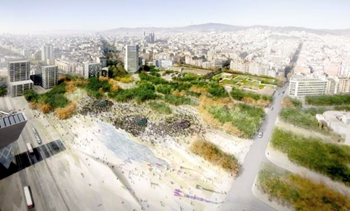
Figure 2. General view. Image by the joint venture Fuses Viader + Perea + Mansilla + Desvigne.
By using digital twins from the initial phases of the project, the design and planning teams were able to create detailed digital models that represented not only the geometry of existing buildings and infrastructure, but also the complex interactions between different urban elements, such as traffic, public transport and pedestrian areas.
These models not only facilitated the visualization and communication of the proposed design among all stakeholders, but also allowed different scenarios to be simulated and their impact on mobility, air quality, and walkability to be assessed. As a result, more informed decisions could be made, contributing decisively to the overall success of the urban regeneration initiative.
The critical role of open data in urban digital twins
In the context of urban digital twins, open data should not be understood as an optional complement or as a one-off action of transparency, but as the structural basis on which sustainable, interoperable and reusable digital urban systems are built over time. An urban digital twin can only fulfil its function as a planning, analysis and decision-support tool if the data that feeds it is available, well defined and governed according to common principles.
When a digital twin develops without a clear open data strategy, it tends to become a closed system and dependent on specific technology solutions or vendors. In these scenarios, updating information is costly and complex, reuse in new contexts is limited, and the twin quickly loses its strategic value, becoming obsolete in the face of the real evolution of the city it intends to represent. This lack of openness also hinders integration with other systems and reduces the ability to adapt to new regulatory, social or environmental needs.
One of the main contributions of urban digital twins is their ability to base public decisions on traceable and verifiable data. When supported by accessible and understandable open data, these systems allow us to understand not only the outcome of a decision, but also the data, models and assumptions that support it, integrating geospatial information, urban models, regulations and, in certain cases, dynamic data. This traceability is key to accountability, the evaluation of public policies and the generation of trust at both the institutional and citizen levels. Conversely, in the absence of open data, the analyses and simulations that support urban decisions become opaque, making it difficult to explain how and why a certain conclusion has been reached and weakening confidence in the use of advanced technologies for urban management.
Urban digital twins also require the collaboration of multiple actors – administrations, companies, universities and citizens – and the integration of data from different administrative levels and sectoral domains. Without an approach based on standardized open data, this collaboration is hampered by technical and organizational barriers: each actor tends to use different formats, models, and interfaces, which increases integration costs and slows down the creation of reuse ecosystems around the digital twin.
Another significant risk associated with the absence of open data is the increase in technological dependence and the consolidation of information silos. Digital twins built on non-standardized or restricted access data are often tied to proprietary solutions, making it difficult to evolve, migrate, or integrate with other systems. From the perspective of data governance, this situation compromises the sovereignty of urban information and limits the ability of administrations to maintain control over strategic digital assets.
Conversely, when urban data is published as standardised open data, the digital twin can evolve as a public data infrastructure, shared, reusable and extensible over time. This implies not only that the data is available for consultation or visualization, but that it follows common information models, with explicit semantics, coherent geometry and well-defined access mechanisms that facilitate its integration into different systems and applications.
This approach allows the urban digital twin to act as a common database on which multiple use cases can be built —urban planning, license management, environmental assessment, climate risk analysis, mobility, or citizen participation—without duplicating efforts or creating inconsistencies. The systematic reuse of information not only optimises resources, but also guarantees coherence between the different public policies that have an impact on the territory.
From a strategic perspective, urban digital twins based on standardised open data also make it possible to align local policies with the European principles of interoperability, reuse and data sovereignty. The use of open standards and common information models facilitates the integration of digital twins into wider initiatives, such as sectoral data spaces or digitalisation and sustainability strategies promoted at European level. In this way, cities do not develop isolated solutions, but digital infrastructures coherent with higher regulatory and strategic frameworks, reinforcing the role of the digital twin as a transversal, transparent and sustainable tool for urban management.
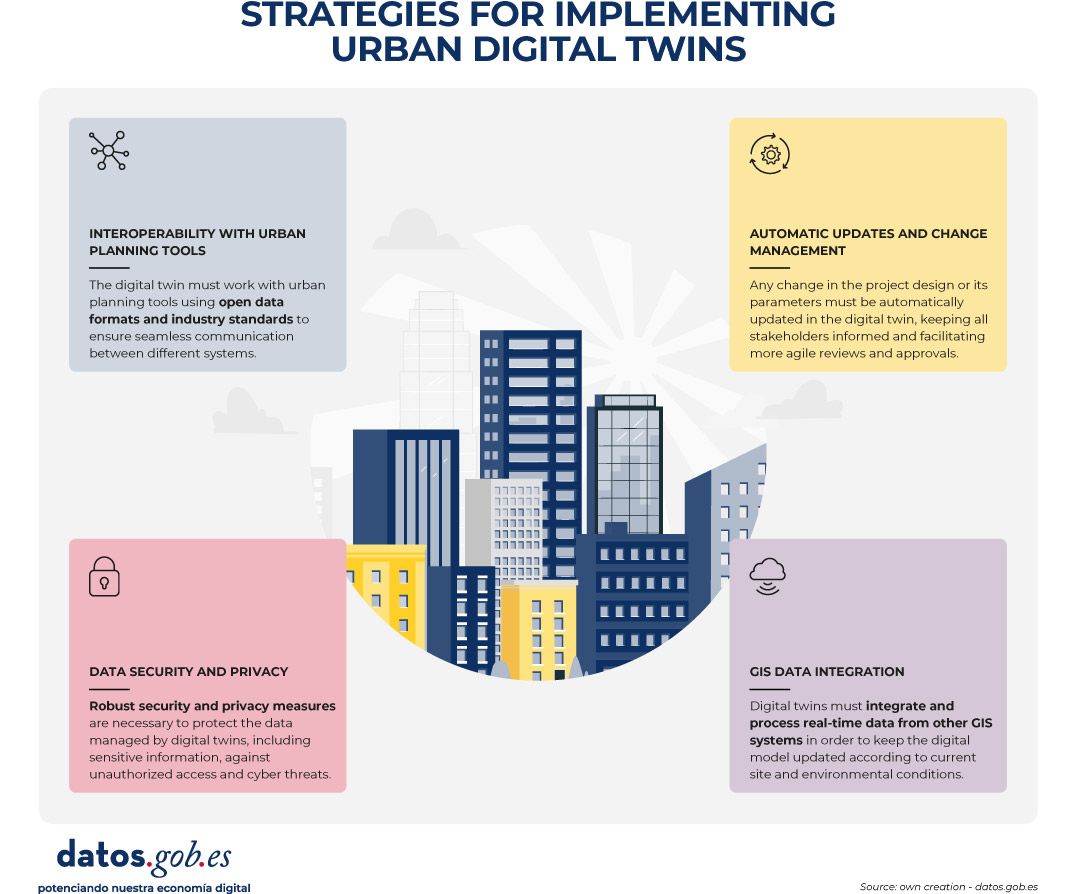
Figure 3. Strategies to implement urban digital twins. Source: own elaboration – datos.gob.es.
Conclusion
Urban digital twins represent a strategic opportunity to transform the way cities plan, manage and make decisions about their territory. However, their true value lies not in the technological sophistication of the platforms or the quality of the visualizations, but in the robustness of the data approach on which they are built.
Urban digital twins can only be consolidated as useful and sustainable tools when they are supported by standardised, well-governed open data designed from the ground up for interoperability and reuse. In the absence of these principles, digital twins risk becoming closed, difficult to maintain, poorly reusable solutions that are disconnected from the actual processes of urban governance.
The use of common information models, open standards and interoperable access mechanisms allows the digital twin to evolve as a public data infrastructure, capable of serving multiple public policies and adapting to social, environmental and regulatory changes affecting the city. This approach reinforces transparency, improves institutional coordination, and facilitates decision-making based on verifiable evidence.
In short, betting on urban digital twins based on standardised open data is not only a technical decision, but also a public policy decision in terms of data governance. It is this vision that will enable digital twins to contribute effectively to addressing major urban challenges and generating lasting public value for citizens.
Blog
Open data has great potential to transform the way we interact with our cities. As they are available to all citizens, they allow the development of applications and tools that respond to urban challenges such as accessibility, road safety or citizen participation. Facilitating access to this information not only drives innovation, but also contributes to improving the quality of life in urban environments.
This potential becomes even more relevant if we consider the current context. Accelerated urban growth has brought with it new challenges, especially in the area of public health. According to data from the United Nations, it is estimated that by 2050 more than 68% of the world's population will live in cities. Therefore, the design of healthy urban environments is a priority in which open data is consolidated as a key tool: it allows planning more resilient, inclusive and sustainable cities, putting people's well-being at the center of decisions. In this post, we tell you what healthy urban environments are and how open data can help build and maintain them.
What are Healthy Urban Environments? Uses and examples
Healthy urban environments go beyond simply the absence of pollution or noise. According to the World Health Organization (WHO), these spaces must actively promote healthy lifestyles, facilitate physical activity, encourage social interaction, and ensure equitable access to basic services. As established in the Ministry of Health's "Guide to Planning Healthy Cities", these environments are characterized by three key elements:
-
Cities designed for walking: they must be spaces that prioritize pedestrian and cycling mobility, with safe, accessible and comfortable streets that invite active movement.
-
Incorporation of nature: they integrate green areas, blue infrastructure and natural elements that improve air quality, regulate urban temperature and offer spaces for recreation and rest.
-
Meeting and coexistence spaces: they have areas that facilitate social interaction, reduce isolation and strengthen the community fabric.
The role of open data in healthy urban environments
In this scenario, open data acts as the nervous system of smart cities, providing valuable information on usage patterns, citizen needs, and public policy effectiveness. Specifically, in the field of healthy urban spaces, data from:
-
Analysis of physical activity patterns: data on mobility, use of sports facilities and frequentation of green spaces reveal where and when citizens are most active, identifying opportunities to optimize existing infrastructure.
-
Environmental quality monitoring: urban sensors that measure air quality, noise levels, and temperature provide real-time information on the health conditions of different urban areas.
-
Accessibility assessment: public transport, pedestrian infrastructure and service distribution allow for the identification of barriers to access and the design of more inclusive solutions.
-
Informed citizen participation: open data platforms facilitate participatory processes where citizens can contribute local information and collaborate in decision-making.
The Spanish open data ecosystem has solid platforms that feed healthy urban space projects. For example, the Madrid City Council's Open Data Portal offers real-time information on air quality as well as a complete inventory of green areas. Barcelona also publishes data on air quality, including the locations and characteristics of measuring stations.
These portals not only store information, but structure it in a way that developers, researchers and citizens can create innovative applications and services.
Use Cases: Applications That Reuse Open Data
Several projects demonstrate how open data translates into tangible improvements for urban health. On the one hand, we can highlight some applications or digital tools such as:
-
AQI Air Quality Index: uses government data to provide real-time information on air quality in different Spanish cities.
-
GV Aire: processes official air quality data to generate citizen alerts and recommendations.
-
National Air Quality Index: centralizes information from measurement stations throughout the country.
-
Valencia Verde: uses municipal data to show the location and characteristics of parks and gardens in Valencia.
On the other hand, there are initiatives that combine multisectoral open data to offer solutions that improve the interaction between cities and citizens. For example:
-
Supermanzanas Program: uses maps showing air quality pollution levels and traffic data available in open formats such as CSV and GeoPackage from Barcelona Open Data and Barcelona City Council to identify streets where reducing road traffic can maximize health benefits, creating safe spaces for pedestrians and cyclists.
-
The DataActive platform: seeks to establish an international infrastructure in which researchers, public and private sports entities participate. The topics it addresses include land management, urban planning, sustainability, mobility, air quality and environmental justice. It aims to promote more active, healthy and accessible urban environments through the implementation of strategies based on open data and research.
Data availability is complemented by advanced visualization tools. The Madrid Spatial Data Infrastructure (IDEM) offers geographic viewers specialized in air quality and the National Geographic Institute (IGN) offers the national street map CartoCiudad with information on all cities in Spain.
Effective governance and innovation ecosystem
However, the effectiveness of these initiatives depends on new governance models that integrate multiple actors. To achieve proper coordination between public administrations at different levels, private companies, third sector organizations and citizens, it is essential to have quality open data.
Open data not only powers specific applications but creates an entire ecosystem of innovation. Independent developers, startups, research centers, and citizen organizations use this data to:
-
Develop urban health impact studies.
-
Create participatory planning tools.
-
Generate early warnings about environmental risks.
-
Evaluate the effectiveness of public policies.
-
Design personalized services according to the needs of different population groups.
Healthy urban spaces projects based on open data generate multiple tangible benefits:
-
Efficiency in public management: data makes it possible to optimize the allocation of resources, prioritize interventions and evaluate their real impact on citizen health.
-
Innovation and economic development: the open data ecosystem stimulates the creation of innovative startups and services that improve the quality of urban life, as demonstrated by the multiple applications available in datos.gob.es.
-
Transparency and participation: the availability of data facilitates citizen control and strengthens democratic decision-making processes.
-
Scientific evidence: Urban health data contributes to the development of evidence-based public policies and the advancement of scientific knowledge.
-
Replicability: successful solutions can be adapted and replicated in other cities, accelerating the transformation towards healthier urban environments.
In short, the future of our cities depends on our ability to integrate technology, citizen participation and innovative public policies. The examples analyzed demonstrate that open data is not just information; They are the foundation for building urban environments that actively promote health, equity, and sustainability.
Blog
Cities account for more than two-thirds of Europe's population and consume around 80% of energy. In this context, climate change is having a particularly severe impact on urban environments, not only because of their density, but also because of their construction characteristics, their energy metabolism and the scarcity of vegetation in many consolidated areas. One of the most visible and worrying effects is the phenomenon known as urban heat island (UHI).
Heat islands occur when the temperature in urban areas is significantly higher than in nearby rural or peri-urban areas, especially at night. This thermal differential can easily exceed five degrees Celsius under certain conditions. The consequences of this phenomenon go beyond thermal discomfort: it directly affects health, air quality, energy consumption, urban biodiversity and social equity.
In recent years, the availability of open data—especially geospatial data—has made it possible to characterize, map, and analyze urban heat islands with unprecedented accuracy. This article explores how this data can be used to design urban solutions adapted to climate change, with heat island mitigation as its focus.
What are urban heat islands and why do they occur?
Figure 1. Illustrative element on heat islands.
To intervene effectively in heat islands, it is necessary to know where, when and how they occur. Unlike other natural hazards, the heat island effect is not visible to the naked eye, and its intensity varies depending on the time of day, time of year, and specific weather conditions. It therefore requires a solid and dynamic knowledge base, which can only be built through the integration of diverse, up-to-date and territorialized data.
At this point, open geospatial data is a critical tool. Through satellite images, urban maps, meteorological data, cadastral cartography and other publicly accessible sets, it is possible to build urban thermal models, identify critical areas, estimate differential exposures and evaluate the impact of the measures adopted.
The main categories of data that allow us to address the phenomenon of heat islands from a territorial and interdisciplinary perspective are detailed below.
Types of geoespatial data applicable to the study of the phenomenon
1. Earth observation satellite data
Thermal sensors on satellites such as Landsat 8/9 (NASA/USGS) or Sentinel-3 (Copernicus) make it possible to generate urban surface temperature maps with resolutions ranging from 30 to 1,000 metres. Although these images have spatial and temporal limitations, they are sufficient to detect patterns and trends, especially if combined with time series.
This data, accessible through platforms such as the Copernicus Open Access Hub or the USGS EarthExplorer, is essential for comparative studies between cities or for observing the temporal evolution of the same area.
2. Urban weather data
The network of AEMET stations, together with other automatic stations managed by autonomous communities or city councils, allows the evolution of air temperatures in different urban points to be analysed. In some cases, there are also citizen sensors or networks of sensors distributed in the urban space that allow real-time heat maps to be generated with high resolution.
3. Urban mapping and digital terrain models
Digital surface models (DSM), digital terrain models (DTM) and mappings derived from LIDAR allow the study of urban morphology, building density, street orientation, terrain slope and other factors that affect natural ventilation and heat accumulation. In Spain, this data is accessible through the National Center for Geographic Information (CNIG).
4. Land cover and land use databases
Databases such as Corine Land Cover of the Copernicus Programme, or land use maps at the regional level make it possible to distinguish between urbanised areas, green areas, impermeable surfaces and bodies of water. This information is key to calculating the degree of artificialization of an area and its relationship with the heat balance.
5. Inventories of urban trees and green spaces
Some municipalities publish on their open data portals the detailed inventory of urban trees, parks and gardens. These georeferenced data make it possible to analyse the effect of vegetation on thermal comfort, as well as to plan new plantations or green corridors.
6. Socioeconomic and vulnerability data
Data from the National Institute of Statistics (INE), together with the social information systems of autonomous communities and city councils, make it possible to identify the most vulnerable neighbourhoods from a social and economic point of view. Its cross-referencing with thermal data allows a climate justice dimension to be incorporated into decision-making.
Practical applications: how open data is used to act
Once the relevant data has been gathered and integrated, multiple analysis strategies can be applied to support public policies and urban projects with sustainability and equity criteria. Some of the main applications are described below.
· Heat zone mapping and vulnerability maps: Using thermal imagery, weather data, and urban layers together, heat island intensity maps can be generated at the neighborhood or block level. If these maps are combined with social, demographic and public health indicators, it is possible to build thermal vulnerability maps, which prioritize intervention in areas where high temperatures and high levels of social risk intersect. These maps allow, for example:
· Identify priority neighborhoods for urban greening.
· Plan evacuation routes or shaded areas during heat waves.
· Determine the optimal location of climate refuges.
· Assessing the impact of nature-based solutions: Open data also makes it possible to monitor the effects of certain urban actions. For example, using time series of satellite images or temperature sensors, it is possible to assess how the creation of a park or the planting of trees on a street has modified the surface temperature. This ex-post evaluation approach allows justifying public investments, adjusting designs and scaling effective solutions to other areas with similar conditions.
· Urban modelling and climate simulations: three-dimensional urban models, built from open LIDAR data or cadastral mapping, make it possible to simulate the thermal behaviour of a neighbourhood or city under different climatic and urban scenarios. These simulations, combined with tools such as ENVI-met or Urban Weather Generator, are essential to support decision-making in urban planning.
Existing studies and analysis on urban heat islands: what has been done and what we can learn
During the last decade, multiple studies have been carried out in Spain and Europe that show how open data, especially geospatial data, allow the phenomenon of urban heat islands to be characterised and analysed. These works are fundamental not only because of their specific results, but also because they illustrate replicable and scalable methodologies. Some of the most relevant are described below.
Polytechnic University of Madrid study on surface temperature in Madrid
A team from the Department of Topographic Engineering and Cartography of the UPM analysed the evolution of surface temperature in the municipality of Madrid using thermal images from the Landsat 8 satellite in the summer period. The study focused on detecting spatial changes in warmer areas and relating them to land use, urban vegetation and building density.
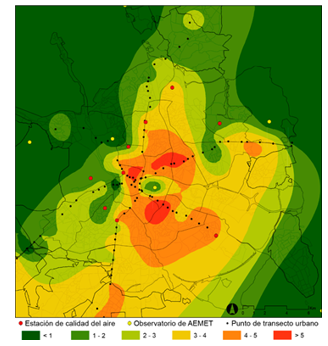
Figure 2. Illustrative image. Source: generated with AI
Methodology:
Remote sensing techniques were applied to extract the surface temperature from the TIRS thermal channel of the Landsat. Subsequently, a statistical analysis of correlation between thermal values and variables such as NDVI (vegetation index), type of land cover (CORINE data) and urban morphology was carried out.
Main results:
Areas with higher building density, such as the central and southern neighborhoods, showed higher surface temperatures. The presence of urban parks reduced the temperature of their immediate surroundings by 3 to 5 °C. It was confirmed that the heat island effect intensifies at night, especially during persistent heat waves.
This type of analysis is especially useful for designing urban greening strategies and for justifying interventions in vulnerable neighbourhoods.
Barcelona Climate Vulnerability Atlas
Barcelona City Council, in collaboration with experts in public health and urban geography, developed a Climate Vulnerability Atlas which includes detailed maps of heat exposure, population sensitivity, and adaptive capacity. The objective was to guide municipal policies against climate change, especially in the field of health and social services.

Figure 3. Image containing fence, exterior, buildings and grass. Source: generated with AI
Methodology:
The atlas was developed by combining open and administrative data at the census tract level. Three dimensions were analysed: exposure (air temperature and surface data), sensitivity (advanced age, density, morbidity) and adaptive capacity (access to green areas, quality of housing, facilities). The indicators were normalized and combined through multi-criteria spatial analysis to generate a climate vulnerability index. The result made it possible to locate the neighbourhoods most at risk from extreme heat and to guide municipal measures.
Main results:
Based on the atlas, the network of "climate shelters" was designed, which includes libraries, civic centers, schools and conditioned parks, activated during episodes of extreme heat. The selection of these spaces was based directly on the atlas data.
Multitemporal analysis of the heat island effect in Seville
Researchers from the University of Seville used satellite data from Sentinel-3 and Landsat 8 to study the evolution of the heat island phenomenon in the city between 2015 and 2022. The aim was to evaluate the effectiveness of certain urban actions – such as the "Green your neighbourhood" plan – and to anticipate the effects of climate change on the city.
Methodology:
Thermal imaging and NDVI data were used to calculate temperature differences between urban areas and surrounding rural areas. Supervised classification techniques were also applied to identify land uses and their evolution. Open data from tree inventories and urban shade maps were used to interpret the results.
Main results:
Specific renaturation actions have a very positive local impact, but their effect on the city as a whole is limited if they are not integrated into a metropolitan-scale strategy. The study concluded that a continuous network of vegetation and bodies of water is more effective than isolated actions.
European comparison of the Urban Heat Island Atlas (Copernicus) project
Although it is not a Spanish study, the viewer developed by Copernicus for the European Urban Atlas programme offers a comparative analysis between European cities.
Methodology:
The viewer integrates Sentinel-3 thermal imagery, land cover data, and urban mapping to assess the severity of the heat island effect.

Figure 4. Illustration: Infographic showing the main factors causing the urban heat island effect (UHI). Urban areas retain heat due to tall buildings, impermeable surfaces and heat-retaining materials, while green areas are cooler Source: Urban heat islands.
Main results:
This type of tool allows smaller cities to have a first approximation of the phenomenon without the need to develop their own models. As it is based on open and free data, the viewer allows direct consultations by technicians and citizens.
Current limitations and challenges
Despite progress in opening up data, there are still significant challenges:
-
Territorial inequality: not all cities have the same quality and quantity of data.
-
Irregular update: Some sets are released on a one-off basis and are not updated regularly.
-
Low granularity: Data is often aggregated by districts or census tracts, making street-scale interventions difficult.
-
Lack of technical capacities: Many local governments do not have staff specialized in geospatial analysis.
- Little connection with citizens: the knowledge generated from data does not always translate into visible or understandable actions for the population.
Conclusion: building climate resilience from geoespatial data
Urban heat islands are not a new phenomenon, but in the context of climate change they take on a critical dimension. Cities that do not plan based on data will be increasingly exposed to episodes of extreme heat, with unequal impacts among their populations.
Open data—and in particular geospatial data—offers a strategic opportunity to transform this threat into a lever for change. With them we can identify, anticipate, intervene and evaluate. But for this to happen, it is essential to:
· Consolidate accessible, up-to-date and quality data infrastructures.
· To promote collaboration between levels of government, research centres and citizens.
· Train municipal technicians in the use of geospatial tools.
· Promote a culture of evidence-based decision-making and climate sensitivity.
Data does not replace politics, but it allows it to be founded, improved and made more equitable. In a global warming scenario, having open geospatial data is a key tool to make our cities more livable and better prepared for the future.
Content prepared by Mayte Toscano, Senior Consultant in Data Economy Technologies. The contents and points of view reflected in this publication are the sole responsibility of the author.
Blog
In a world increasingly exposed to natural hazards and humanitarian crises, accurate and up-to-date geospatial data can make the difference between effective response and delayed reaction. The building footprints, i.e. the contours of buildings as they appear on the ground, are one of the most valuable resources in emergency contexts.
In this post we will delve deeper into this concept, including where to obtain open building footprint data, and highlight its importance in one of its many use cases: emergency management.
What are buildings footprints
The building footprints are geospatial representations, usually in vector format, showing the outline of structures built on the ground. That is, they indicate the horizontal projection of a building on the ground, viewed from above, as if it were a floor plan.
These footprints can include residential buildings as well as industrial, commercial, institutional or even rural buildings. Depending on the data source, they may be accompanied by additional attributes such as height, number of floors, building use or date of construction, making them a rich source of information for multiple disciplines.
Unlike an architectural plan showing internal details, building footprints are limited to the perimeter of the building in contact with the ground. This simplicity makes them lightweight, interoperable and easily combined with other geographic information layers, such as road networks, risk areas, critical infrastructures or socio-demographic data.
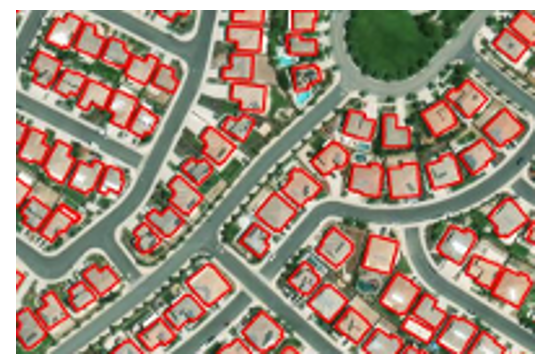
Figure 1. Example of building footprints: each polygon represents the outline of a building as seen from above.
How are they obtained?
There are several ways to generate building footprints:
- From satellite or aerial imagery: using photo-interpretation techniques or, more recently, artificial intelligence and machine learning algorithms.
- With cadastral data or official registers: as in the case of the Cadastre in Spain, which maintains precise vector bases of all registered constructions.
- By collaborative mapping: platforms such as OpenStreetMap (OSM) allow volunteer users to manually digitise visible footprints on orthophotos.
What are they for?
Building footprints are essential for:
- Urban and territorial analysis: allow the study of built density, urban sprawl or land use.
- Cadastral and real estate management: are key to calculating surface areas, applying taxes or regulating buildings.
- Planning of infrastructures and public services: they help to locate facilities, design transport networks or estimate energy demand.
- 3D modelling and smart cities: serve as a basis for generating three-dimensional urban models.
- Risk and emergency management: to identify vulnerable areas, estimate affected populations or plan evacuations.
In short, building footprints are a basic piece of the spatial data infrastructure and, when offered as open, accessible and up-to-date data, they multiply their value and usefulness for society as a whole.
Why are they key in emergency situations?
Of all the possible use cases, in this article we will focus on emergency management. During such a situation - such as an earthquake, flood or wildfire - responders need to know which areas are built-up, how many people can inhabit those structures, how to access them and where to concentrate resources. The building footprints allow:
- Rapidly estimate the number of people potentially affected.
- Prioritise intervention and rescue areas.
- Plan access and evacuation routes.
- Cross-reference data with other layers (social vulnerability, risk areas, etc.).
- Coordinate action between emergency services, local authorities and international cooperation.
Open data available
In an emergency, it is essential to know where to locate building footprint data. One of the most relevant developments in the field of data governance is the increasing availability of building footprints as open data. This type of information, previously restricted to administrations or specialised agencies, can now be freely used by local governments, NGOs, researchers and businesses.
Some of the main sources available for emergency management and other purposes are summarised below:
- JRC - Global Human Settlement Layer (GHSL): the Joint Research Centre of the European Commission offers a number of products derived from satellite imagery analysis:
- GHS-BUILT-S: raster data on global built-up areas.
- GHS-BUILD-V: AI-generated vector building footprints for Europe.
- Downloading data: https://ghsl.jrc.ec.europa.eu/download.php
- IGN and Cadastre of Spain: the footprints of official buildings in Spain can be obtained through the Cadastre and the Instituto Geográfico Nacional (IGN).. They are extremely detailed and up-to-date.
- Download centre of the IGN: https://centrodedescargas.cnig.es
- Cadastral Surveyor: https://www.sedecatastro.gob.es.
- Copernicus Emergency Management Service: provides mapping products generated in record time when an emergency (earthquakes, floods, fires, etc.) is triggered.. They include damage maps and footprints of affected buildings.
- Download centre: https://emergency.copernicus.eu/mapping/list-of-components/EMSR
- Important: to download detailed vector data (such as footprints), you need to register on the platform DIAS/Copernicus EMS or request access on a case-by-case basis.
- OpenStreetMap (OSM): collaborative platform where users from all over the world have digitised building footprints, especially in areas not covered by official sources. It is especially useful for humanitarian projects, rural and developing areas, and cases where rapid updating or local involvement is needed.
- Downloading data: https://download.geofabrik.de
- Google Open Buildings: this Google project offers more than 2 billion building footprints in Africa, Asia and other data-scarce regions, generated with artificial intelligence models. It is especially useful for humanitarian purposes, urban development in countries of the global south, and risk exposure assessment in places where there are no official cadastres.
- Direct access to the data: https://sites.research.google/open-buildings/
- Microsoft Building Footprints: Microsoft has published sets of building footprints generated with machine learning algorithms applied to aerial and satellite imagery. Coverage: United States, Canada, Uganda, Tanzania, Nigeria and recently India. The data is open access under the ODbL licence.
- Meta (ex Facebook) AI Buildings Footprints: Meta AI has published datasets generated through deep learning in collaboration with the Humanitarian OpenStreetMap Team (HOT). They focused on African and Southeast Asian countries.
- Direct access to the data: https://dataforgood.facebook.com/dfg/tools/buildings.
Comparative table of open building footprints sources
| Source/Project | Geographic coverage | Data type | Format | Requires registration | Main use |
|---|---|---|---|---|---|
| JRC GHSL | Global (raster) / Europe (vector) | Raster and vector | GeoTIFF / GeoPackage / Shapefile | No | Urban analysis, European planning, comparative studies |
| IGN + Cadastre Spain | Spain | Official vector | GML/Shapefile/WFS/WMS | No | Cadastral data, urban planning, municipal management |
| Copernicus EMS | Europe and global (upon activation) | Vector (post-emergency) | PDF / GeoTIFF / Shapefile | Yes (for detailed vector data) | Rapid mapping, emergency management |
| OpenStreetMap | Global (varies by area) | Collaborative vector | .osm / shapefile / GeoJSON | No | Base maps, rural areas, humanitarian aid |
| Google Open Buildings | Africa, Asia, LatAm (selected areas) | Vector (AI-generated) | CSV / GeoJSON | No | Risk assessment, planning in developing countries |
| Microsoft Buildings Footprints | USA, Canada, India, Africa | Vector (AI) | GeoJSON | No | Massive data, urban planning, rural areas |
| Meta AI | Africa, Asia (specific areas) | Vector (AI) | GeoJSON / CSV | No | Humanitarian aid, complementing OSM in uncovered areas |
Figure 2. Comparative table of open building footprint sources.
Combination and integrated use of data
One of the great advantages of these sources being open and documented is the possibility of combining them to improve the coverage, accuracy and operational utility of building footprints. Here are some recommended approaches:
1. Complementing areas without official coverage
- In regions where cadastre is not available or up to date (such as many rural areas or developing countries), it is useful to use Google Open Buildings or OpenStreetMap as a basis.
- GHSL also provides a harmonised view on a continental scale, useful for planning and comparative analysis.
2. Cross official and collaborative layers
- The Spanish cadastre footprints can be enriched with OSM data when new or modified areas are detected, especially after an event such as a catastrophe.
- This combination is ideal for small municipalities that do not have their own technical capacity, but want to keep their data up to date.
3. Integration with socio-demographic and risk data
- Footprints gain value when integrated into geographic information systems (GIS) alongside layers such as:
- Population per building (INE, WorldPop).
- Flood zones (MAPAMA, Copernicus).
- Health centres or schools.
- Critical infrastructure (electricity grid, water).
This allows modelling risk scenarios, planning evacuations or even simulating potential impacts of an emergency.
4. Combined use in actual activations
Some real-world examples of uses of this data include:
- In cases such as the eruption on La Palma, data from the Cadastre, OSM and Copernicus EMS products were used simultaneously to map damage, estimate the affected population and plan assistance.
- During the earthquake in Turkey in 2023, organisations such as UNOSAT and Copernicus combined satellite imagery with automatic algorithms to detect structural collapses and cross-reference them with existing footprints. This made it possible to quickly estimate the number of people potentially trapped.
In emergency situations, time is a critical resource. Artificial intelligence applied to satellite or aerial imagery makes it possible to generate building footprints much faster and more automated than traditional methods.
In short, the different sources are not exclusive, but complementary. Its strategic integration within a well-governed data infrastructure is what allows moving from data to impact, and putting geospatial knowledge at the service of security, planning and collective well-being.
Data governance and coordination
Having quality building footprints is an essential first step, but their true value is only activated when these data are well governed, coordinated between actors and prepared to be used efficiently in real-world situations. This is where data governancecomes into play: the set of policies, processes and organisational structures that ensure that data is available, reliable, up-to-date and used responsibly.
Why is data governance key?
In emergency or territorial planning contexts, the lack of coordination between institutions or the existence of duplicated, incomplete or outdated data can have serious consequences: delays in decision-making, duplication of efforts or, in the worst case, erroneous decisions. Good data governance ensures that:
- Data must be known and findable: It is not enough that it exists; it must be documented, catalogued and accessible on platforms where users can easily find it.
- Have standards and interoperability: building footprints should follow common formats (such as GeoJSON, GML, shapefile), use consistent reference systems, and be aligned with other geospatial layers (utility networks, administrative boundaries, risk zones...).
- Keep up to date: especially in urban or developing areas, where new construction is rapidly emerging. Data from five years ago may be useless in a current crisis.
- Coordination between levels of government: municipal, regional, national and European. Efficient sharing avoids duplication and facilitates joint responses, especially in cross-border or international contexts.
- Clear roles and responsibilities are defined: who produces the data, who validates it, who distributes it, who activates it in case of emergency?
The value of collaboration
A robust data governance ecosystem must also foster multi-sector collaboration. Public administrations, emergency services, universities, the private sector, humanitarian organisations and citizens can benefit from (and contribute to) the use and improvement of this data.
For example, in many countries, local cadastres work in collaboration with agencies such as national geographic institutes, while citizen science and collaborative mapping initiatives (such as OpenStreetMap) can complement or update official data in less covered areas.
Emergency preparedness
In crisis situations, coordination must be anticipated. It is not just about having the data, but about having clear operational plans on how to access it, who activates it, in what formats, and how it integrates with response systems (such as Emergency Coordination Centres or civil protection GIS).
Therefore, many institutions are developing protocols for activating geospatial data in emergencies, and platforms such as Copernicus Emergency Management Service already work on this principle, offering products based on well-governed data that can be activated in record time.
Conclusion
Building footprints are not just a technical resource for urban planners or cartographers: they are a critical tool for risk management, sustainable urban planning and citizen protection. In emergency situations, where time and accurate information are critical factors, having this data can make the difference between an effective intervention and an avoidable tragedy.
Advances in Earth observation technologies, the use of artificial intelligence and the commitment to open data by institutions such as the JRC and the IGN have democratised access to highly valuable geospatial information. Today it is possible for a local administration, an NGO or a group of volunteers to access building footprints to plan evacuations, estimate affected populations or design logistical routes in real time.
However, the challenge is not only technological, but also organisational and cultural. It is imperative to strengthen data governance: to ensure that these sets are well documented, updated, accessible and that their use is integrated into emergency and planning protocols. It is also essential to train key actors, promote interoperability and foster collaboration between public institutions, the private sector and civil society.
Ultimately, building footprints represent much more than geometries on a map: they are a foundation on which to build resilience, save lives and improve decision-making at critical moments. Betting for its responsible and open use means betting for a smarter, more coordinated and people-centred public management.
Content prepared by Mayte Toscano, Senior Consultant in Data Economy Technologies. The contents and points of view reflected in this publication are the sole responsibility of the author.
Application
Bizidata is a platform that visualises, analyses and allows you to download data on bicycle use in Vitoria-Gasteiz and explore how external factors, such as weather and traffic, influence bicycle use.
This application collects and combines the following data:
- Bicycle use: data from the Vitoria-Gasteiz City Council.
- Temperature between 2015 and 2021: Aemet data.
- Temperatures between 2022 and today: Euskalmet (station C040).
- Precipitation: Euskalmet (station C076).
- Traffic: Traffic Directorate of the Basque Government.
Bizidata was the winning application in the web services category of the Euskadi 2024 Open Data Competition.
Blog
Geospatial data capture is essential for understanding our environment, making informed decisions and designing effective policies in areas such as urban planning, natural resource management or emergency response. In the past, this process was mainly manual and labour-intensive, based on ground measurements made with tools such as total stations and levels. Although these traditional techniques have evolved significantly and are still widely used, they have been complemented by automated and versatile methods that allow more efficient and detailed data collection.
The novelty in the current context lies not only in technological advances, which have improved the accuracy and efficiency of geospatial data collection, but also because it coincides with a widespread shift in mindset towards transparency and accessibility. This approach has encouraged the publication of the data obtained as open resources, facilitating their reuse in applications such as urban planning, energy management and environmental assessment. The combination of advanced technology and an increased awareness of the importance of information sharing marks a significant departure from traditional techniques.
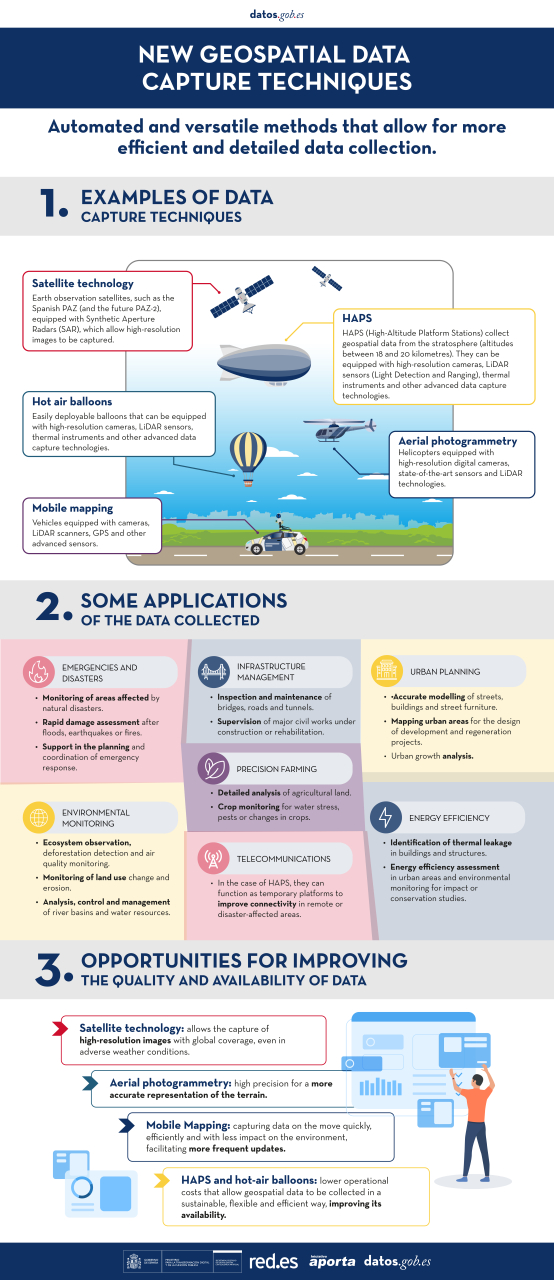
In this article, we will explore some of the new methods of data capture, from photogrammetric flights with helicopters and drones, to ground-based systems such as mobile mapping, which use advanced sensors to generate highly accurate three-dimensional models and maps. In addition, we will learn how these technologies have empowered the generation of open data, democratising access to key geospatial information for innovation, sustainability and public-private collaboration.
Aerial photogrammetry: helicopters with advanced sensors
In the past, capturing geospatial data from the air involved long and complex processes. Analogue cameras mounted on aircraft generated aerial photographs that had to be processed manually to create two-dimensional maps. While this approach was innovative at the time, it also had limitations, such as lower resolution, long processing times and greater dependence on weather and daylight. However, technological advances have reduced these restrictions, even allowing operations at night or in adverse weather conditions.
Today, aerial photogrammetry has taken a qualitative leap forward thanks to the use of helicopters equipped with state-of-the-art sensors. The high-resolution digital cameras allow images to be captured at multiple angles, including oblique views that provide a more complete perspective of the terrain. In addition, the incorporation of thermal sensors and LiDAR (Light Detection and Ranging) technologies adds an unprecedented layer of detail and accuracy. These systems generate point clouds and three-dimensional models that can be integrated directly into geospatial analysis software, eliminating much of the manual processing.
| Features | Advantages | Disadvantages |
|---|---|---|
| Coverage and flexibility | It allows coverage of large areas and access to complex terrain. | May be limited for use in areas with airspace restrictions. Inaccessible to undergrouns or difficult to access areas such as tunnels. |
| Data type | Capture visual, thermal and topographic data in a single flight. | - |
| Precision | Generates point clouds and 3D models with high accuracy. | - |
| Efficiency in large projects | It allows coverage of large areas where drones do not have sufficient autonomy. | High operational cost compared to other technologies. |
|
Environmental impact and noise
|
- | Generates noise and greater environmental impact, limiting its use in sensitive areas. |
| Weather conditions | - | It depends on the weather; adverse conditions such as wind or rain affect its operation. |
| Amortised | - | High cost compared to drones or ground-based methods. |
Figure 1. Table with advantages and disadvantages of aerial photogrammetry with helicopters.
Mobile mapping: from backpacks to BIM integration
The mobile mapping is a geospatial data capture technique using vehicles equipped with cameras, LiDAR scanners, GPS and other advanced sensors. This technology allows detailed information to be collected as the vehicle moves, making it ideal for mapping urban areas, road networks and dynamic environments.
In the past, topographic surveys required stationary measurements, which meant traffic disruptions and considerable time to cover large areas. In contrast, mobile mapping has revolutionised this process, allowing data to be captured quickly, efficiently and with less impact on the environment. In addition, there are portable versions of this technology, such as backpacks with robotic scanners, which allow access to pedestrian or hard-to-reach areas.
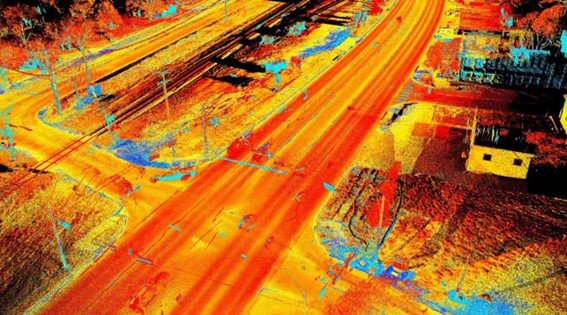
Figure 2. Image captured with mobile mapping techniques.
| Features | Advantages | Disadvantages |
|---|---|---|
| Speed | Captures data while the vehicle is on the move, reducing operating times. | Lower accuracy in areas with poor visibility for sensors (e.g. tunnels). |
| Urban coverage | Ideal for urban environments and complex road networks. | It is efficient in areas where vehicles can circulate, but its range is limited such as in rural or inaccessible terrain. |
| Flexibility of implementation | Available in portable (backpack) versions for pedestrian or hard-to-reach areas. | Portable equipment tends to have a shorter range than vehicular systems. |
| GIS and BIM implementation | It facilitates the generation of digital models and their use in planning and analysis. | Requires advanced software to process large volumes of data. |
| Impact on the environment | It does not require traffic interruptions or exclusive access to work areas. | Dependence on optimal environmental conditions, such as adequate light and climate. |
| Accessibility | Accessible to underground or hard-to-reach areas such as tunnels |
Figure 3. Table with advantages and disadvantages of mobile mopping.
The mobile mapping is presented as a versatile and efficient solution for capturing geospatial data on the move, becoming a key tool for the modernisation of urban and territorial management systems.
HAPS and ballons: new heights for information capture
HAPS (High-Altitude Platform Stations) and hot-air balloons represent an innovative and efficient alternative for capturing geospatial data from high altitudes. These platforms, located in the stratosphere or at controlled altitudes, combine features of drones and satellites, offering an intermediate solution that stands out for its versatility and sustainability:
- HAPS, like zeppelins and similar aircraft, operate in the stratosphere, at altitudes between 18 and 20 kilometres, allowing a wide and detailed view of the terrain.
- The aerostatic balloons, on the other hand, are ideal for local or temporary studies, thanks to their easiness of deployment and operation at lower altitudes.
Both technologies can be equipped with high-resolution cameras, LiDAR sensors, thermal instruments and other advanced technologies for data capture.
| Features | Advantages | Disadvantages |
|---|---|---|
| Useful | Large capture area, especially with HAPS in the stratosphere. | Limited coverage compared to satellites in orbit. |
| Sustainability | Lower environmental impact and energy footprint compared to helicopters or aeroplanes. | Dependence on weather conditions for deployment and stability. |
| Amortised | Lower operating costs than traditional satellites. | Higher initial investment than drones or ground equipment. |
| Versatility | Ideal for temporary or emergency projects. | Limited range in hot air balloons. |
| Duration of operation | HAPS can operate for long periods (days or weeks). | Hot air balloons have a shorter operating time. |
Figure 4. Table with advantages and disadvantages of HAPS and ballons
HAPS and balloons are presented as key tools to complement existing technologies such as drones and satellites, offering new possibilities in geospatial data collection in a sustainable, flexible and efficient way. As these technologies evolve, their adoption will expand access to crucial data for smarter land and resource management.
Satellite technology: PAZ satellite and its future with PAZ-2
Satellite technology is a fundamental tool for capturing geospatial data globally. Spain has taken significant steps in this field with the development and launch of the PAZ satellite. This satellite, initially designed for security and defence purposes, has shown enormous potential for civilian applications such as environmental monitoring, natural resource management and urban planning.
PAZ is an Earth observation satellite equipped with a synthetic aperture radar (SAR), which allows high-resolution imaging, regardless of weather or light conditions.
The upcoming launch of PAZ-2 (planned for 2030) promises to further expand Spain''s observation capabilities. This new satellite, designed with technological improvements, aims to complement the functions of PAZ and increase the availability of data for civil and scientific applications. Planned improvements include:
- Higher image resolution.
- Ability to monitor larger areas in less time.
- Increased frequency of captures for more dynamic analysis.
| Feature | Advantages | Disadvantages |
|---|---|---|
| Global coverage | Ability to capture data from anywhere on the planet. | Limitations in resolution compared to more detailed terrestrial technologies. |
| Climate independance | SAR sensors allow captures even in adverse weather conditions. | |
| Data frequency | PAZ-2 will improve the frequency of captures, ideal for continuous monitoring. | Limited time in the lifetime of the satellite. |
| Access to open data | It encourages re-use in civil and scientific projects. | Requires advanced infrastructure to process large volumes of data. |
Figure 5. Table with advantages and disadvantages of PAZ and PAZ-2 satellite technology
With PAZ and the forthcoming PAZ-2, Spain strengthens its position in the field of satellite observation, opening up new opportunities for efficient land management, environmental analysis and the development of innovative solutions based on geospatial datas. These satellites are not only a technological breakthrough, but also a strategic tool to promote sustainability and international cooperation in data access.
Conclusion: challenges and opportunities in data management
The evolution of geospatial data capture techniques offers a unique opportunity to improve the accuracy, accessibility and quality of data, and in the specific case of open data, it is essential to foster transparency and re-use of public information. However, this progress cannot be understood without analysing the role played by technological tools in this process.
Innovations such as LiDAR in helicopters, Mobile Mapping, SAM, HAPS and satellites such as PAZ and PAZ-2 not only optimise data collection, but also have a direct impact on data quality and availability.
In short, these technological tools generate high quality information that can be made available to citizens as open data, a situation that is being driven by the shift in mindset towards transparency and accessibility. This balance makes open data and technological tools complementary, essential to maximise the social, economic and environmental value of geospatial data.
You can see a summary of these techniques and their applications in the following infographic:
Content prepared by Mayte Toscano, Senior Consultant in Data Economy Technologies. The contents and points of view reflected in this publication are the sole responsibility of the author.
Blog
A digital twin is a virtual, interactive representation of a real-world object, system or process. We are talking, for example, about a digital replica of a factory, a city or even a human body. These virtual models allow simulating, analysing and predicting the behaviour of the original element, which is key for optimisation and maintenance in real time.
Due to their functionalities, digital twins are being used in various sectors such as health, transport or agriculture. In this article, we review the benefits of their use and show two examples related to open data.
Advantages of digital twins
Digital twins use real data sources from the environment, obtained through sensors and open platforms, among others. As a result, the digital twins are updated in real time to reflect reality, which brings a number of advantages:
- Increased performance: one of the main differences with traditional simulations is that digital twins use real-time data for modelling, allowing better decisions to be made to optimise equipment and system performance according to the needs of the moment.
- Improved planning: using technologies based on artificial intelligence (AI) and machine learning, the digital twin can analyse performance issues or perform virtual "what-if" simulations. In this way, failures and problems can be predicted before they occur, enabling proactive maintenance.
- Cost reduction: improved data management thanks to a digital twin generates benefits equivalent to 25% of total infrastructure expenditure. In addition, by avoiding costly failures and optimizing processes, operating costs can be significantly reduced. They also enable remote monitoring and control of systems from anywhere, improving efficiency by centralizing operations.
- Customization and flexibility: by creating detailed virtual models of products or processes, organizations can quickly adapt their operations to meet changing environmental demands and individual customer/citizen preferences. For example, in manufacturing, digital twins enable customized mass production, adjusting production lines in real time to create unique products according to customer specifications. On the other hand, in healthcare, digital twins can model the human body to customize medical treatments, thereby improving efficacy and reducing side effects.
- Boosting experimentation and innovation: digital twins provide a safe and controlled environment for testing new ideas and solutions, without the risks and costs associated with physical experiments. Among other issues, they allow experimentation with large objects or projects that, due to their size, do not usually lend themselves to real-life experimentation.
- Improved sustainability: by enabling simulation and detailed analysis of processes and systems, organizations can identify areas of inefficiency and waste, thus optimizing the use of resources. For example, digital twins can model energy consumption and production in real time, enabling precise adjustments that reduce consumption and carbon emissions.
Examples of digital twins in Spain
The following three examples illustrate these advantages.
GeDIA project: artificial intelligence to predict changes in territories
GeDIA is a tool for strategic planning of smart cities, which allows scenario simulations. It uses artificial intelligence models based on existing data sources and tools in the territory.
The scope of the tool is very broad, but its creators highlight two use cases:
- Future infrastructure needs: the platform performs detailed analyses considering trends, thanks to artificial intelligence models. In this way, growth projections can be made and the needs for infrastructures and services, such as energy and water, can be planned in specific areas of a territory, guaranteeing their availability.
- Growth and tourism: GeDIA is also used to study and analyse urban and tourism growth in specific areas. The tool identifies patterns of gentrification and assesses their impact on the local population, using census data. In this way, demographic changes and their impact, such as housing needs, can be better understood and decisions can be made to facilitate equitable and sustainable growth.
This initiative has the participation of various companies and the University of Malaga (UMA), as well as the financial backing of Red.es and the European Union.
Digital twin of the Mar Menor: data to protect the environment
The Mar Menor, the salt lagoon of the Region of Murcia, has suffered serious ecological problems in recent years, influenced by agricultural pressure, tourism and urbanisation.
To better understand the causes and assess possible solutions, TRAGSATEC, a state-owned environmental protection agency, developed a digital twin. It mapped a surrounding area of more than 1,600 square kilometres, known as the Campo de Cartagena Region. In total, 51,000 nadir images, 200,000 oblique images and more than four terabytes of LiDAR data were obtained.
Thanks to this digital twin, TRAGSATEC has been able to simulate various flooding scenarios and the impact of installing containment elements or obstacles, such as a wall, to redirect the flow of water. They have also been able to study the distance between the soil and the groundwater, to determine the impact of fertiliser seepage, among other issues.
Challenges and the way forward
These are just two examples, but they highlight the potential of an increasingly popular technology. However, for its implementation to be even greater, some challenges need to be addressed, such as initial costs, both in technology and training, or security, by increasing the attack surface. Another challenge is the interoperability problems that arise when different public administrations establish digital twins and local data spaces. To address this issue further, the European Commission has published a guide that helps to identify the main organisational and cultural challenges to interoperability, offering good practices to overcome them.
In short, digital twins offer numerous advantages, such as improved performance or cost reduction. These benefits are driving their adoption in various industries and it is likely that, as current challenges are overcome, digital twins will become an essential tool for optimising processes and improving operational efficiency in an increasingly digitised world.
Blog
Today, digital technologies are revolutionising various sectors, including the construction sector, driven by the European Digital Strategy which not only promotes innovation and the adoption of digital technologies, but also the use and generation of potentially open data. The incorporation of advanced technologies has fostered a significant transformation in construction project management, making information more accessible and transparent to all stakeholders.
One of the key elements in this transformation are Digital Building Permits and Digital Building Logs, concepts that are improving the efficiency of administrative processes and the execution of construction projects, and which can have a significant impact on the generation and management of data in the municipalities that adopt them.
Digital Building Permits (DBP) and Digital Building Logs (DBL) not only generate key information on infrastructure planning, execution and maintenance, but also make this data accessible to the public and other stakeholders. The availability of this open data enables advanced analysis, academic research, and the development of innovative solutions for building more sustainable and safer infrastructure.
What is the Digital Building Permit?
The Digital Building Permit is the digitalisation of traditional building permit processes. Traditionally, this process was manual, involving extensive exchange of physical documents and coordination between multiple stakeholders. With digitisation, this procedure is simplified and made more efficient, allowing for a faster, more transparent and less error-prone review. Furthermore, thanks to this digitisation, large amounts of valuable data are proactively generated that not only optimise the process, but can also be used to improve transparency and carry out research in the sector. This data can be harnessed for advanced analytics, contributing to the development of smarter and more sustainable infrastructures. It also facilitates the integration of technologies such as Building Information Modelling (BIM) and digital twins, which are essential for the development of smart infrastructures.
- BIM allows the creation of detailed digital representations of infrastructure, incorporating precise information about each building component. This digital model facilitates not only the design, but also the management and maintenance of the building throughout its life cycle. In Spain, the legislation related to the use of Building Information Modeling (BIM) is mainly governed by the Law 9/2017 on Public Sector Contracts. This law establishes the possibility to require the use of BIM in public works projects. This regulation aims to improve efficiency, transparency and sustainability in the procurement and execution of public works and services in Spain.
- Digital twins are virtual replicas of physical infrastructures that allow the behaviour of a building to be simulated and analysed in real time thanks to the data generated. This data is not only crucial for the functioning of the digital twin, but can also be used as open data for research, public policy improvement and transparency in the management of infrastructures. These digital twins are essential to anticipate problems before they occur, optimise energy efficiency and proactively manage maintenance.
Together, these technologies can not only streamline the permitting process, but also ensure that buildings are safer, more sustainable and aligned with current regulations, promoting the development of smart infrastructure in an increasingly digitised environment.
What is a Digital Building Log?
The Digital Building Log is a tool for keeping a detailed and digitised record of all activities, decisions and modifications made during the life of a construction project. This register includes data on permits issued, inspections carried out, design changes, and any other relevant interventions. It functions as a digital logbook that provides a transparent and traceable overview of the entire construction process.
This approach not only improves transparency and traceability, but also facilitates monitoring and compliance by keeping an up-to-date register accessible to all stakeholders.
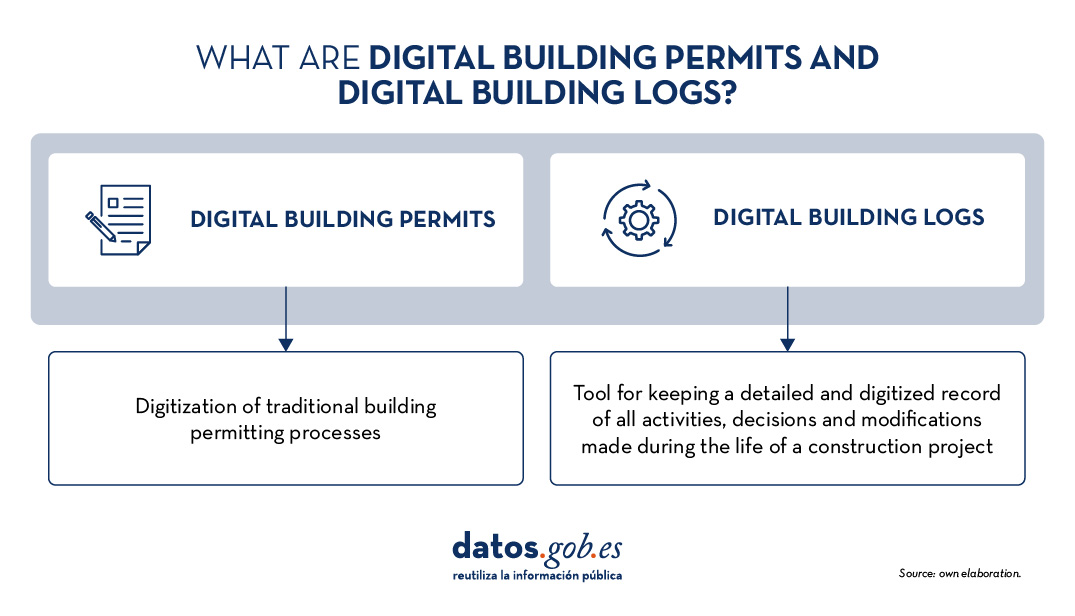
Figure 1. What are Digital Building Permits and Digital Building Logs? Own elaboration.
Key Projects and Objectives in the Sector
Several European projects are incorporating Digital Building Permits and Digital Building Logs as part of their strategy to modernise the construction sector. Some of the most innovative projects in this field are highlighted below:
ACCORD
The ACCORD Project (2022-2025) is an European initiative that aims to transform the process of obtaining and managing construction permits through digitisation. ACCORD, which stands for"Automated Compliance Checking and Orchestration of Building Projects", aims to develop a semantic framework to automatically check compliance, improve efficiency and ensure transparency in the building sector. In addition, ACCORD will develop:
- A rule formalisation tool based on semantic web technologies.
- A semantic rules database.
- Microservices for compliance verification in construction.
- A set of open and standardised APIs to enable integrated data flow between building permit, compliance and other information services.
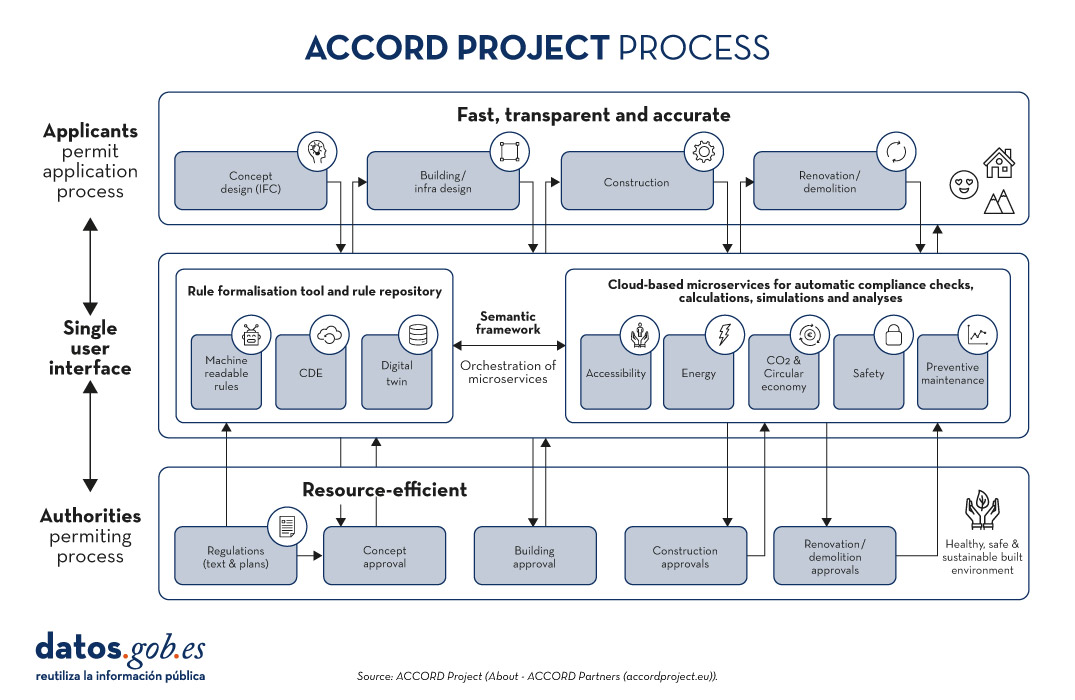
Figure 2. ACCORD project process.Source: Proyecto ACCORD.
The ACCORD Project focuses on several demonstrations in various European countries, each with a specific focus facilitated by the analysis and use of the data:
- In Estonia and Finland, ACCORD focuses on improving accessibility and safety in urban spaces through the automation of building permits. In Estonia, work is being done on automatic verification of compliance with planning and zoning regulations, while in Finland, the focus is on developing healthy and safe urban spaces by digitising the permitting process and integrating urban data.
- In Germany, ACCORD focuses on automated verification for land use permits and green building certification. The project aims to automate the verification of regulatory compliance in these areas by integrating micro-services that automatically verify whether construction projects comply with sustainability and land use regulations before permits are issued.
- In the UK, ACCORD focuses on ensuring the design integrity of structural components of steel modular homes by using BIM modelling and finite element analysis (FEA). This approach allows automatic verification of the compliance of structural components with safety and design standards prior to their implementation in construction. The project facilitates the early detection of potential structural failures, thus improving safety and efficiency in the construction process.
- In Spain, ACCORD focuses on automating urban planning compliance in Malgrat de Martown council using BIM and open cadastral data. The aim is to improve efficiency in the design and construction phase, ensuring that projects comply with local regulations before they start. This includes automatic verification of urban regulations to facilitate faster and more accurate building permits.
CHEK
The CHEK Project (2022-2025) which stands for"Change Toolkit for Digital Building Permit" is a European initiative that aims to remove the barriers municipalities face in adopting the digitisation of building permit management processes.
CHEK will develop scalable solutions including open standards and interoperability (geospatial and BIM), educational tools to bridge knowledge gaps and new technologies for permit digitisation and automatic compliance verification. The objective is to align digital technologies with municipal-level administrative processing, improve accuracy and efficiency, and demonstrate scalability in European urban areas, achieving a tRL 7E technology maturity level.
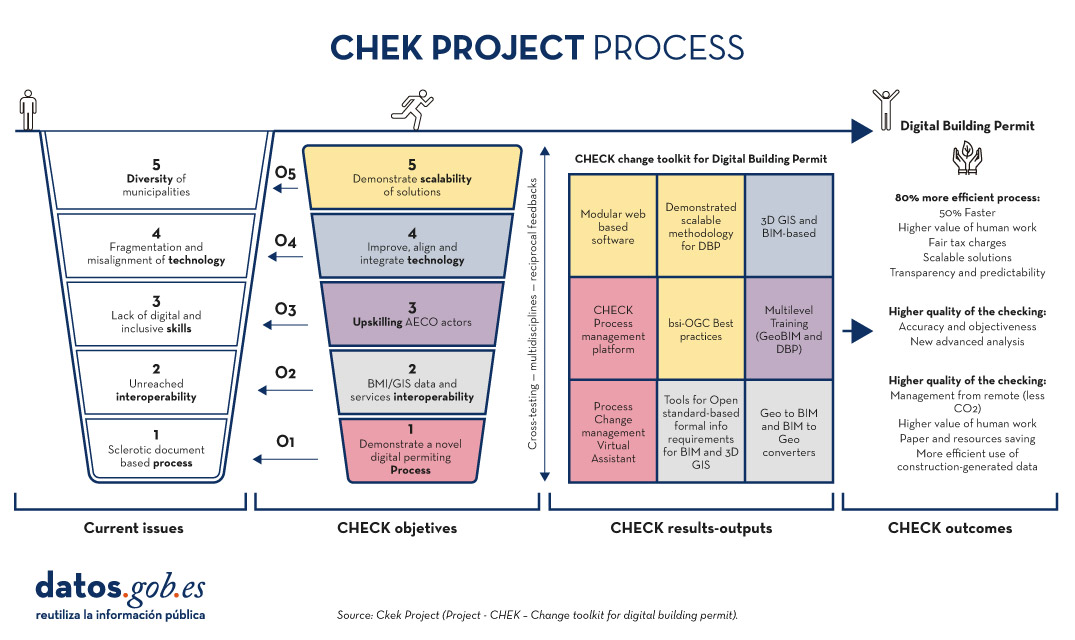
Figure 3. CHEK Project Process. Source: Proyecto CHEK.
This requires:
- Adapt available digital technologies to municipal processes, enabling new methods and business models.
- Develop open data standards, including building information modelling (BIM), 3D urban modelling and reciprocal integration (GeoBIM).
- Improve training for public employees and users.
- Improving, adapting and integrating technology.
- Realise and demonstrate scalability.
CHEK will provide a set of methodological and technological tools to fully digitise building permits and partially automate building design compliance checks, leading to a 60% efficiency improvement and the adoption of DBP by 85% of European municipalities.
The future of construction and the contribution to open data
The implementation of Digital Building Permits and Digital Building Logs is transforming the building landscape. As these tools are integrated into construction processes, future scenarios on the horizon include:
- Digitised construction: In the not too distant future, construction projects could be managed entirely digitally, from permit applications to ongoing project monitoring. This will eliminate the need for physical documents and significantly reduce errors and delays.
- Real-time digital cufflinks: Digital Building Logs will feed digital twins in real time, enabling continuous and predictive monitoring of projects. This will allow developers and regulators to anticipate problems before they occur and make informed decisions quickly.
- Global data interoperability: With the advancement of data spaces, building systems are expected to become globally interoperable. This will facilitate international collaboration and allow standards and best practices to be widely shared and adopted.
Digital Building Permits and Digital Building Logs are not only tools for process optimisation in the building sector, but also vehicles for the creation of open data that can be used by a wide range of actors. The implementation of these systems not only generates technical data on the progress of works, but also provides data that can be reused by authorities, developers and citizens, thus fostering an open collaborative environment. This data can be used to improve urban analysis, assist in public infrastructure planning and optimise monitoring and transparency in project implementation.
The use of open data through these platforms also facilitates the development of innovative applications and technological services that improve efficiency, promote sustainability and contribute to more efficient resource management in cities. Such open data can, for example, allow citizens to access information on building conditions in their area, while giving governments a clearer, real-time view of how projects are developing, enabling data-driven decision-making.
Projects such as ACCORD and CHECK demonstrate how these technologies can integrate digitalisation, automation and open data to transform the European construction sector.
Content prepared by Mayte Toscano, Senior Consultant in Data Economy Technologies. The contents and points of view reflected in this publication are the sole responsibility of its author.
Documentación
The digital revolution is transforming municipal services, driven by the increasing adoption of artificial intelligence (AI) technologies that also benefit from open data. These developments have the potential to redefine the way municipalities deliver services to their citizens, providing tools to improve efficiency, accessibility and sustainability. This report looks at success stories in the deployment of applications and platforms that seek to improve various aspects of life in municipalities, highlighting their potential to unlock more of the vast untapped potential of open data and associated artificial intelligence technologies.
The applications and platforms described in this report have a high potential for replicability in different municipal contexts, as they address common problems. Replication of these solutions can take place through collaboration between municipalities, companies and developers, as well as through the release and standardisation of open data.
Despite the benefits, the adoption of open data for municipal innovation also presents significant challenges. The quality, updating and standardisation of data published by local authorities, as well as interoperability between different platforms and systems, must be ensured. In addition, the open data culture needs to be reinforced among all actors involved, including citizens, developers, businesses and public administrations themselves.
The use cases analysed are divided into four sections. Each of these sections is described below and some examples of the solutions included in the report are shown.
Transport and Mobility
One of the most significant challenges in urban areas is transport and mobility management. Applications using open data have proven to be effective in improving these services. For example, applications such as Park4Dis make it easy to locate parking spaces for people with reduced mobility, using data from multiple municipalities and contributions from volunteers. CityMapper, which has gone global, on the other hand, offers optimised public transport routes in real time, integrating data from various transport modes to provide the most efficient route. These applications not only improve mobility, but also contribute to sustainability by reducing congestion and carbon emissions.
Environment and Sustainability
Growing awareness of sustainability has spurred the development of applications that promote environmentally friendly practices. CleanSpot, for example, facilitates the location of recycling points and the management of municipal waste. The application encourages citizen participation in cleaning and recycling, contributing to the reduction of the ecological footprint. Liight gamifies sustainable behaviour by rewarding users for actions such as recycling or using public transport. These applications not only improve environmental management, but also educate and motivate citizens to adopt more sustainable habits.
Optimisation of Basic Public Services
Urban service management platforms, such as Gestdropper, use open data to monitor and control urban infrastructure in real time. These tools enable more efficient management of resources such as street lighting, water networks and street furniture, optimising maintenance, incident response and reducing operating costs. Moreover, the deployment of appointment management systems, such as CitaME, helps to reduce waiting times and improve efficiency in customer service.
Citizen Services Aggregators
Applications that centralise public information and services, such as Badajoz Es Más and AppValencia, improve accessibility and communication between administrations and citizens. These platforms provide real-time data on public transport, cultural events, tourism and administrative procedures, making life in the municipality easier for residents and tourists alike. For example, integrating multiple services into a single application improves efficiency and reduces the need for unnecessary travel. These tools also support local economies by promoting cultural events and commercial services.
Conclusions
The use of open data and artificial intelligence technologies is transforming municipal management, improving the efficiency, accessibility and sustainability of public services. The success stories presented in this report describe how these tools can benefit both citizens and public administrations by making cities smarter, more inclusive and sustainable environments, and more responsive to the needs and well-being of their inhabitants and visitors.
To delve deeper into the report’s content, we’ve recorded a podcast and a video-interview in which the author explains the key points of this guide. We’ve also created an infographic and an executive summary.
Listen to the podcast (only available in spanish)
Watch the video-interview with the author