43 documents found
Technical guide: Data version control
Data possesses a fluid and complex nature: it changes, grows, and evolves constantly, displaying a volatility that profoundly differentiates it from source code. To respond to the challenge of reliably managing this evolution, we have developed the new 'Technical Guide: Data Version Control'.
This…
- Guides

A practical introductory guide to exploratory data analysis in Python
The following presents a new guide to Exploratory Data Analysis (EDA) implemented in Python, which evolves and complements the version published in R in 2021. This update responds to the needs of an increasingly diverse community in the field of data science.
Exploratory Data Analysis (EDA)…
- Guides

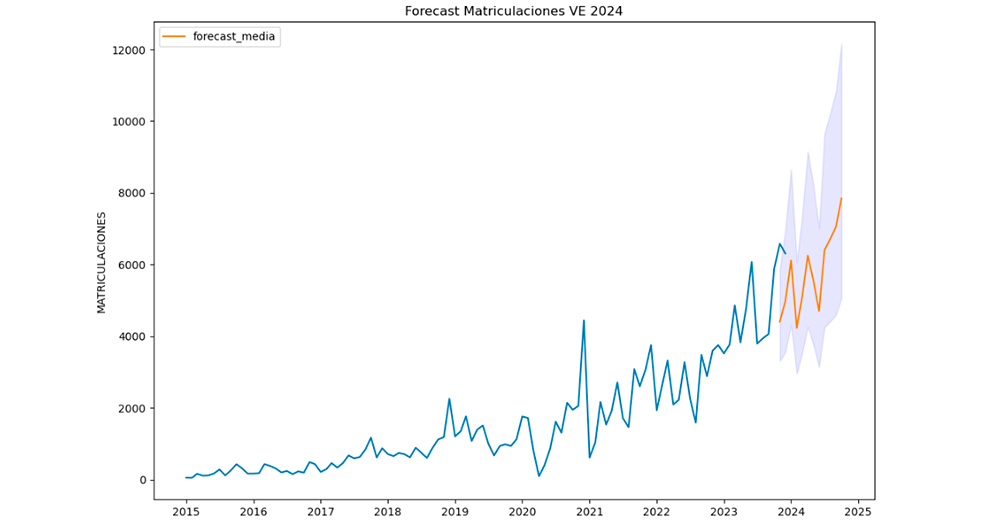
Road to electrification: Deciphering electric vehicle growth in Spain through data analytics
1. Introduction
Visualisations are graphical representations of data that allow to communicate, in a simple and effective way, the information linked to the data. The visualisation possibilities are very wide ranging, from basic representations such as line graphs, bar charts or relevant metrics,…
- Data exercises
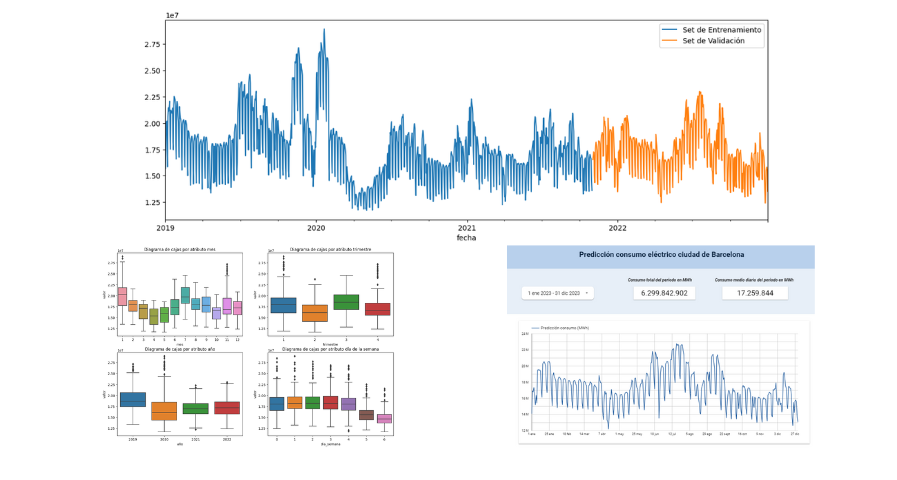
Predictive analisys of electric consuption in the city of Barcelona
1. Introduction
Visualizations are graphical representations of data that allow you to communicate, in a simple and effective way, the information linked to it. The visualization possibilities are very extensive, from basic representations such as line graphs, bar graphs or relevant metrics, to…
- Data exercises
Analysis of toxicological findings in road traffic accidents
1. Introduction
Visualizations are graphical representations of data that allows comunication in a simple and effective way the information linked to it. The visualization possibilities are very wide, from basic representations, such as a graph of lines, bars or sectors, to visualizations…
- Data exercises

Characteristics of the Spanish University students and most demanded degrees
1. Introduction
Visualizations are graphical representations of data that allow to transmit in a simple and effective way the information linked to them. The visualization potential is very wide, from basic representations, such as a graph of lines, bars or sectors, to visualizations configured on…
- Data exercises

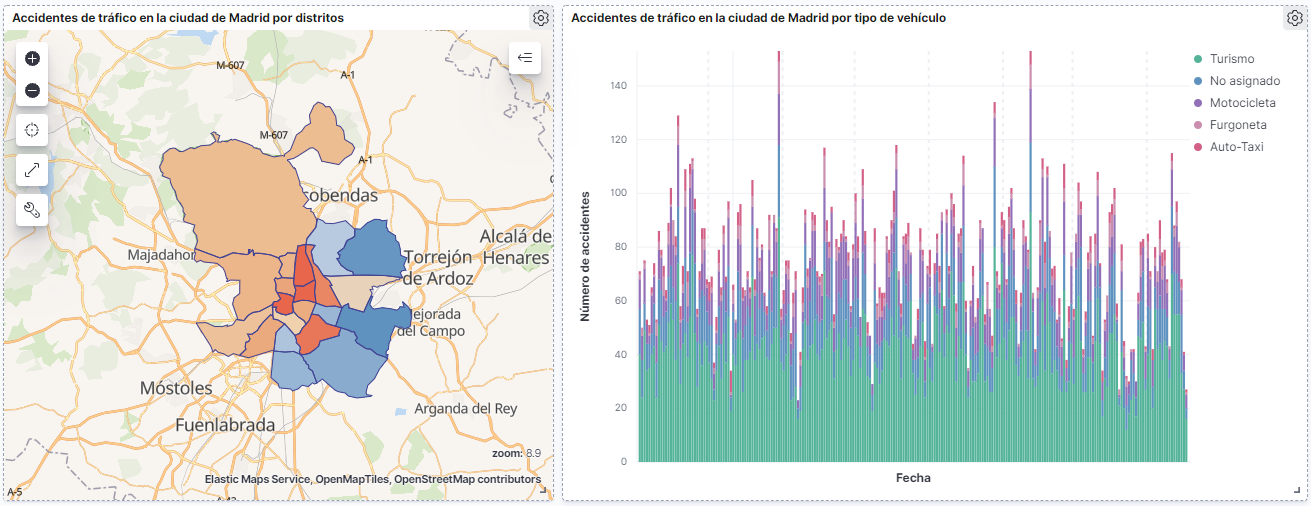
How many accidents occur in the city of Madrid?
1. Introduction
Data visualization is a task linked to data analysis that aims to graphically represent underlying data information. Visualizations play a fundamental role in the communication function that data possess, since they allow to drawn conclusions in a visual and understandable way,…
- Data exercises
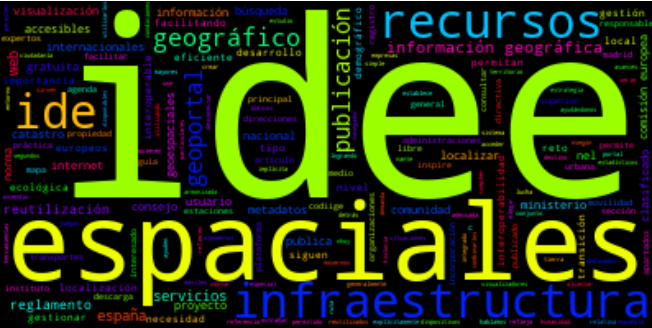
Creating word clouds from the text data with NLP techniques
1. Introduction
Visualizations are a graphic representation that allow us to comprehend in a simple way the information that the data contains. Thanks to visual elements, such as graphs, maps or word clouds, visualizations also help to explain trends, patterns, or outliers that data may present.…
- Data exercises
Help videos for data reusers in datos.gob.es
In a platform such as datos.gob.es, where the frequency of dataset updates is constant, it is necessary to have mechanisms that facilitate massive and automatic queries.
In datos.gob.es we have an API and a SPARQL point to facilitate this task. Both tools allow querying the metadata associated with…
- Guides

Help videos for data publishers on datos.gob.es
Open data publishers in the National Catalog hosted in datos.gob.es have at their disposal several internal functionalities to easily manage their datasets and everything related to them.
To bring these possibilities closer to the registered users, from datos.gob.es we have prepared a series of…
- Guides
