7 documents found
Municipal Innovation through Open Data: Solutions to make municipal services more accessible
The digital revolution is transforming municipal services, driven by the increasing adoption of artificial intelligence (AI) technologies that also benefit from open data. These developments have the potential to redefine the way municipalities deliver services to their citizens, providing tools to…
- Reports and studies
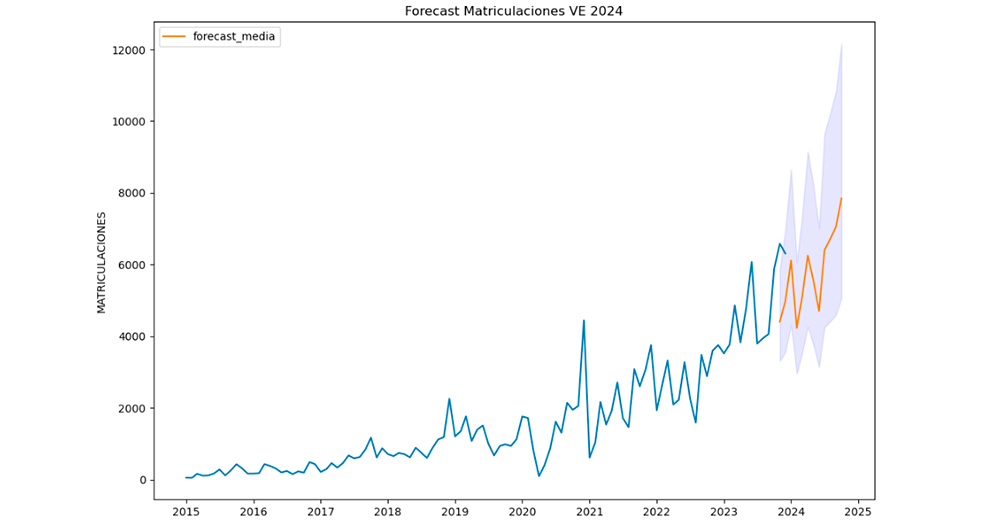
Road to electrification: Deciphering electric vehicle growth in Spain through data analytics
1. Introduction
Visualisations are graphical representations of data that allow to communicate, in a simple and effective way, the information linked to the data. The visualisation possibilities are very wide ranging, from basic representations such as line graphs, bar charts or relevant metrics,…
- Data exercises
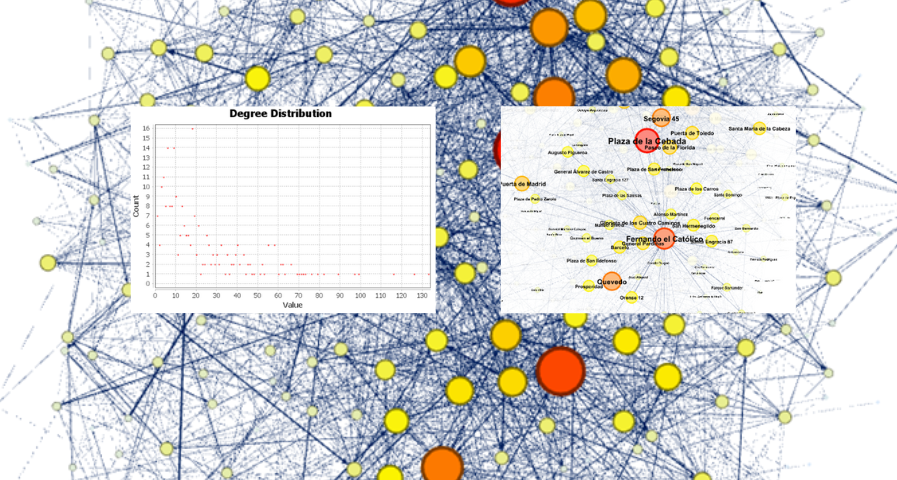
Analysis of travel networks in BICIMAD
1. Introduction
Visualizations are graphical representations of data that allow the information linked to them to be communicated in a simple and effective way. The visualization possibilities are very wide, from basic representations, such as line, bar or sector graphs, to visualizations…
- Data exercises
Datos en tiempo real: Enfoques para integrar fuentes de datos en tiempo real en data.europa.eu
Este informe, que publica el Portal de Datos Europeo, analiza el potencial de reutilización de los datos en tiempo real. Los datos en tiempo real ofrecen información con alta frecuencia de actualización sobre el entorno que nos rodea (por ejemplo, información sobre el tráfico, datos…
- Reports and studies
Tendencias geoespaciales 2022: Oportunidades para data.europa.eu a partir de las tendencias emergentes en la comunidad geoespacial
Este informe recoge varias temáticas relevantes para la comunidad europea de datos geoespaciales.
Por un lado, el capítulo dedicado a la "modernización INSPIRE y avance hacia los datos abiertos" trata la evaluación realizada por la Comisión Europea de la directiva INSPIRE y cómo ésta debe avanzar…
- Informes y estudios
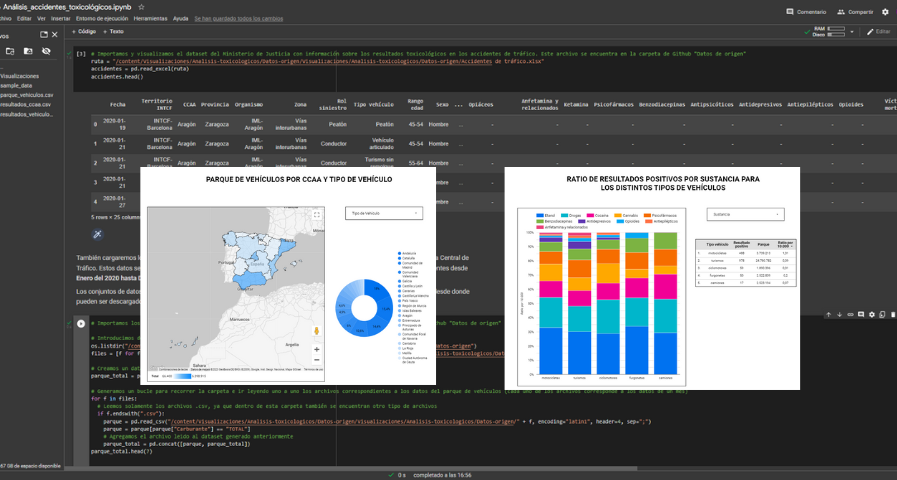
Analysis of toxicological findings in road traffic accidents
1. Introduction
Visualizations are graphical representations of data that allows comunication in a simple and effective way the information linked to it. The visualization possibilities are very wide, from basic representations, such as a graph of lines, bars or sectors, to visualizations…
- Data exercises
Copernicus data for the open data community
This report published by the European Data Portal (EDP) aims to help open data users in harnessing the potential of the data generated by the Copernicus program.
The Copernicus project generates high-value satellite data, generating a large amount of Earth observation data, this is in line…
- Reports and studies

