Blog
We live in an era where science is increasingly reliant on data. From urban planning to the climate transition, data governance has become a structural pillar of evidence-based decision-making. However, there is one area where the traditional principles of data management, validation and control are subjected to extreme tensions: the universe.
Space data—produced by scientific satellites, telescopes, interplanetary probes, and exploration missions— do not describe accessible or repeatable realities. They observe phenomena that occurred millions of years ago, at distances impossible to travel and under conditions that can never be replicated in the laboratory. There is no "in situ" measurement that directly confirms these phenomena.
In this context, data governance ceases to be an organizational issue and becomes a structural element of scientific trust. Quality, traceability and reproducibility cannot be supported by direct physical references, but by methodological transparency, comprehensive documentation and the robustness of instrumental and theoretical frameworks.
Governing data in the universe therefore involves facing unique challenges: managing structural uncertainty, documenting extreme scales, and ensuring trust in information we can never touch.
Below, we explore the main challenges posed by data governance when the object of study is beyond Earth.
I. Specific challenges of the datum of the universe
1. Beyond Earth: new sources, new rules
When we talk about space data, we mean much more than satellite images of the Earth's surface. We delve into a complex ecosystem that includes space and ground-based telescopes, interplanetary probes, planetary exploration missions, and observatories designed to detect radiation, particles, or extreme physical phenomena.
These systems generate data with clearly different challenges compared to other scientific domains:
| Challenge | Impact on data governance |
|---|---|
| Non-existent physical access | There is no direct validation; Trust lies in the integrity of the channel. |
| Instrumental dependence | The data is a direct "child" of the sensor's design. If the sensor fails or is out of calibration, reality is distorted. |
| Uniqueness | Many astronomical events are unique. There is no "second chance" to capture them. |
| Extreme cost | The value of each byte is very high due to the investment required to put the sensor into orbit |
Figure 1. Challenges in data governance across the universe. Source: own elaboration - datos.gob.es.
Unlike Earth observation data -which in many cases can be contrasted by field campaigns or redundant sensors -data from the universe depend fundamentally on the mission architecture, instrument calibration, and physical models used to interpret the captured signal.
In many cases, what is recorded is not the phenomenon itself, but an indirect signal: spectral variations, electromagnetic emissions, gravitational alterations or particles detected after traveling millions of kilometers. The data is, in essence, an instrumental translation of an inaccessible phenomenon.
For all these reasons, in space data cannot be understood without the technical context that generates it.
2. Structural uncertainty and extreme scales
Uncertainty refers to the degree of margin of error or indeterminacy associated with a scientific measurement, interpretation, or result due to the limits of the instruments, observing conditions, and models used to analyze the data. If in other areas uncertainty is a factor that is tried to be reduced by direct, repeatable and verifiable measurements, in the observation of the universe uncertainty is part of the knowledge process itself. It is not simply a matter of "not knowing enough", but of facing physical and methodological limits that cannot be completely eliminated.
Therefore, in the observation of the universe, uncertainty is structural. It is not a specific anomaly, but a condition inherent to the object of study.
There are several critical dimensions:
- Extreme spatial and temporal scales: cosmic distances prevent any direct validation. Timescales imply that the data often captures an "instant" of the remote past and not a verifiable present reality.
- Weak signals and unavoidable noise: the instruments capture extremely subtle emissions. The useful signal coexists with interference, technological limitations and background noise. Interpretation depends on advanced statistical treatments and complex physical models.
- Limited-observation phenomena: Some astrophysical phenomena—such as certain supernovae, gamma-ray bursts, or singular gravitational configurations—cannot be experimentally recreated and can only be observed when they occur. In these cases, the available record may be unique or profoundly limited, increasing the responsibility for documentation and preservation.
Not all phenomena are unrepeatable, but in many cases the opportunities for observation are scarce or depend on exceptional conditions.
II. Building trust when we can't touch the object observed
In the face of these challenges, data governance takes on a structural role. It is not limited to guaranteeing storage or availability, but defines the rules by which scientific processes are documented, traceable and auditable.
In this context, governing does not mean producing knowledge, but rather ensuring that its production is transparent, verifiable and reusable.
1. Quality without direct physical validation
When the observed phenomenon cannot be directly verified, the quality of the data is based on:
- Rigorous calibration protocols: instruments must undergo systematic calibration processes before, during, and after operation. This involves adjusting your measurements against known baselines, characterizing your margins of error, documenting deviations, and recording any modifications to your configuration. Calibration is not a one-off event, but an ongoing process that ensures that the recorded signal reflects, as accurately as possible, the observed phenomenon within the physical boundaries of the system.
- Cross-validation between independent instruments: when different instruments – either on the same mission or on different missions – observe a similar phenomenon, the comparison of results allows the reliability of the data to be reinforced. The convergence between observations obtained with different technologies reduces the probability of instrumental bias or systematic errors. This inter-instrumental coherence acts as an indirect verification mechanism.
- Observational repetition when possible: although not all phenomena can be repeated, many observations can be made at different times or under different conditions. Repetition allows to evaluate the stability of the signal, identify anomalies and estimate natural variability against measurement error. Consistency over time strengthens the robustness of the result.
- Peer review and progressive scientific consensus: the data and their interpretations are subject to evaluation by the scientific community. This process involves methodological scrutiny, critical analysis of assumptions, and verification of consistency with existing knowledge. Consensus does not emerge immediately, but through the accumulation of evidence and scientific debate. Quality, in this sense, is also a collective construction.
Quality is not just a technical property; it is the result of a documented and auditable process.
2. Complete scientific traceability
In the spatial context, data is inseparable from the technical and scientific process that generates it. It cannot be understood as an isolated result, but as the culmination of a chain of instrumental, methodological and analytical decisions.
Therefore, traceability must explicitly and documented:
- Instrument design and configuration: information about the technical characteristics of the instrument that captured the signal, such as its architecture, sensing capabilities, resolution limits, and operational configurations, needs to be retained. These conditions determine what type of signal can be recorded and how accurately.
- Calibration parameters: The adjustments applied to ensure that the instrument operates within the intended margins must be recorded, as well as the modifications made over time. The calibration parameters directly influence the interpretation of the obtained signal.
- Processing software versions: the processing of raw data depends on specific IT tools. Preserving the versions used allows you to understand how the results were generated and avoid ambiguities if the software evolves.
- Algorithms applied in noise reduction: since signals are often accompanied by interference or background noise, it is essential to document the methods used to filter, clean, or transform the information before analysis. These algorithms influence the final result.
- Scientific assumptions used in the interpretation: the reading of the data is not neutral: it is based on theoretical frameworks and physical models accepted at the time of analysis. Recording these assumptions allows you to contextualize the conclusions and understand possible future revisions.
- Successive transformations from the raw data to the published data: from the original signal to the final scientific product, the data goes through different phases of processing, aggregation and analysis. Each transformation must be able to be reconstructed to understand how the communicated result was reached.
Without exhaustive traceability, reproducibility is weakened and future interpretability is compromised. When it is not possible to reconstruct the entire process that led to a result, its independent evaluation becomes limited and its scientific reuse loses its robustness.
3. Long-term reproducibility
Space missions can span decades, and their data can remain relevant long after the mission has ended. In addition, scientific interpretation evolves over time: new models, new tools, and new questions may require reanalyzing information generated years ago.
Therefore, data must remain interpretable even when the original equipment no longer exists, technological systems have changed, or the scientific context has evolved.
This requires:
- Rich and structured metadata: the contextual information that accompanies the data – about its origin, acquisition conditions, processing and limitations – must be organized in a clear and standardized way. Without sufficient metadata, the data loses meaning and becomes difficult to reinterpret in the future.
- Persistent identifiers: Each dataset must be able to be located and cited in a stable manner over time. Persistent identifiers allow the reference to be maintained even if storage systems or technology infrastructures change.
- Robust digital preservation policies: Long-term preservation requires strategies that take into account format obsolescence, technological migration, and archive integrity. It is not enough to store; It is necessary to ensure that the data remains accessible and readable over time.
- Accessible documentation of processing pipelines: the process that transforms raw data into scientific product must be described in a comprehensible way. This allows future researchers to reconstruct the analysis, verify the results, or apply new methods on the same original data.
Reproducibility, in this context, does not mean physically repeating the observed phenomenon, but being able to reconstruct the analytical process that led to a given result. Governance doesn't just manage the present; It ensures the future reuse of knowledge and preserves the ability to reinterpret information in the light of new scientific advances.
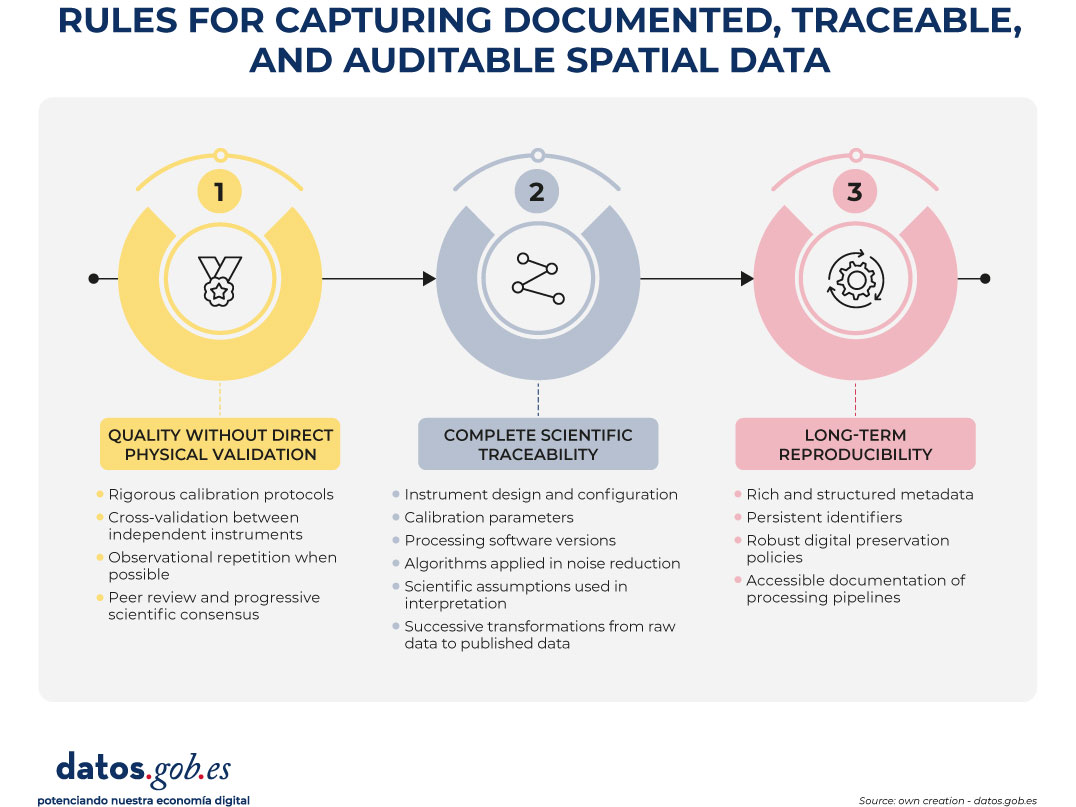
Figure 2. Rules for capturing documented, traceable, and auditable spatial data. Source: own elaboration - datos.gob.es.
Conclusion: Governing What We Can't Touch
The data of the universe forces us to rethink how we understand and manage information. We are working with realities that we cannot visit, touch or verify directly. We observe phenomena that occur at immense distances and in times that exceed the human scale, through highly specialized instruments that translate complex signals into interpretable data.
In this context, uncertainty is not a mistake or a weakness, but a natural feature of the study of the cosmos. The interpretation of data depends on scientific models that evolve over time, and quality is not based on direct verification, but on rigorous processes, well documented and reviewed by the scientific community. Trust, therefore, does not arise from direct experience, but from the transparency, traceability and clarity with which the methods used are explained.
Governing spatial data does not only mean storing it or making it available to the public. It means keeping all the information that allows us to understand how they were obtained, how they were processed and under what assumptions they were interpreted. Only then can they be evaluated, reinterpreted and reused in the future.
Beyond Earth, data governance is not a technical detail or an administrative task. It is the foundation that sustains the credibility of human knowledge about the universe and the basis that allows new generations to continue exploring what we cannot yet achieve physically.
Content prepared by Mayte Toscano, Senior Consultant in technologies related to the data economy. The contents and viewpoints expressed in this publication are the sole responsibility of the author.
Blog
In 2010, following the devastating earthquake in Haiti, hundreds of humanitarian organizations arrived in the country ready to help. They encountered an unexpected obstacle: there were no updated maps. Without reliable geographic information, coordinating resources, locating isolated communities, or planning safe routes was nearly impossible.
That gap marked a turning point: it was the moment when the global OpenStreetMap (OSM) community demonstrated its enormous humanitarian potential. More than 600 volunteers from all over the world organized themselves and began mapping Haiti in record time. This gave impetus to the Humanitarian OpenStreetMap Team project.
What is Humanitarian OpenStreetMap Team?
Humanitarian OpenStreetMap Team, known by the acronym HOT, is an international non-profit organization dedicated to improving people's lives through accurate and accessible geographic data. Their work is inspired by the principles of OSM, the collaborative project that seeks to create an open, free and editable digital map for anyone.
The difference with OSM is that HOT is specifically aimed at contexts where the lack of data directly affects people's lives: it is about providing data and tools that allow more informed decisions to be made in critical situations. That is, it applies the principles of open software and data to collaborative mapping with social and humanitarian impact.
In this sense, the HOT team not only produces maps, but also facilitates technical capacities and promotes new ways of working tools, the for different actors who need precise spatial data. Their work ranges from immediate response when a disaster strikes to structural programs that strengthen local resilience to challenges such as climate change or urban sprawl.
Four priority geographical areas
While HOT is not limited to a single country or region, it has established priority areas where its mapping efforts have the greatest impact due to significant data gaps or urgent humanitarian needs. It currently works in more than 90 countries and organizes its activities through four Open Mapping Hubs (regional centers) that coordinate initiatives according to local needs:
- Asia-Pacific: challenges range from frequent natural disasters (such as typhoons and earthquakes) to access to remote rural areas with poor map coverage.
- Eastern and Southern Africa: this region faces multiple intertwined crises (droughts, migratory movements, deficiencies in basic infrastructure) so having up-to-date maps is key for health planning, resource management and emergency response.
- West Africa and North Africa: in this area, HOT promotes activities that combine local capacity building with technological projects, promoting the active participation of communities in the creation of useful maps for their environment.
- Latin America and the Caribbean: frequently affected by hurricanes, earthquakes, and volcanic hazards, this region has seen a growing adoption of collaborative mapping in both emergency response and urban development and climate resilience initiatives.
The choice of these priority areas is not arbitrary: it responds to contexts in which the lack of open data can limit rapid and effective responses, as well as the ability of governments and communities to plan their future with reliable information.
Open source tools developed by HOT
An essential part of HOT's impact lies in the open-source tools and platforms that facilitate collaborative mapping and the use of spatial data in real-world scenarios. To this end, an E2E Value Chain Mapping was developed, which is the core methodology that enables communities to move from image capture and mapping to impact. This value chain supports all of its programs, ensuring that mapping is a transformative process based on open data, education, and community empowerment.
These tools not only support HOT's work, but are available for anyone or community to use, adapt, or expand. Specifically, tools have been developed to create, access, manage, analyse and share open map data. You can explore them in the Learning Center, a training space that offers capacity building, skills strengthening and an accreditation process for interested individuals and organisations. These tools are described below:
It allows drone flights to be planned for up-to-date, high-resolution aerial imagery, which is critical when commercial imagery is too expensive. In this way, anyone with access to a drone – including low-cost and commonly used models – can contribute to a global repository of free and open imagery, democratizing access to geospatial data critical to disaster response, community resilience, and local planning.
The platform coordinates multiple operators and generates automated flight plans to cover areas of interest, making it easy to capture 2D and 3D images accurately and efficiently. In addition, it includes training plans and promotes safety and compliance with local regulations, supporting project management, data visualization and collaborative exchange between pilots and organizations.
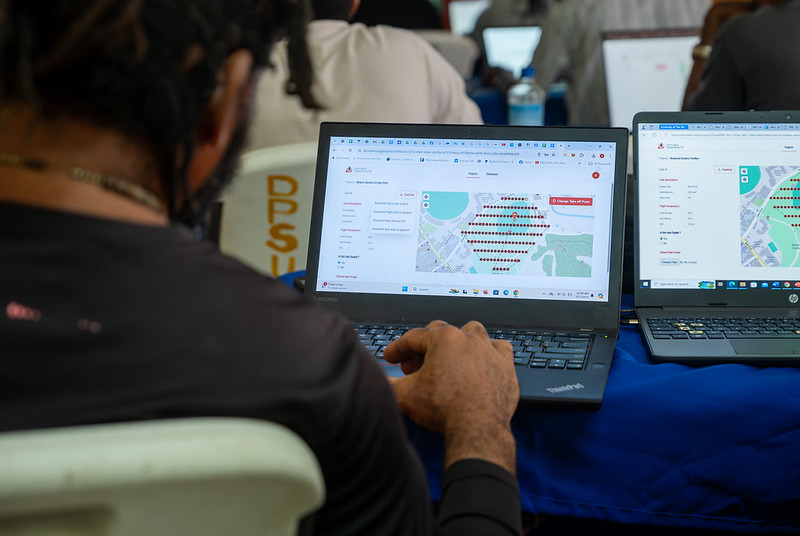
Figure 1. Drone Tasking Manager (DroneTM) screenshot. Source: Humanitarian OpenStreetMap Team (HOT).
It is an open-source platform that offers access to a community library of openly-licensed aerial imagery, obtained from satellites, drones, or other aircraft. It has a simple interface where you can zoom in on a map to search for available images. OAM allows you to both download and contribute new imagery, thus expanding a global repository of visual data that anyone can use and plot in OpenStreetMap.
All imagery hosted on OpenAerialMap is licensed under CC-BY 4.0, which means that they are publicly accessible and can be reused with attribution, facilitating their integration into geospatial analysis applications, emergency response projects, or local planning initiatives. OAM relies on the Open Imagery Network (OIN) to structure and serve these images.
It facilitates collaborative mapping in OpenStreetMap. Its main purpose is to coordinate thousands of volunteers from all over the world to aggregate geographic data in an organized and efficient way. To do this, it breaks down a large mapping project into small "tasks" that can be completed quickly by people working remotely.
The way it works is simple: projects are subdivided into grids, each assignable to a volunteer in order to map out elements such as streets, buildings, or points of interest in OSM. Each task is validated by experienced mappers to ensure data quality. The platform clearly shows which areas still need mapping or review, avoiding duplication and improving the efficiency of collaborative work.

Figure 2. Tasking Manager screenshot. Source: Humanitarian OpenStreetMap Team (HOT).
It uses artificial intelligence to assist the mapping process in OpenStreetMap for humanitarian purposes. Through computer vision models, fAIr analyzes satellite or aerial images and suggests the detection of geographical elements such as buildings, roads, watercourses or vegetation from free images such as those of OpenAerialMap. The idea is that volunteers can use these predictions as an aid to map faster and more accurately, without performing automated mass imports, always integrating human judgment into the validation of each element.
One of the most outstanding features of fAIr is that the creation and training of AI models is in the hands of the mapping communities themselves: users can generate their own training sets adjusted to their region or context, which helps reduce biases of standard models and makes predictions more relevant to local needs.
It is a mobile and web application that facilitates the coordination of mapping campaigns directly in the field. Field-TM is used in conjunction with OpenDataKit (ODK), a data collection platform on Android that allows information to be entered in the field using mobile devices themselves. Thanks to it, volunteers can enter geospatial information verified by local observation, such as the purpose of each building (whether it is a store, a hospital, etc.).
The app provides an interface to assign tasks, track progress, and ensure data consistency. Its main purpose is to improve the efficiency, organization and quality of fieldwork by enriching it with local information, as well as to reduce duplications, avoid uncovered areas and allow clear monitoring of the progress of each collaborator in a mapping campaign.
Transform conversations from instant messaging apps (like WhatsApp) into interactive maps. In many communities, especially in disaster-prone or low-tech literacy areas, people are already using chat apps to communicate and share their location. ChatMap leverages those exported messages, extracts location data along with texts, photos, and videos, and automatically renders them on a map, without the need for complex installations or advanced technical knowledge.
This solution works even in conditions of limited or offline connectivity, relying on the phone's GPS signal to record locations and store them until the information can be uploaded.

Figure 3. ChatMap screenshot. Source: OpenStreetMap Humanitarian Team (HOT).
Facilitate access to and download of up-to-date geospatial data from OpenStreetMap in useful formats for analysis and projects. Through this web platform, you can select an area of interest on the map, choose what data you want (such as roads, buildings, or services), and download that data in multiple formats, such as GeoJSON, Shapefile, GeoPackage, KML, or CSV. This allows the information to be used in GIS (Geographic Information Systems) software or integrated directly into custom applications. You can also export all the data for a zone or download data associated with a specific project from the Tasking Manager.
The tool is designed to be accessible to both technical analysts and non-GIS experts: in a matter of minutes, custom OSM extracts can be generated without the need to install specialized software. It also offers an API and data quality metrics.
It is an open-source interactive map creation platform that allows anyone to easily visualize, customize, and share geospatial data. Based on OpenStreetMap maps, uMap allows you to add custom layers, markers, lines and polygons, manage colors and icons, import data in common formats (such as GeoJSON, GPX or KML) and choose licenses for the data, without the need to install specialized software. The maps created can be embedded in websites or shared using links.
The tool offers templates and integration options with other HOT tools, such as ChatMap and OpenAerialMap, to enrich the data on the map.
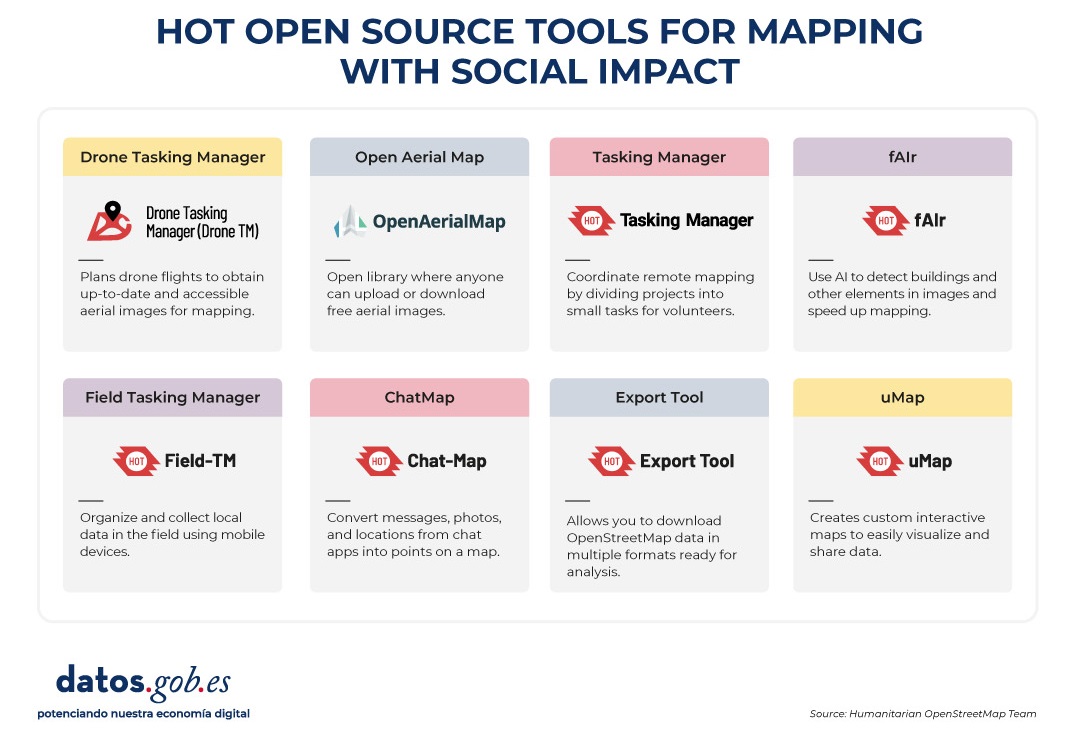
Figure 4. HOT open source tools for mapping with social impact. Source: Humanitarian OpenStreetMap Team (HOT).
All of these tools are available to local communities around the world. HOT also offers training to promote its use and improve the impact of open data in humanitarian responses.
How can you join HOT's impact?
HOT is built alongside a global community that drives the use of open data to strengthen decision-making and save lives. If you represent an organization, university, collective, public agency, or community initiative and have a project idea or interest in an alliance, the HOT team is open to exploring collaborations. You can write to partnerships@hotosm.org.
When communities have access to accurate data, open tools, and the knowledge to generate geospatial information on an ongoing basis, they become informed agents, ready to make decisions in any situation. They are better equipped to identify climate risks, respond to emergencies, solve local problems, and mobilize support. Open mapping, therefore, does not only represent territories: it empowers people to transform their reality with data that can save lives.
Blog
Cities, infrastructures and the environment today generate a constant flow of data from sensors, transport networks, weather stations and Internet of Things (IoT) platforms, understood as networks of physical devices (digital traffic lights, air quality sensors, etc.) capable of measuring and transmitting information through digital systems. This growing volume of information makes it possible to improve the provision of public services, anticipate emergencies, plan the territory and respond to challenges associated with climate, mobility or resource management.
The increase in connected sources has transformed the nature of geospatial data. In contrast to traditional sets – updated periodically and oriented towards reference cartography or administrative inventories – dynamic data incorporate the temporal dimension as a structural component. An observation of air quality, a level of traffic occupancy or a hydrological measurement not only describes a phenomenon, but also places it at a specific time. The combination of space and time makes these observations fundamental elements for operating systems, predictive models and analyses based on time series.
In the field of open data, this type of information poses both opportunities and specific requirements. Opportunities include the possibility of building reusable digital services, facilitating near-real-time monitoring of urban and environmental phenomena, and fostering a reuse ecosystem based on continuous flows of interoperable data. The availability of up-to-date data also increases the capacity for evaluation and auditing of public policies, by allowing decisions to be contrasted with recent observations.
However, the opening of geospatial data in real time requires solving problems derived from technological heterogeneity. Sensor networks use different protocols, data models, and formats; the sources generate high volumes of observations with high frequency; and the absence of common semantic structures makes it difficult to cross-reference data between domains such as mobility, environment, energy or hydrology. In order for this data to be published and reused consistently, an interoperability framework is needed that standardizes the description of observed phenomena, the structure of time series, and access interfaces.
The open standards of the Open Geospatial Consortium (OGC) provide that framework. They define how to represent observations, dynamic entities, multitemporal coverages or sensor systems; establish APIs based on web principles that facilitate the consultation of open data; and allow different platforms to exchange information without the need for specific integrations. Its adoption reduces technological fragmentation, improves coherence between sources and favours the creation of public services based on up-to-date data.
Interoperability: The basic requirement for opening dynamic data
Public administrations today manage data generated by sensors of different types, heterogeneous platforms, different suppliers and systems that evolve independently. The publication of geospatial data in real time requires interoperability that allows information from multiple sources to be integrated, processed and reused. This diversity causes inconsistencies in formats, structures, vocabularies and protocols, which makes it difficult to open the data and reuse it by third parties. Let's see which aspects of interoperability are affected:
- Technical interoperability: refers to the ability of systems to exchange data using compatible interfaces, formats and models. In real-time data, this exchange requires mechanisms that allow for fast queries, frequent updates, and stable data structures. Without these elements, each flow would rely on ad hoc integrations, increasing complexity and reducing reusability.
- The Semantic interoperability: Dynamic data describe phenomena that change over short periods – traffic levels, weather parameters, flows, atmospheric emissions – and must be interpreted consistently. This implies having observation models, Vocabularies and common definitions that allow different applications to understand the meaning of each measurement and its units, capture conditions or constraints. Without this semantic layer, the opening of data in real time generates ambiguity and limits its integration with data from other domains.
- Structural interoperability: Real-time data streams tend to be continuous and voluminous, making it necessary to represent them as time series or sets of observations with consistent attributes. The absence of standardized structures complicates the publication of complete data, fragments information and prevents efficient queries. To provide open access to these data, it is necessary to adopt models that adequately represent the relationship between observed phenomenon, time of observation, associated geometry and measurement conditions.
- Interoperability in access via API: it is an essential condition for open data. APIs must be stable, documented, and based on public specifications that allow for reproducible queries. In the case of dynamic data, this layer guarantees that the flows can be consumed by external applications, analysis platforms, mapping tools or monitoring systems that operate in contexts other than the one that generates the data. Without interoperable APIs, real-time data is limited to internal uses.
Together, these levels of interoperability determine whether dynamic geospatial data can be published as open data without creating technical barriers.
OGC Standards for Publishing Real-Time Geospatial Data
The publication of georeferenced data in real time requires mechanisms that allow any user – administration, company, citizens or research community – to access them easily, with open formats and through stable interfaces. The Open Geospatial Consortium (OGC) develops a set of standards that enable exactly this: to describe, organize and expose spatial data in an interoperable and accessible way, which contributes to the openness of dynamic data.
What is OGC and why are its standards relevant?
The OGC is an international organization that defines common rules so that different systems can understand, exchange and use geospatial data without depending on specific technologies. These rules are published as open standards, which means that any person or institution can use them. In the realm of real-time data, these standards make it possible to:
- Represent what a sensor measures (e.g., temperature or traffic).
- Indicate where and when the observation was made.
- Structure time series.
- Expose data through open APIs.
- Connect IoT devices and networks with public platforms.
Together, this ecosystem of standards allows geospatial data – including data generated in real time – to be published and reused following a consistent framework. Each standard covers a specific part of the data cycle: from the definition of observations and sensors, to the way data is exposed using open APIs or web services. This modular organization makes it easier for administrations and organizations to select the components they need, avoiding technological dependencies and ensuring that data can be integrated between different platforms.
The OGC API family: Modern APIs for accessing open data
Within OGC, the newest line is family OGC API, a set of modern web interfaces designed to facilitate access to geospatial data using URLs and formats such as JSON or GeoJSON, common in the open data ecosystem.
Estas API permiten:
- Get only the part of the data that matters.
- Perform spatial searches ("give me only what's in this area").
- Access up-to-date data without the need for specialized software.
- Easily integrate them into web or mobile applications.
In this report: "How to use OGC APIs to boost geospatial data interoperability", we already told you about some of the most popular OGP APIs. While the report focuses on how to use OGC APIs for practical interoperability, this post expands the focus by explaining the underlying OGC data models—such as O&M, SensorML, or Moving Features—that underpin that interoperability.
On this basis, this post focuses on the standards that make this fluid exchange of information possible, especially in open data and real-time contexts. The most important standards in the context of real-time open data are:
|
OGC Standard |
What it allows you to do |
Primary use in open data |
|---|---|---|
|
OGC API – Features |
Query features with geometry; filter by time or space; get data in JSON/GeoJSON. |
Open publication of dynamic mobility data, urban inventories, static sensors. |
|
OGC API – Environmental Data Retrieval (EDR) |
Request environmental observations at a point, zone or time interval. |
Open data on meteorology, climate, air quality or hydrology. |
|
OGC SensorThings API |
Manage sensors and their time series; transmit large volumes of IoT data. |
Publication of urban sensors (air, noise, water, energy) in real time. |
|
OGC API – Connected Systems |
Describe networks of sensors, devices and associated infrastructures. |
Document the structure of municipal IoT systems as open data. |
|
OGC Moving Features |
Represent moving objects using space-time trajectories. |
Open mobility data (vehicles, transport, boats). |
|
WMS-T |
View maps that change over time. |
Publication of multi-temporal weather or environmental maps. |
Table 1. OGC Standards Relevant to Real-Time Geospatial Data
Models that structure observations and dynamic data
In addition to APIs, OGC defines several conceptual data models that allow you to consistently describe observations, sensors, and phenomena that change over time:
- O&M (Observations & Measurements): A model that defines the essential elements of an observation—measured phenomenon, instant, unity, and result—and serves as the semantic basis for sensor and time series data.
- SensorML: Language that describes the technical and operational characteristics of a sensor, including its location, calibration, and observation process.
- Moving Features: A model that allows mobile objects to be represented by means of space-time trajectories (such as vehicles, boats or fauna).
These models make it easy for different data sources to be interpreted uniformly and combined in analytics and applications.
The value of these standards for open data
Using OGC standards makes it easier to open dynamic data because:
- It provides common models that reduce heterogeneity between sources.
- It facilitates integration between domains (mobility, climate, hydrology).
- Avoid dependencies on proprietary technology.
- It allows the data to be reused in analytics, applications, or public services.
- Improves transparency by documenting sensors, methods, and frequencies.
- It ensures that data can be consumed directly by common tools.
Together, they form a conceptual and technical infrastructure that allows real-time geospatial data to be published as open data, without the need to develop system-specific solutions.
Real-time open geospatial data use cases
Real-time georeferenced data is already published as open data in different sectoral areas. These examples show how different administrations and bodies apply open standards and APIs to make dynamic data related to mobility, environment, hydrology and meteorology available to the public.
Below are several domains where Public Administrations already publish dynamic geospatial data using OGC standards.
Mobility and transport
Mobility systems generate data continuously: availability of shared vehicles, positions in near real-time, sensors for crossing in cycle lanes, traffic gauging or traffic light intersection status. These observations rely on distributed sensors and require data models capable of representing rapid variations in space and time.
OGC standards play a central role in this area. In particular, the OGC SensorThings API allows you to structure and publish observations from urban sensors using a uniform model – including devices, measurements, time series and relationships between them – accessible through an open API. This makes it easier for different operators and municipalities to publish mobility data in an interoperable way, reducing fragmentation between platforms.
The use of OGC standards in mobility not only guarantees technical compatibility, but also makes it possible for this data to be reused together with environmental, cartographic or climate information, generating multi-thematic analyses for urban planning, sustainability or operational transport management.
Example:
The open service of Toronto Bike Share, which publishes in SensorThings API format the status of its bike stations and vehicle availability.
Here each station is a sensor and each observation indicates the number of bicycles available at a specific time. This approach allows analysts, developers or researchers to integrate this data directly into urban mobility models, demand prediction systems or citizen dashboards without the need for specific adaptations.
Air quality, noise and urban sensors
Networks for monitoring air quality, noise or urban environmental conditions depend on automatic sensors that record measurements every few minutes. In order for this data to be integrated into analytics systems and published as open data, consistent models and APIs need to be available.
In this context, services based on OGC standards make it possible to publish data from fixed stations or distributed sensors in an interoperable way. Although many administrations use traditional interfaces such as OGC WMS to serve this data, the underlying structure is usually supported by observation models derived from the Observations & Measurements (O&M) family, which defines how to represent a measured phenomenon, its unit and the moment of observation.
Example:
The service Defra UK-AIR Sensor Observation Service provides access to near-real-time air quality measurement data from on-site stations in the UK.
The combination of O&M for data structure and open APIs for publication makes it easier for these urban sensors to be part of broader ecosystems that integrate mobility, meteorology or energy, enabling advanced urban analyses or environmental dashboards in near real-time.
Water cycle, hydrology and risk management
Hydrological systems generate crucial data for risk management: river levels and flows, rainfall, soil moisture or information from hydrometeorological stations. Interoperability is especially important in this domain, as this data is combined with hydraulic models, weather forecasting, and flood zone mapping.
To facilitate open access to time series and hydrological observations, several agencies use OGC API – Environmental Data Retrieval (EDR), an API designed to retrieve environmental data using simple queries at points, areas, or time intervals.
Example:
The USGS (United States Geological Survey), which documents the use of OGC API – EDR to access precipitation, temperature, or hydrological variable series.
This case shows how EDR allows you to request specific observations by location or date, returning only the values needed for analysis. While the USGS's specific hydrology data is served through its proprietary API, this case demonstrates how EDR fits into the hydrometeorological data structure and how it is applied in real operational flows.
The use of OGC standards in this area allows dynamic hydrological data to be integrated with flood zones, orthoimages or climate models, creating a solid basis for early warning systems, hydraulic planning and risk assessment.
Weather observation and forecasting
Meteorology is one of the domains with the highest production of dynamic data: automatic stations, radars, numerical prediction models, satellite observations and high-frequency atmospheric products. To publish this information as open data, the OGC API family is becoming a key element, especially through OGC API – EDR, which allows observations or predictions to be retrieved in specific locations and at different time levels.
Example:
The service NOAA OGC API – EDR, which provides access to weather data and atmospheric variables from the National Weather Service (United States).
This API allows data to be consulted at points, areas or trajectories, facilitating the integration of meteorological observations into external applications, models or services based on open data.
The use of OGC API in meteorology allows data from sensors, models, and satellites to be consumed through a unified interface, making it easy to reuse for forecasting, atmospheric analysis, decision support systems, and climate applications.
Best Practices for Publishing Open Geospatial Data in Real-Time
The publication of dynamic geospatial data requires adopting practices that ensure its accessibility, interoperability, and sustainability. Unlike static data, real-time streams have additional requirements related to the quality of observations, API stability, and documentation of the update process. Here are some best practices for governments and organizations that manage this type of data.
- Stable open formats and APIs: The use of OGC standards – such as OGC API, SensorThings API or EDR – makes it easy for data to be consumed from multiple tools without the need for specific adaptations. APIs must be stable over time, offer well-defined versions, and avoid dependencies on proprietary technologies. For raster data or dynamic models, OGC services such as WMS, WMTS, or WCS are still suitable for visualization and programmatic access.
- DCAT-AP and OGC Models Compliant Metadata: Catalog interoperability requires describing datasets using profiles such as DCAT-AP, supplemented by O&M-based geospatial and observational metadata or SensorML. This metadata should document the nature of the sensor, the unit of measurement, the sampling rate, and possible limitations of the data.
- Quality, update frequency and traceability policies: dynamic datasets must explicitly indicate their update frequency, the origin of the observations, the validation mechanisms applied and the conditions under which they were generated. Traceability is essential for third parties to correctly interpret data, reproduce analyses and integrate observations from different sources.
- Documentation, usage limits, and service sustainability: Documentation should include usage examples, query parameters, response structure, and recommendations for managing data volume. It is important to set reasonable query limits to ensure the stability of the service and ensure that management can maintain the API over the long term.
- Licensing aspects for dynamic data: The license must be explicit and compatible with reuse, such as CC BY 4.0 or CC0. This allows dynamic data to be integrated into third-party services, mobile applications, predictive models or services of public interest without unnecessary restrictions. Consistency in the license also facilitates the cross-referencing of data from different sources.
These practices allow dynamic data to be published in a way that is reliable, accessible, and useful to the entire reuse community.
Dynamic geospatial data has become a structural piece for understanding urban, environmental and climatic phenomena. Its publication through open standards allows this information to be integrated into public services, technical analyses and reusable applications without the need for additional development. The convergence of observation models, OGC APIs, and best practices in metadata and licensing provides a stable framework for administrations and reusers to work with sensor data reliably. Consolidating this approach will allow progress towards a more coherent, connected public data ecosystem that is prepared for increasingly demanding uses in mobility, energy, risk management and territorial planning.
Content created by Mayte Toscano, Senior Consultant in Technologies related to the data economy. The content and views expressed in this publication are the sole responsibility of the author.
Noticia
From today, September 15, registration is open for one of the most important events in the geospatial sector in the Iberian Peninsula. The XVI Iberian Conference on Spatial Data Infrastructures (JIIDE 2025) will be held in Oviedo from 12 to 14 November 2025. This annual meeting represents a unique opportunity to explore the latest trends in spatial data reuse, especially in the context of the application of artificial intelligence to territorial knowledge.
Since its first edition in 2011, the JIIDEs have evolved as a result of collaboration between the Direção-Geral do Território de Portugal, the National Geographic Institute of Spain through the National Center for Geographic Information, and the Government of Andorra. In this sixteenth edition, the Ministry of Territorial Planning, Urban Planning, Housing and Citizens' Rights of the Principality of Asturias and the University of Oviedo also join, thus consolidating an initiative that brings together hundreds of professionals from the Public Administration, the private sector and the academic field every year.
For three days, experts with proven experience and technical knowledge in geographic information will share their most innovative developments, work methodologies and success stories in the management and reuse of spatial data.
Two axes: artificial intelligence and the INSPIRE and HVDS regulatory framework
The central theme of this edition, "AI and territory: exploring the new frontiers of spatial knowledge", reflects the natural evolution of the sector towards the incorporation of emerging technologies. Artificial intelligence, machine learning, and advanced analytics algorithms are radically transforming the way we process, analyze, and extract value from geospatial data.
This orientation towards AI is not accidental. The publication and use of geospatial data makes it possible to harness one of the most valuable digital assets for economic development, environmental monitoring, competitiveness, innovation and job creation. When this data is combined with artificial intelligence techniques, its potential multiplies exponentially.
The conference takes place at a particularly relevant time for the open data ecosystem. The INSPIRE Directive, together with Directive (EU) 2019/1024 on open data and re-use of public sector information, has established a regulatory framework that explicitly recognises the economic and social value of digital geospatial data.
The evolution in the publication of high-value datasets marks an important milestone in this process. These sets, characterized by their great potential for reuse, should be available free of charge, in machine-readable formats and through application programming interfaces (APIs). Geospatial data occupies a central position in this categorisation, underlining its strategic importance for the European open data ecosystem.
JIIDE 2025 will devote particular attention to presenting practical examples of re-use of these high-value datasets , both through the new OGC APIs and through traditional download services and established interoperable formats. This practical approach will allow attendees to learn about real cases of implementation and their tangible results.
Miscellaneous Program: Use Cases, AI, and Geospatial Data Reuse
You can also check the program here. Among the planned activities, there are sessions ranging from fundamental technical aspects to innovative applications that demonstrate the transformative potential of this data. The activities are organized into five main themes:
Spatial data structure and metadata.
Data management and publication.
Development of spatial software.
Artificial intelligence.
Cooperation between agents.
Some of the highlighted topics are project management and coordination, where corporate systems such as the SIG of the Junta de Andalucía or the SITNA of the Government of Navarra will be presented. Earth observation will also feature prominently, with presentations on the evolution of the National Plan for Aerial Orthophotography (APNOA) programme and advanced deep learning image processing techniques.
On the other hand, thematic visualisers also represent another fundamental axis, showing how spatial data can be transformed into accessible tools for citizens. From eclipse visualizers to tools for calculating the solar potential of rooftops, developments will be presented that demonstrate how the creative reuse of data can generate services of high social value.
Following the annual theme, the application of AI to geospatial data will be approached from multiple perspectives. Use cases will be presented in areas as diverse as the automatic detection of sports facilities, the classification of LiDAR point clouds, the identification of hazardous materials such as asbestos, or the optimization of urban mobility.
One of the most relevant sessions for the open data community will focus specifically on "Reuse and Open Government". This session will address the integration of spatial data infrastructures into open data portals, spatial data metadata according to the GeoDCAT-AP standard, and the application of data quality regulations.
Local governments play a key role in the generation and publication of spatial data. For this reason, the JIIDE 2025 will dedicate a specific session to the publication of local data, where municipalities such as Barcelona, Madrid, Bilbao or Cáceres will share their experiences and developments.
In addition to the theoretical sessions, the conferences include practical workshops on specific tools, methodologies and technologies. These workshops, lasting 45 minutes to an hour, allow attendees to experiment directly with the solutions presented. Some of them address the creation of custom web geoportals and others, for example, the implementation of OGC APIs, through advanced visualization techniques and metadata management tools.
Participate in person or online
The JIIDEs maintain their commitment to open participation, inviting both researchers and professionals to present their tools, technical solutions, work methodologies and success stories. In addition, the JIIDE 2025 will be held in hybrid mode, allowing both face-to-face participation in Oviedo and virtual monitoring.
This flexibility, maintained from the experiences of recent years, ensures that professionals throughout the Iberian territory and beyond can benefit from shared knowledge. Participation remains free, although prior registration is required for each session, roundtable or workshop.
Starting today, you can sign up and take advantage of this opportunity to learn and exchange experiences on geospatial data. Registration is available on the official website of the event: https://www.jiide.org/web/portal/inicio
Blog
Synthetic images are visual representations artificially generated by algorithms and computational techniques, rather than being captured directly from reality with cameras or sensors. They are produced from different methods, among which the antagonistic generative networks (Generative Adversarial NetworksGAN), the Dissemination models, and the 3D rendering techniques. All of them allow you to create images of realistic appearance that in many cases are indistinguishable from an authentic photograph.
When this concept is transferred to the field of Earth observation, we are talking about synthetic satellite images. These are not obtained from a space sensor that captures real electromagnetic radiation, but are generated digitally to simulate what a satellite would see from orbit. In other words, instead of directly reflecting the physical state of the terrain or atmosphere at a particular time, they are computational constructs capable of mimicking the appearance of a real satellite image.
The development of this type of image responds to practical needs. Artificial intelligence systems that process remote sensing data require very large and varied sets of images. Synthetic images allow, for example, to recreate areas of the Earth that are little observed, to simulate natural disasters – such as forest fires, floods or droughts – or to generate specific conditions that are difficult or expensive to capture in practice. In this way, they constitute a valuable resource for training detection and prediction algorithms in agriculture, emergency management, urban planning or environmental monitoring.
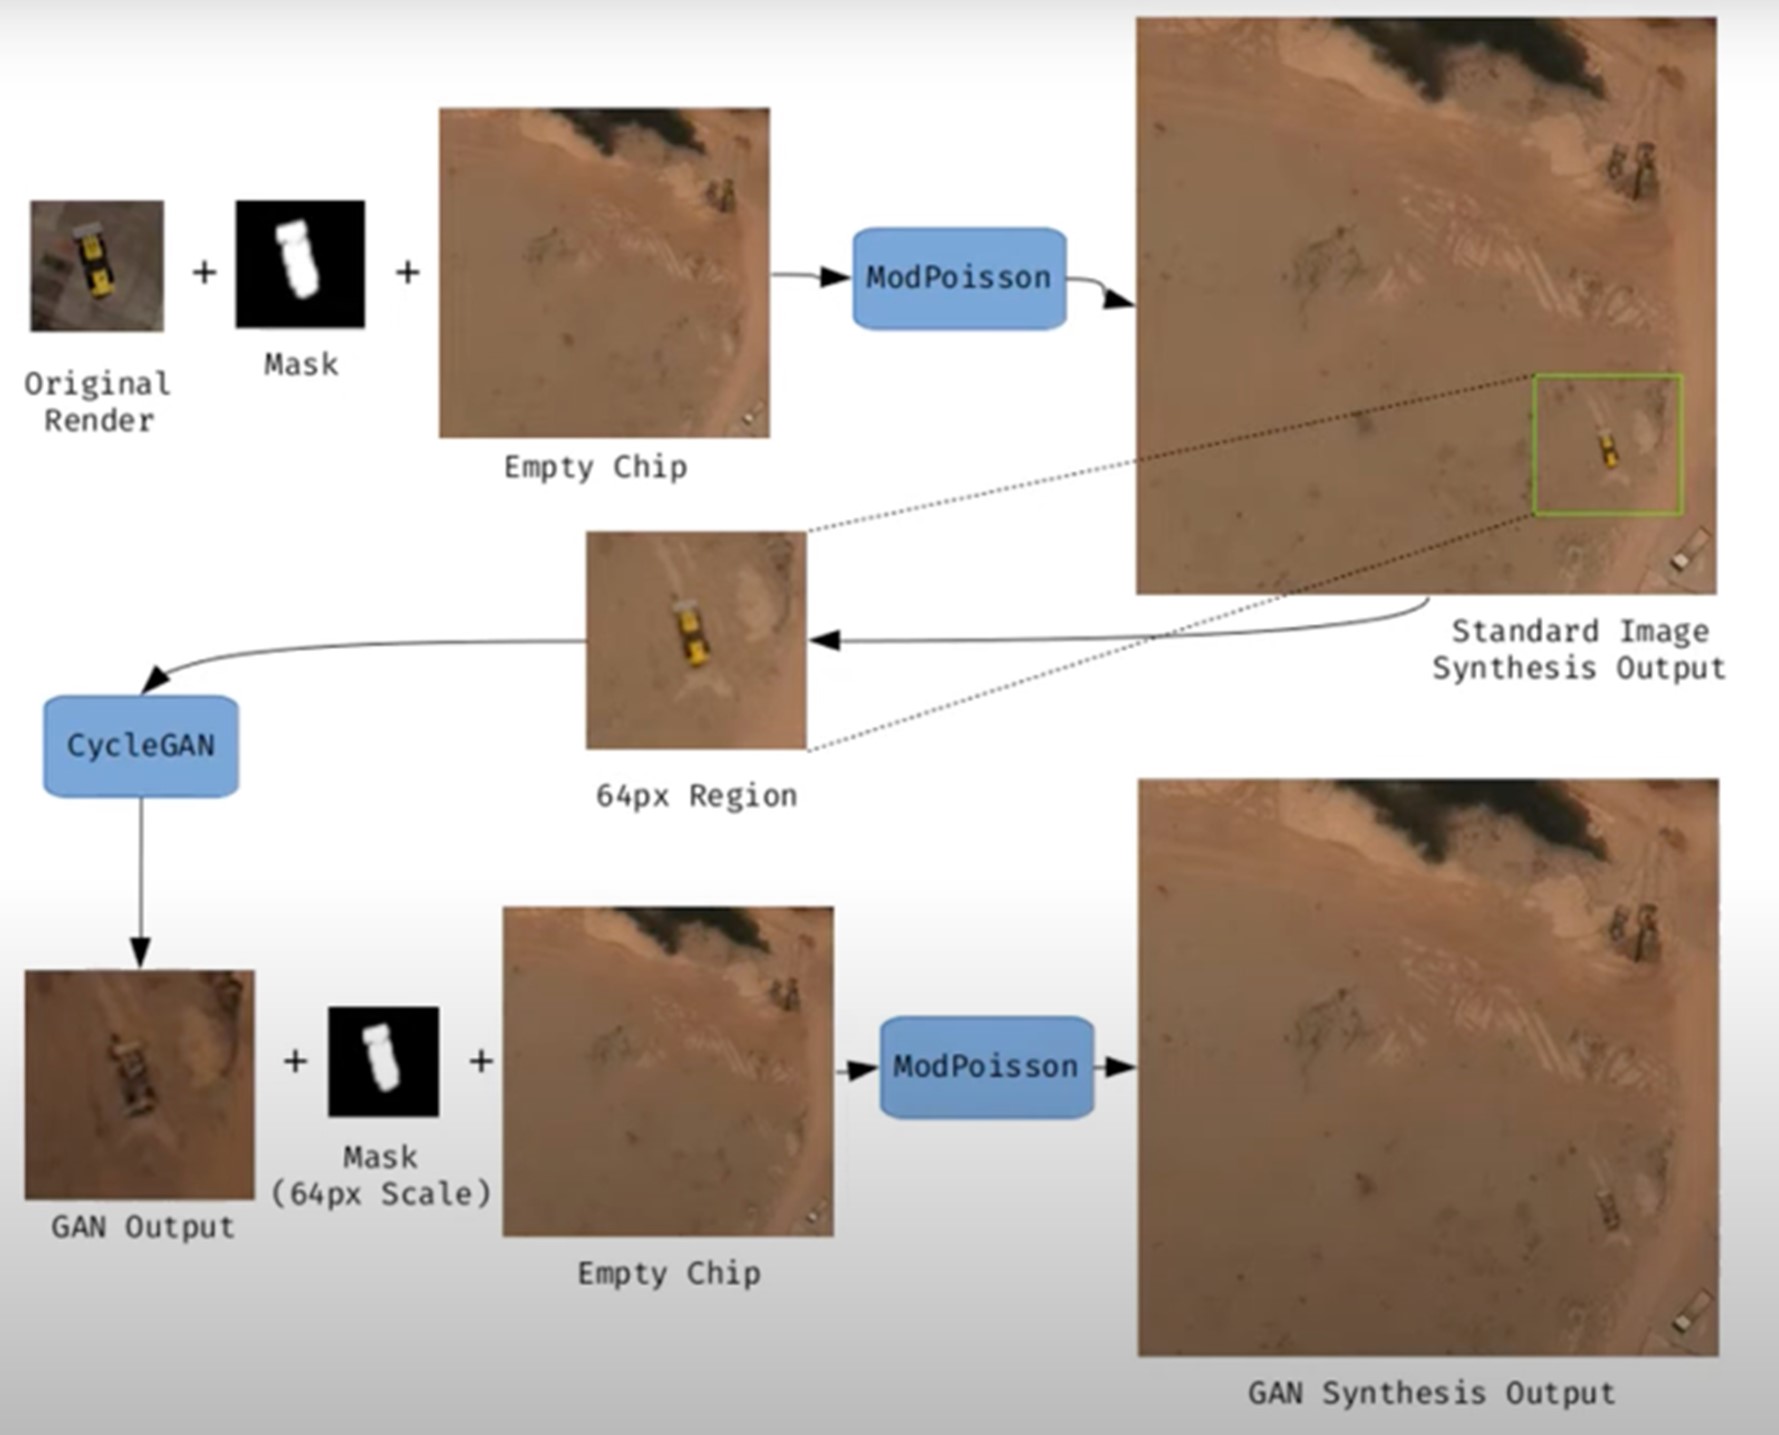
Figure 1. Example of synthetic satellite image generation.
Its value is not limited to model training. Where high-resolution images do not exist – due to technical limitations, access restrictions or economic reasons – synthesis makes it possible to fill information gaps and facilitate preliminary studies. For example, researchers can work with approximate synthetic images to design risk models or simulations before actual data are available.
However, synthetic satellite imagery also poses significant risks. The possibility of generating very realistic scenes opens the door to manipulation and misinformation. In a geopolitical context, an image showing non-existent troops or destroyed infrastructure could influence strategic decisions or international public opinion. In the environmental field, manipulated images could be disseminated to exaggerate or minimize the impacts of phenomena such as deforestation or melting ice, with direct effects on policies and markets.
Therefore, it is convenient to differentiate between two very different uses. The first is use as a support, when synthetic images complement real images to train models or perform simulations. The second is use as a fake, when they are deliberately presented as authentic images in order to deceive. While the former uses drive innovation, the latter threatens trust in satellite data and poses an urgent challenge of authenticity and governance.
Risks of satellite imagery applied to Earth observation
Synthetic satellite imagery poses significant risks when used in place of images captured by real sensors. Below are examples that demonstrate this.
A new front of disinformation: "deepfake geography"
The term deepfake geography has already been consolidated in the academic and popular literature to describe fictitious satellite images, manipulated with AI, that appear authentic, but do not reflect any existing reality. Research from the University of Washington, led by Bo Zhao, used algorithms such as CycleGAN to modify images of real cities—for example, altering the appearance of Seattle with non-existent buildings or transforming Beijing into green areas—highlighting the potential to generate convincing false landscapes.
One OnGeo Intelligence (OGC) platform article stresses that these images are not purely theoretical, but real threats affecting national security, journalism and humanitarian work. For its part, the OGC warns that fabricated satellite imagery, AI-generated urban models, and synthetic road networks have already been observed, and that they pose real challenges to public and operational trust.
Strategic and policy implications
Satellite images are considered "impartial eyes" on the planet, used by governments, media and organizations. When these images are faked, their consequences can be severe:
- National security and defense: if false infrastructures are presented or real ones are hidden, strategic analyses can be diverted or mistaken military decisions can be induced.
- Disinformation in conflicts or humanitarian crises: An altered image showing fake fires, floods, or troop movements can alter the international response, aid flows, or citizens' perceptions, especially if it is spread through social media or media without verification.
- Manipulation of realistic images of places: not only the general images are at stake. Nguyen et al. (2024) showed that it is possible to generate highly realistic synthetic satellite images of very specific facilities such as nuclear plants.
Crisis of trust and erosion of truth
For decades, satellite imagery has been perceived as one of the most objective and reliable sources of information about our planet. They were the graphic evidence that made it possible to confirm environmental phenomena, follow armed conflicts or evaluate the impact of natural disasters. In many cases, these images were used as "unbiased evidence," difficult to manipulate, and easy to validate. However, the emergence of synthetic images generated by artificial intelligence has begun to call into question that almost unshakable trust.
Today, when a satellite image can be falsified with great realism, a profound risk arises: the erosion of truth and the emergence of a crisis of confidence in spatial data.
The breakdown of public trust
When citizens can no longer distinguish between a real image and a fabricated one, trust in information sources is broken. The consequence is twofold:
- Distrust of institutions: if false images of a fire, a catastrophe or a military deployment circulate and then turn out to be synthetic, citizens may also begin to doubt the authentic images published by space agencies or the media. This "wolf is coming" effect generates skepticism even in the face of legitimate evidence.
- Effect on journalism: traditional media, which have historically used satellite imagery as an unquestionable visual source, risk losing credibility if they publish doctored images without verification. At the same time, the abundance of fake images on social media erodes the ability to distinguish what is real and what is not.
- Deliberate confusion: in contexts of disinformation, the mere suspicion that an image may be false can already be enough to generate doubt and sow confusion, even if the original image is completely authentic.
The following is a summary of the possible cases of manipulation and risk in satellite images:
|
Ambit |
Type of handling |
Main risk |
Documented example |
|---|---|---|---|
| Armed conflicts | Insertion or elimination of military infrastructures. | Strategic disinformation; erroneous military decisions; loss of credibility in international observation. | Alterations demonstrated in deepfake geography studies where dummy roads, bridges or buildings were added to satellite images. |
| Climate change and the environment | Alteration of glaciers, deforestation or emissions. | Manipulation of environmental policies; delay in measures against climate change; denialism. | Studies have shown the ability to generate modified landscapes (forests in urban areas, changes in ice) by means of GANs. |
| Gestión de emergencias | Creation of non-existent disasters (fires, floods). | Misuse of resources in emergencies; chaos in evacuations; loss of trust in agencies. | Research has shown the ease of inserting smoke, fire or water into satellite images. |
| Mercados y seguros | Falsification of damage to infrastructure or crops. | Financial impact; massive fraud; complex legal litigation. | Potential use of fake images to exaggerate damage after disasters and claim compensation or insurance. |
| Derechos humanos y justicia internacional | Alteration of visual evidence of war crimes. | Delegitimization of international tribunals; manipulation of public opinion. | Risk identified in intelligence reports: Doctored images could be used to accuse or exonerate actors in conflicts. |
| Geopolítica y diplomacia | Creation of fictitious cities or border changes. | Diplomatic tensions; treaty questioning; State propaganda | Examples of deepfake maps that transform geographical features of cities such as Seattle or Tacoma. |
Figure 2. Table showing possible cases of manipulation and risk in satellite images
Impact on decision-making and public policies
The consequences of relying on doctored images go far beyond the media arena:
- Urbanism and planning: decisions about where to build infrastructure or how to plan urban areas could be made on manipulated images, generating costly errors that are difficult to reverse.
- Emergency management: If a flood or fire is depicted in fake images, emergency teams can allocate resources to the wrong places, while neglecting areas that are actually affected.
- Climate change and the environment: Doctored images of glaciers, deforestation or polluting emissions could manipulate political debates and delay the implementation of urgent measures.
- Markets and insurance: Insurers and financial companies that rely on satellite imagery to assess damage could be misled, with significant economic consequences.
In all these cases, what is at stake is not only the quality of the information, but also the effectiveness and legitimacy of public policies based on that data.
The technological cat and mouse game
The dynamics of counterfeit generation and detection are already known in other areas, such as video or audio deepfakes: every time a more realistic generation method emerges, a more advanced detection algorithm is developed, and vice versa. In the field of satellite images, this technological career has particularities:
- Increasingly sophisticated generators: today's broadcast models can create highly realistic scenes, integrating ground textures, shadows, and urban geometries that fool even human experts.
- Detection limitations: Although algorithms are developed to identify fakes (analyzing pixel patterns, inconsistencies in shadows, or metadata), these methods are not always reliable when faced with state-of-the-art generators.
- Cost of verification: independently verifying a satellite image requires access to alternative sources or different sensors, something that is not always available to journalists, NGOs or citizens.
- Double-edged swords: The same techniques used to detect fakes can be exploited by those who generate them, further refining synthetic images and making them more difficult to differentiate.
From visual evidence to questioned evidence
The deeper impact is cultural and epistemological: what was previously assumed to be objective evidence now becomes an element subject to doubt. If satellite imagery is no longer perceived as reliable evidence, it weakens fundamental narratives around scientific truth, international justice, and political accountability.
- In armed conflicts, a satellite image showing possible war crimes can be dismissed under the accusation of being a deepfake.
- In international courts, evidence based on satellite observation could lose weight in the face of suspicion of manipulation.
- In public debate, the relativism of "everything can be false" can be used as a rhetorical weapon to delegitimize even the strongest evidence.
Strategies to ensure authenticity
The crisis of confidence in satellite imagery is not an isolated problem in the geospatial sector, but is part of a broader phenomenon: digital disinformation in the age of artificial intelligence. Just as video deepfakes have called into question the validity of audiovisual evidence, the proliferation of synthetic satellite imagery threatens to weaken the last frontier of perceived objective data: the unbiased view from space.
Ensuring the authenticity of these images requires a combination of technical solutions and governance mechanisms, capable of strengthening traceability, transparency and accountability across the spatial data value chain. The main strategies under development are described below.
Robust metadata: Record origin and chain of custody
Metadata is the first line of defense against manipulation. In satellite imagery, they should include detailed information about:
- The sensor used (type, resolution, orbit).
- The exact time of acquisition (date and time, with time precision).
- The precise geographical location (official reference systems).
- The applied processing chain (atmospheric corrections, calibrations, reprojections).
Recording this metadata in secure repositories allows the chain of custody to be reconstructed, i.e. the history of who, how and when an image has been manipulated. Without this traceability, it is impossible to distinguish between authentic and counterfeit images.
EXAMPLE: The European Union's Copernicus program already implements standardized and open metadata for all its Sentinel images, facilitating subsequent audits and confidence in the origin.
Digital signatures and blockchain: ensuring integrity
Digital signatures allow you to verify that an image has not been altered since it was captured. They function as a cryptographic seal that is applied at the time of acquisition and validated at each subsequent use.
Blockchain technology offers an additional level of assurance: storing acquisition and modification records on an immutable chain of blocks. In this way, any changes in the image or its metadata would be recorded and easily detectable.
EXAMPLE: The ESA – Trusted Data Framework project explores the use of blockchain to protect the integrity of Earth observation data and bolster trust in critical applications such as climate change and food security.
Invisible watermarks: hidden signs in the image
Digital watermarking involves embedding imperceptible signals in the satellite image itself, so that any subsequent alterations can be detected automatically.
- It can be done at the pixel level, slightly modifying color patterns or luminance.
- It is combined with cryptographic techniques to reinforce its validity.
- It allows you to validate images even if they have been cropped, compressed, or reprocessed.
EXAMPLE: In the audiovisual sector, watermarks have been used for years in the protection of digital content. Its adaptation to satellite images is in the experimental phase, but it could become a standard verification tool.
Open Standards (OGC, ISO): Trust through Interoperability
Standardization is key to ensuring that technical solutions are applied in a coordinated and global manner.
- OGC (Open Geospatial Consortium) works on standards for metadata management, geospatial data traceability, and interoperability between systems. Their work on geospatial APIs and FAIR (Findable, Accessible, Interoperable, Reusable) metadata is essential to establishing common trust practices.
- ISO develops standards on information management and authenticity of digital records that can also be applied to satellite imagery.
EXAMPLE: OGC Testbed-19 included specific experiments on geospatial data authenticity, testing approaches such as digital signatures and certificates of provenance.
Cross-check: combining multiple sources
A basic principle for detecting counterfeits is to contrast sources. In the case of satellite imagery, this involves:
- Compare images from different satellites (e.g. Sentinel-2 vs. Landsat-9).
- Use different types of sensors (optical, radar SAR, hyperspectral).
- Analyze time series to verify consistency over time.
EXAMPLE: Damage verification in Ukraine following the start of the Russian invasion in 2022 was done by comparing images from several vendors (Maxar, Planet, Sentinel), ensuring that the findings were not based on a single source.
AI vs. AI: Automatic Counterfeit Detection
The same artificial intelligence that allows synthetic images to be created can be used to detect them. Techniques include:
- Pixel Forensics: Identify patterns generated by GANs or broadcast models.
- Neural networks trained to distinguish between real and synthetic images based on textures or spectral distributions.
- Geometric inconsistencies models: detect impossible shadows, topographic inconsistencies, or repetitive patterns.
EXAMPLE: Researchers at the University of Washington and other groups have shown that specific algorithms can detect satellite fakes with greater than 90% accuracy under controlled conditions.
Current Experiences: Global Initiatives
Several international projects are already working on mechanisms to reinforce authenticity:
- Coalition for Content Provenance and Authenticity (C2PA): A partnership between Adobe, Microsoft, BBC, Intel, and other organizations to develop an open standard for provenance and authenticity of digital content, including images. Its model can be applied directly to the satellite sector.
- OGC work: the organization promotes the debate on trust in geospatial data and has highlighted the importance of ensuring the traceability of synthetic and real satellite images (OGC Blog).
- NGA (National Geospatial-Intelligence Agency) in the US has publicly acknowledged the threat of synthetic imagery in defence and is driving collaborations with academia and industry to develop detection systems.
Towards an ecosystem of trust
The strategies described should not be understood as alternatives, but as complementary layers in a trusted ecosystem:
|
Id |
Layers |
Benefits |
|---|---|---|
| 1 | Robust metadata (source, sensor, chain of custody) |
Traceability guaranteed |
| 2 | Digital signatures and blockchain (data integrity) |
Ensuring integrity |
| 3 | Invisible watermarks (hidden signs) |
Add a hidden level of protection |
| 4 | Cross-check (multiple satellites and sensors) |
Validates independently |
| 5 | AI vs. AI (counterfeit detector) |
Respond to emerging threats |
| 6 | International governance (accountability, legal frameworks) |
Articulate clear rules of liability |
Figure 3. Layers to ensure confidence in synthetic satellite images
Success will depend on these mechanisms being integrated together, under open and collaborative frameworks, and with the active involvement of space agencies, governments, the private sector and the scientific community.
Conclusions
Synthetic images, far from being just a threat, represent a powerful tool that, when used well, can provide significant value in areas such as simulation, algorithm training or innovation in digital services. The problem arises when these images are presented as real without proper transparency, fueling misinformation or manipulating public perception.
The challenge, therefore, is twofold: to take advantage of the opportunities offered by the synthesis of visual data to advance science, technology and management, and to minimize the risks associated with the misuse of these capabilities, especially in the form of deepfakes or deliberate falsifications.
In the particular case of satellite imagery, trust takes on a strategic dimension. Critical decisions in national security, disaster response, environmental policy, and international justice depend on them. If the authenticity of these images is called into question, not only the reliability of the data is compromised, but also the legitimacy of decisions based on them.
The future of Earth observation will be shaped by our ability to ensure authenticity, transparency and traceability across the value chain: from data acquisition to dissemination and end use. Technical solutions (robust metadata, digital signatures, blockchain, watermarks, cross-verification, and AI for counterfeit detection), combined with governance frameworks and international cooperation, will be the key to building an ecosystem of trust.
In short, we must assume a simple but forceful guiding principle:
"If we can't trust what we see from space, we put our decisions on Earth at risk."
Content prepared by Mayte Toscano, Senior Consultant in Data Economy Technologies. The contents and points of view reflected in this publication are the sole responsibility of the author.
Blog
Cities account for more than two-thirds of Europe's population and consume around 80% of energy. In this context, climate change is having a particularly severe impact on urban environments, not only because of their density, but also because of their construction characteristics, their energy metabolism and the scarcity of vegetation in many consolidated areas. One of the most visible and worrying effects is the phenomenon known as urban heat island (UHI).
Heat islands occur when the temperature in urban areas is significantly higher than in nearby rural or peri-urban areas, especially at night. This thermal differential can easily exceed five degrees Celsius under certain conditions. The consequences of this phenomenon go beyond thermal discomfort: it directly affects health, air quality, energy consumption, urban biodiversity and social equity.
In recent years, the availability of open data—especially geospatial data—has made it possible to characterize, map, and analyze urban heat islands with unprecedented accuracy. This article explores how this data can be used to design urban solutions adapted to climate change, with heat island mitigation as its focus.
What are urban heat islands and why do they occur?
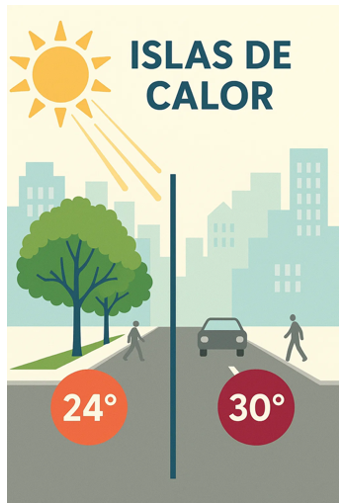
Figure 1. Illustrative element on heat islands.
To intervene effectively in heat islands, it is necessary to know where, when and how they occur. Unlike other natural hazards, the heat island effect is not visible to the naked eye, and its intensity varies depending on the time of day, time of year, and specific weather conditions. It therefore requires a solid and dynamic knowledge base, which can only be built through the integration of diverse, up-to-date and territorialized data.
At this point, open geospatial data is a critical tool. Through satellite images, urban maps, meteorological data, cadastral cartography and other publicly accessible sets, it is possible to build urban thermal models, identify critical areas, estimate differential exposures and evaluate the impact of the measures adopted.
The main categories of data that allow us to address the phenomenon of heat islands from a territorial and interdisciplinary perspective are detailed below.
Types of geoespatial data applicable to the study of the phenomenon
1. Earth observation satellite data
Thermal sensors on satellites such as Landsat 8/9 (NASA/USGS) or Sentinel-3 (Copernicus) make it possible to generate urban surface temperature maps with resolutions ranging from 30 to 1,000 metres. Although these images have spatial and temporal limitations, they are sufficient to detect patterns and trends, especially if combined with time series.
This data, accessible through platforms such as the Copernicus Open Access Hub or the USGS EarthExplorer, is essential for comparative studies between cities or for observing the temporal evolution of the same area.
2. Urban weather data
The network of AEMET stations, together with other automatic stations managed by autonomous communities or city councils, allows the evolution of air temperatures in different urban points to be analysed. In some cases, there are also citizen sensors or networks of sensors distributed in the urban space that allow real-time heat maps to be generated with high resolution.
3. Urban mapping and digital terrain models
Digital surface models (DSM), digital terrain models (DTM) and mappings derived from LIDAR allow the study of urban morphology, building density, street orientation, terrain slope and other factors that affect natural ventilation and heat accumulation. In Spain, this data is accessible through the National Center for Geographic Information (CNIG).
4. Land cover and land use databases
Databases such as Corine Land Cover of the Copernicus Programme, or land use maps at the regional level make it possible to distinguish between urbanised areas, green areas, impermeable surfaces and bodies of water. This information is key to calculating the degree of artificialization of an area and its relationship with the heat balance.
5. Inventories of urban trees and green spaces
Some municipalities publish on their open data portals the detailed inventory of urban trees, parks and gardens. These georeferenced data make it possible to analyse the effect of vegetation on thermal comfort, as well as to plan new plantations or green corridors.
6. Socioeconomic and vulnerability data
Data from the National Institute of Statistics (INE), together with the social information systems of autonomous communities and city councils, make it possible to identify the most vulnerable neighbourhoods from a social and economic point of view. Its cross-referencing with thermal data allows a climate justice dimension to be incorporated into decision-making.
Practical applications: how open data is used to act
Once the relevant data has been gathered and integrated, multiple analysis strategies can be applied to support public policies and urban projects with sustainability and equity criteria. Some of the main applications are described below.
· Heat zone mapping and vulnerability maps: Using thermal imagery, weather data, and urban layers together, heat island intensity maps can be generated at the neighborhood or block level. If these maps are combined with social, demographic and public health indicators, it is possible to build thermal vulnerability maps, which prioritize intervention in areas where high temperatures and high levels of social risk intersect. These maps allow, for example:
· Identify priority neighborhoods for urban greening.
· Plan evacuation routes or shaded areas during heat waves.
· Determine the optimal location of climate refuges.
· Assessing the impact of nature-based solutions: Open data also makes it possible to monitor the effects of certain urban actions. For example, using time series of satellite images or temperature sensors, it is possible to assess how the creation of a park or the planting of trees on a street has modified the surface temperature. This ex-post evaluation approach allows justifying public investments, adjusting designs and scaling effective solutions to other areas with similar conditions.
· Urban modelling and climate simulations: three-dimensional urban models, built from open LIDAR data or cadastral mapping, make it possible to simulate the thermal behaviour of a neighbourhood or city under different climatic and urban scenarios. These simulations, combined with tools such as ENVI-met or Urban Weather Generator, are essential to support decision-making in urban planning.
Existing studies and analysis on urban heat islands: what has been done and what we can learn
During the last decade, multiple studies have been carried out in Spain and Europe that show how open data, especially geospatial data, allow the phenomenon of urban heat islands to be characterised and analysed. These works are fundamental not only because of their specific results, but also because they illustrate replicable and scalable methodologies. Some of the most relevant are described below.
Polytechnic University of Madrid study on surface temperature in Madrid
A team from the Department of Topographic Engineering and Cartography of the UPM analysed the evolution of surface temperature in the municipality of Madrid using thermal images from the Landsat 8 satellite in the summer period. The study focused on detecting spatial changes in warmer areas and relating them to land use, urban vegetation and building density.
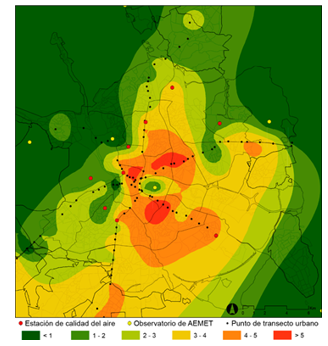
Figure 2. Illustrative image. Source: generated with AI
Methodology:
Remote sensing techniques were applied to extract the surface temperature from the TIRS thermal channel of the Landsat. Subsequently, a statistical analysis of correlation between thermal values and variables such as NDVI (vegetation index), type of land cover (CORINE data) and urban morphology was carried out.
Main results:
Areas with higher building density, such as the central and southern neighborhoods, showed higher surface temperatures. The presence of urban parks reduced the temperature of their immediate surroundings by 3 to 5 °C. It was confirmed that the heat island effect intensifies at night, especially during persistent heat waves.
This type of analysis is especially useful for designing urban greening strategies and for justifying interventions in vulnerable neighbourhoods.
Barcelona Climate Vulnerability Atlas
Barcelona City Council, in collaboration with experts in public health and urban geography, developed a Climate Vulnerability Atlas which includes detailed maps of heat exposure, population sensitivity, and adaptive capacity. The objective was to guide municipal policies against climate change, especially in the field of health and social services.

Figure 3. Image containing fence, exterior, buildings and grass. Source: generated with AI
Methodology:
The atlas was developed by combining open and administrative data at the census tract level. Three dimensions were analysed: exposure (air temperature and surface data), sensitivity (advanced age, density, morbidity) and adaptive capacity (access to green areas, quality of housing, facilities). The indicators were normalized and combined through multi-criteria spatial analysis to generate a climate vulnerability index. The result made it possible to locate the neighbourhoods most at risk from extreme heat and to guide municipal measures.
Main results:
Based on the atlas, the network of "climate shelters" was designed, which includes libraries, civic centers, schools and conditioned parks, activated during episodes of extreme heat. The selection of these spaces was based directly on the atlas data.
Multitemporal analysis of the heat island effect in Seville
Researchers from the University of Seville used satellite data from Sentinel-3 and Landsat 8 to study the evolution of the heat island phenomenon in the city between 2015 and 2022. The aim was to evaluate the effectiveness of certain urban actions – such as the "Green your neighbourhood" plan – and to anticipate the effects of climate change on the city.
Methodology:
Thermal imaging and NDVI data were used to calculate temperature differences between urban areas and surrounding rural areas. Supervised classification techniques were also applied to identify land uses and their evolution. Open data from tree inventories and urban shade maps were used to interpret the results.
Main results:
Specific renaturation actions have a very positive local impact, but their effect on the city as a whole is limited if they are not integrated into a metropolitan-scale strategy. The study concluded that a continuous network of vegetation and bodies of water is more effective than isolated actions.
European comparison of the Urban Heat Island Atlas (Copernicus) project
Although it is not a Spanish study, the viewer developed by Copernicus for the European Urban Atlas programme offers a comparative analysis between European cities.
Methodology:
The viewer integrates Sentinel-3 thermal imagery, land cover data, and urban mapping to assess the severity of the heat island effect.

Figure 4. Illustration: Infographic showing the main factors causing the urban heat island effect (UHI). Urban areas retain heat due to tall buildings, impermeable surfaces and heat-retaining materials, while green areas are cooler Source: Urban heat islands.
Main results:
This type of tool allows smaller cities to have a first approximation of the phenomenon without the need to develop their own models. As it is based on open and free data, the viewer allows direct consultations by technicians and citizens.
Current limitations and challenges
Despite progress in opening up data, there are still significant challenges:
-
Territorial inequality: not all cities have the same quality and quantity of data.
-
Irregular update: Some sets are released on a one-off basis and are not updated regularly.
-
Low granularity: Data is often aggregated by districts or census tracts, making street-scale interventions difficult.
-
Lack of technical capacities: Many local governments do not have staff specialized in geospatial analysis.
- Little connection with citizens: the knowledge generated from data does not always translate into visible or understandable actions for the population.
Conclusion: building climate resilience from geoespatial data
Urban heat islands are not a new phenomenon, but in the context of climate change they take on a critical dimension. Cities that do not plan based on data will be increasingly exposed to episodes of extreme heat, with unequal impacts among their populations.
Open data—and in particular geospatial data—offers a strategic opportunity to transform this threat into a lever for change. With them we can identify, anticipate, intervene and evaluate. But for this to happen, it is essential to:
· Consolidate accessible, up-to-date and quality data infrastructures.
· To promote collaboration between levels of government, research centres and citizens.
· Train municipal technicians in the use of geospatial tools.
· Promote a culture of evidence-based decision-making and climate sensitivity.
Data does not replace politics, but it allows it to be founded, improved and made more equitable. In a global warming scenario, having open geospatial data is a key tool to make our cities more livable and better prepared for the future.
Content prepared by Mayte Toscano, Senior Consultant in Data Economy Technologies. The contents and points of view reflected in this publication are the sole responsibility of the author.
Blog
In an increasingly interconnected and complex world, geospatial intelligence (GEOINT) has become an essential tool for defence and security decision-making . The ability to collect, analyse and interpret geospatial data enables armed forces and security agencies to better understand the operational environment, anticipate threats and plan operations more effectively.
In this context, satellite data, classified but also open data, have acquired significant relevance. Programmes such as Copernicus of the European Union provide free and open access to a wide range of Earth observation data, which democratises access to critical information and fosters collaboration between different actors.
This article explores the role of data in geospatial intelligence applied to defence, highlighting its importance, applications and Spain's leadership in this field.
Geospatial intelligence (GEOINT) is a discipline that combines the collection, analysis and interpretation of geospatial data to support decision making in a variety of areas, including defence, security and emergency management. This data may include satellite imagery, remotely sensed information, geographic information system (GIS) data and other sources that provide information on the location and characteristics of the terrain.
In the defence domain, GEOINT enables military analysts and planners to gain a detailed understanding of the operational environment, identify potential threats and plan operations with greater precision. It also facilitates coordination between different units and agencies, improving the effectiveness of joint operations.
Defence application
The integration of open satellite data into geospatial intelligence has significantly expanded defence capabilities. Some of the most relevant applications are presented below:

Figure 1. GEOINT applications in defence. Source: own elaboration
Geospatial intelligence not only supports the military in making tactical decisions, but also transforms the way military, surveillance and emergency response operations are planned and executed. Here we present concrete use cases where GEOINT, supported by open satellite data, has had a decisive impact.
Monitoring of military movements in conflicts
Case. Ukraine War (2,022-2,024)
Organisations such as the EU Satellite Centre (SatCen) and NGOs such as the Conflict Intelligence Team have used Sentinel-1 and Sentinel-2 (Copernicus) imagery for the Conflict Intelligence Team :
- Detect concentrations of Russian troops and military equipment.
- Analyse changes to airfields, bases or logistics routes.
- Support independent verification of events on the ground.
This has been key to EU and NATO decision-making, without the need to resort to classified data.
Maritime surveillance and border control
Case. FRONTEX operations in the Mediterranean
GEOINT powered by Sentinel-1 (radar) and Sentinel-3 (optical + altimeter) allows:
- Identify unauthorised vessels, even under cloud cover or at night.
- Integrate alerts with AIS (automatic ship identification system).
- Coordinate rescue and interdiction operations.
Advantage: Sentinel-1's synthetic aperture radar (SAR) can see through clouds, making it ideal for continuous surveillance.
Support to peace missions and humanitarian aid
Case. Earthquake in Syria/Turkey (2,023)
Open data (Sentinel-2, Landsat-8, PlanetScope free after catastrophe) were used for:
- Detect collapsed areas and assess damage.
- Plan safe access routes.
Coordinate camps and resources with military support.
Spain's role
Spain has demonstrated a significant commitment to the development and application of geospatial intelligence in defence.
|
European Union Satellite Centre (SatCen) |
Project Zeus of the Spanish Army |
Participation in European Programmes | National capacity building |
|
Located in Torrejón de Ardoz, SatCen is a European Union agency that provides geospatial intelligence products and services to support security and defence decision-making. Spain, as host country, plays a central role in SatCen operations. |
The Spanish Army has launched the Zeus project, a technological initiative that integrates artificial intelligence, 5G networks and satellite data to improve operational capabilities. This project aims to create a tactical combat cloud to enable greater interoperability and efficiency in military operations. |
Spain actively participates in European programmes related to Earth observation and geospatial intelligence, such as Copernicus and MUSIS. In addition, it collaborates in bilateral and multilateral initiatives for satellite capacity building and data sharing. |
At the national level, Spain has invested in the development of its own geospatial intelligence capabilities, including the training of specialised personnel and the acquisition of advanced technologies. These investments reinforce the country's strategic autonomy and its ability to contribute to international operations. |
Figure 2. Comparative table of Spain's participation in different satellite projects. Source: own elaboration
Challenges and opportunities
While open satellite data offers many advantages, it also presents certain challenges that need to be addressed to maximise its usefulness in the defence domain.
-
Data quality and resolution: While open data is valuable, it often has limitations in terms of spatial and temporal resolution compared to commercial or classified data. This may affect its applicability in certain operations requiring highly accurate information.
-
Data integration: The integration of data from multiple sources, including open, commercial and classified data, requires systems and processes to ensure interoperability and consistency of information. This involves technical and organisational challenges that must be overcome.
-
Security and confidentiality: The use of open data in defence contexts raises questions about the security and confidentiality of information. It is essential to establish security protocols and measures to protect sensitive information and prevent its misuse.
- Opportunities for collaboration: Despite these challenges, open satellite data offer significant opportunities for collaboration between different actors, including governments, international organisations, the private sector and civil society. Such collaboration can improve the effectiveness of defence operations and contribute to greater global security.
Recommendations for strengthening the use of open data in defence
Based on the above analysis, some key recommendations can be drawn to better exploit the potential of open data:
-
Strengthening open data infrastructures: consolidate national platforms integrating open satellite data for both civilian and military use, with a focus on security and interoperability.
-
Promotion of open geospatial standards (OGC, INSPIRE): Ensure that defence systems integrate international standards that allow the combined use of open and classified sources.
-
Specialised training: foster the development of capabilities in GEOINT analysis with open data, both in the military domain and in collaboration with universities and technology centres.
-
Civil-military cooperation: establish protocols to facilitate the exchange of data between civilian agencies (AEMET, IGN, Civil Protection) and defence actors in crisis or emergency situations.
- Support to R&D&I: to foster research projects exploring the advanced use of open data (e.g. AI applied to Sentinel) with dual applications (civilian and security).
Conclusion
Geospatial intelligence and the use of open satellite data have transformed the way armed forces and security agencies plan and execute their operations. In a context of multidimensional threats and constantly evolving scenarios, having accurate, accessible and up-to-date information is more than an advantage: it is a strategic necessity.
Open data has established itself as a fundamental asset not only because it is free of charge, but also because of its ability to democratise access to critical information, foster transparency and enable new forms of collaboration between military, civilian and scientific actors. In particular:
- Improve the resilience of defence systems by enabling broader, cross-cutting analysis of the operating environment.
- Increase interoperability, as open formats and standards facilitate exchange between countries and agencies.
- They drive innovationby providing startups, research centres and universities with access to quality data that would otherwise be inaccessible.
In this context, Spain has demonstrated a clear commitment to this strategic vision, both through its national institutions and its active role in European programmes such as Copernicus, Galileo and the common defence missions.
Content prepared by Mayte Toscano, Senior Consultant in Data Economy Technologies. The contents and points of view reflected in this publication are the sole responsibility of the author.
Blog
Geospatial data has driven improvements in a number of sectors, and energy is no exception. This data allows us to better understand our environment in order to promote sustainability, innovation and informed decision-making.
One of the main providers of open geospatial data is Copernicus, the European Union's Earth observation programme. Through a network of satellites called Sentinel and data from ground, sea and airborne sources, Copernicus provides geospatial information freely accessible through various platforms.
Although Copernicus data is useful in many areas, such as fighting climate change, urban planning or agriculture, in this article we will focus on its role in driving sustainability and energy efficiency. The availability of high quality open data fosters innovation in this sector by promoting the development of new tools and applications that improve energy management and use. Here are some examples.
Climate prediction to improve production
Geospatial data provide detailed information on weather conditions, air quality and other factors, which are essential for understanding and predicting environmental phenomena, such as storms or droughts, that affect energy production and distribution.
One example is this project which provides high-resolution wind forecasts to serve the oil and gas, aviation, shipping and defence sectors. It uses data from satellite observations and numerical models, including information on ocean currents, waves and sea surface temperature from the "Copernicus Marine Service". Thanks to its granularity, it can provide an accurate weather forecasting system at a very local scale, allowing a higher level of accuracy in the behaviour of extreme weather and climate phenomena.
Optimisation of resources
The data provided by Copernicus also allows the identification of the best locations for the installation of energy generation centres, such as solar and wind farms, by facilitating the analysis of factors such as solar radiation and wind speed. In addition, they help monitor the efficiency of these facilities, ensuring that they are operating at maximum capacity.
In this regard, a project has been developed to find the best site for a combined floating wind and wave energy system (i.e. based on wave motion). By obtaining both energies with a single platform, this solution saves space and reduces the impact on the ground, while improving efficiency. Wind and waves arrive at different times at the platform, so capturing both elements helps reduce variability and smoothes overall electricity production. Thanks to the Copernicus data (obtained from the Atlantic Service - Biscay Iberia Ireland - Ocean Wave Reanalysis), the provider of this situation was able to obtain separate components of wind and wave waves, which allowed a more complete understanding of the directionality of both elements. This work led to the selection of Biscay Marine Energy Platform (BiMEP). for the deployment of the device.
Another example is Mon Toit Solaire, an integrated web-based decision support system for the development of rooftop photovoltaic power generation. This tool simulates and calculates the energy potential of a PV project and provides users with reliable technical and financial information. It uses solar radiation data produced by the "Copernicus Atmospheric Monitoring Service", together with three-dimensional urban topographic data and simulations of tax incentives, energy costs and prices, allowing the return on investment to be calculated.
Environmental monitoring and impact assessment.
Geospatial information allows for improved environmental monitoring and accurate impact assessments in the energy sector. This data allows energy companies to identify environmental risks associated with their operations, design strategies to mitigate their impact and optimise their processes towards greater sustainability. In addition, they support environmental compliance by providing objective data-driven reporting, encouraging more responsible and environmentally friendly energy development.
Among the challenges posed by the conservation of ocean biodiversity, man-made underwater noise is recognised as a serious threat and is regulated at European level. In order to assess the impact on marine life of wind farms along the southern coast of France, this project uses high-resolution statistical sound maps, which provide a detailed view of coastal processes, with an hourly time frequency and a high spatial resolution of up to 1.8 km. In particular, they use information from the "Mediterranean Sea Physics Analysis and Forecasting" and "World Ocean Hourly Sea Surface Wind and Stress" services.
Emergency and environmental disaster management.
In disaster situations or extreme weather events, geospatial data can help quickly assess damage and coordinate emergency responses more efficiently.
They can also predict how spills will behave. This is the aim of the Marine Research Institute of the University of Klaipeda, which has developed a system for monitoring and forecasting chemical and microbiological pollution episodes using a high-resolution 3D operational hydrodynamic model. They use the Copernicus "Physical Analysis and Forecasts of the Baltic Sea". The model provides real-time, five-day forecasts of water currents, addressing the challenges posed by shallow waters and port areas. It aims to help manage pollution incidents, particularly in pollution-prone regions such as ports and oil terminals.
These examples highlight the usefulness of geospatial data, especially those provided by programmes such as Copernicus. The fact that companies and institutions can freely access this data is revolutionising the energy sector, contributing to a more efficient, sustainable and resilient system.
Blog
The value of open satellite data in Europe
Satellites have become essential tools for understanding the planet and managing resources efficiently. The European Union (EU) has developed an advanced space infrastructure with the aim of providing real-time data on the environment, navigation and meteorology.
This satellite network is driven by four key programmes:.
- Copernicus: Earth observation, environmental monitoring and climate change.
- Galileo: high-precision satellite navigation, alternative to GPS.
- EGNOS: improved positioning accuracy, key to aviation and navigation.
- Meteosat: padvanced meteorological prediction and atmospheric monitoring.
Through these programmes, Europe not only ensures its technological independence, but also obtains data that is made available to citizens to drive strategic applications in agriculture, security, disaster management and urban planning.
In this article we will explore each programme, its satellites and their impact on society, including Spain''s role in each of them.
Copernicus: Europe''s Earth observation network
Copernicus is the EU Earth observation programme, managed by the European Commission with the technical support of the European Space Agency (ESA) and the European Organisation for the Exploitation of Meteorological Satellites (EUMETSAT).. It aims to provide free and open data about the planet to monitor climate change, manage natural resources and respond to emergencies.
The programme is structured into three main components:
- Space component: consists of a series of satellites called Sentinel, developed specifically for the needs of Copernicus. These satellites provide high quality data for various applications, such as land, sea and atmospheric monitoring.
- Component in situ: includes data collected through ground, air and sea stations. These data are essential to calibrate and validate the information obtained by the satellites, ensuring its accuracy and reliability.
- Operational Services: offers six thematic services that transform collected data into useful information for users:
- Atmospheric monitoring
- Marine monitoring
- Terrestrial monitoring
- Climate change
- Emergency management
- Safety
These services provide information in areas such as air quality, ocean status, land use, climate trends, disaster response and security, supporting informed decision-making in Europe.
Spain has played a key role in the manufacture of components for the Sentinel satellites. Spanish companies have developed critical structures and sensors, and have contributed to the development of data processing software. Spain is also leading projects such as the Atlantic Constellation, which will develop small satellites for climate and oceanic monitoring.
Sentinel satellite
| Satellite | Technical characteristics | Resolution | Coverage (capture frequency) | Uses |
|---|---|---|---|---|
| Sentinel-1 | C-band SAR radar, resolution up to 5m | Up to 5m | Every 6 days | Land and ocean monitoring, natural disasters |
| Sentinel-2 | Multispectral camera (13 bands), resolution up to 10m | 10m, 20m, 60m | Every 5 days | Agricultural management, forestry monitoring, water quality |
| Sentinel-3 | Radiometer SLSTR, Spectrometer OLCI, Altimeter SRAL | 300m (OLCI), 500m (SLSTR) | Every 1-2 days | Oceanic, climatic and terrestrial observation |
| Sentinel-5P | Tropomi spectrometer, resolution 7x3.5 km². | 7x3.5 km² | Daily global coverage | Air quality monitoring, trace gases |
| Sentinel-6 | Altimeter Poseidon-4, vertical resolution 1 cm | 1cm | Every 10 days | Sea level measurement, climate change |
Figure 1. Table satellites Sentinel. Source: own elaboration
Galileo: the european GPS
Galileo is the global navigation satellite system developed by the European Union, managed by the European Space Agency (ESA) and operated by the European Union Space Programme Agency (EUSPA). It aims to provide a reliable and highly accurate global positioning service, independent of other systems such as the US GPS, China''s Beidou or Russia''s GLONASS. Galileo is designed for civilian use and offers free and paid services for various sectors, including transport, telecommunications, energy and finance.
Spain has played a leading role in the Galileo programme. The European GNSS Service Centre (GSC), located in Torrejón de Ardoz, Madrid, acts as the main contact point for users of the Galileo system. In addition, Spanish industry has contributed to the development and manufacture of components for satellites and ground infrastructure, strengthening Spain''s position in the European aerospace sector.
| Satellite | Technical characteristics | Resolution | Coverage (capture frequency) | Uses |
|---|---|---|---|---|
| Galileo FOC | Medium Earth Orbit (MEO), 24 operatives | N/A | Continuous | Precise positioning, land and maritime navigation |
| Galileo IOV | First test satellites of the Galileo system | N/A | Continuous | Initial testing of Galileo before FOC |
Figure 2. Satellite Galileo. Source: own elaboration
EGNOS: improving the accuracy of GPS and Galileo
The European Geostationary Navigation Overlay Service (EGNOS) is the European satellite-based augmentation system (Satellite Based Augmentation System or SBAS) designed to improve the accuracy and reliability of global navigation satellite systems ( Global Navigation Satellite System, GNSS), such as GPS and, in the future, Galileo. EGNOS provides corrections and integrity data that allow users in Europe to determine their position with an accuracy of up to 1.5 metres, making it suitable for safety-critical applications such as aviation and maritime navigation.
Spain has played a leading role in the development and operation of EGNOS. Through ENAIRE, Spain hosts five RIMS Reference Stations located in Santiago, Palma, Malaga, Gran Canaria and La Palma. In addition, the Madrid Air Traffic Control Centre, located in Torrejón de Ardoz, hosts one of the EGNOS Mission Control Centres (MCC), operated by ENAIRE. The Spanish space industry has contributed significantly to the development of the system, with companies participating in studies for the next generation of EGNOS.
| Satellite | Technical characteristics | Resolution | Coverage (capture frequency) | Uses |
|---|---|---|---|---|
| EGNOS Geo | Geostationary GNSS correction satellites | N/A | Real-time GNSS correction | GNSS signal correction for aviation and transportation |
Figure 3. Table satellite EGNOS. Source: own elaboration
Meteosat: high precision weather forecasting
The Meteosat programme consists of a series of geostationary meteorological satellites initially developed by the European Space Agency (ESA) and currently operated by the European Organisation for the Exploitation of Meteorological Satellites (EUMETSAT). These satellites are positioned in geostationary orbit above the Earth''s equator, allowing continuous monitoring of weather conditions over Europe, Africa and the Atlantic Ocean. Its main function is to provide images and data to facilitate weather prediction and climate monitoring.
Spain has been an active participant in the Meteosat programme since its inception. Through the Agencia Estatal de Meteorología (AEMET), Spain contributes financially to EUMETSAT and participates in the programme''s decision-making and operations. In addition, the Spanish space industry has played a key role in the development of the Meteosat satellites. Spanish companies have been responsible for the design and supply of critical components for third-generation satellites, including scanning and calibration mechanisms.
| Satellite | Technical characteristics | Resolution | Cobertura (frecuencia de captura) | Usos |
|---|---|---|---|---|
| Meteosat Primera Gen. | Initial weather satellites, low resolution | Low resolution | Every 30min | Basic weather forecast, images every 30 min. |
| Meteosat Segunda Gen. | Higher spectral and temporal resolution, data every 15 min. | High resolution | Every 15min | Improved accuracy, early detection of weather events |
| Meteosat Tercera Gen. | High-precision weather imaging, lightning detection | High resolution | High frequency | High-precision weather imaging, lightning detection |
Figure 4. Metosat satellite. Source: own elaboration
Access to the data of each programme
Each programme has different conditions and distribution platforms in terms of access to data:
- Copernicus: provides free and open data through various platforms. Users can access satellite imagery and products through the Copernicus Data Space Ecosystem, which offers search, download and processing tools. Data can also be obtained through APIs for integration into automated systems.
- Galileo: its open service (Open Service - OS) allows free use of the navigation signals for any user with a compatible receiver, free of charge. However, direct access to raw satellite data is not provided. For information on services and documentation, access is via the European GNSS Services Centre (GSC):
- Galileo Portal.
- Registration for access to the High Accuracy Service (HAS) (registration required).
- EGNOS: This system improves navigation accuracy with GNSS correction signals. Data on service availability and status can be found on the EGNOS User Support platform..
- Meteosat: Meteosat satellite data are available through the EUMETSAT platform. There are different levels of access, including some free data and some subject to registration or payment. For imagery and meteorological products you can access the EUMETSAT Data Centre..
In terms of open access, Copernicus is the only programme that offers open and unrestricted data. In contrast, Galileo and EGNOS provide free services, but not access to raw satellite data, while Meteosat requires registration and in some cases payment for access to specific data.
Conclusions
The Copernicus, Galileo, EGNOS and Meteosat programmes not only reinforce Europe''s space sovereignty, but also ensure access to strategic data essential for the management of the planet. Through them, Europe can monitor climate change, optimise global navigation, improve the accuracy of its positioning systems and strengthen its weather predictioncapabilities, ensuring more effective responses to environmental crises and emergencies.
Spain plays a fundamental role in this space infrastructure, not only with its aerospace industry, but also with its control centres and reference stations, consolidating itself as a key player in the development and operation of these systems.
Satellite imagery and data have evolved from scientific tools to become essential resources for security, environmental management and sustainable growth. In a world increasingly dependent on real-time information, access to this data is critical for climate resilience, spatial planning, sustainable agriculture and ecosystem protection.
The future of Earth observation and satellite navigation is constantly evolving, and Europe, with its advanced space programmes, is positioning itself as a leader in the exploration, analysis and management of the planet from space.
Access to this data allows researchers, businesses and governments to make more informed and effective decisions. With these systems, Europe and Spain guarantee their technological independence and strengthen their leadership in the space sector.
Ready to explore more? Access the links for each programme and discover how this data can transform our world.
| Copernicus | https://dataspace.copernicus.eu/ | Download centre |
|---|---|---|
| Meteosat | https://user.eumetsat.int/data-access/data-centre/ | Download centre |
| Galileo | https://www.gsc-europa.eu/galileo/services/galileo-high-accuracy-servic…/ | Download centre, after registration |
| EGNOS | https://egnos-user-support.essp-sas.eu/ | Project |
Figure 5. Source: own elaboration
Content prepared by Mayte Toscano, Senior Consultant in Data Economy Technologies. The contents and points of view reflected in this publication are the sole responsibility of the author.
Blog
Geospatial data capture is essential for understanding our environment, making informed decisions and designing effective policies in areas such as urban planning, natural resource management or emergency response. In the past, this process was mainly manual and labour-intensive, based on ground measurements made with tools such as total stations and levels. Although these traditional techniques have evolved significantly and are still widely used, they have been complemented by automated and versatile methods that allow more efficient and detailed data collection.
The novelty in the current context lies not only in technological advances, which have improved the accuracy and efficiency of geospatial data collection, but also because it coincides with a widespread shift in mindset towards transparency and accessibility. This approach has encouraged the publication of the data obtained as open resources, facilitating their reuse in applications such as urban planning, energy management and environmental assessment. The combination of advanced technology and an increased awareness of the importance of information sharing marks a significant departure from traditional techniques.
In this article, we will explore some of the new methods of data capture, from photogrammetric flights with helicopters and drones, to ground-based systems such as mobile mapping, which use advanced sensors to generate highly accurate three-dimensional models and maps. In addition, we will learn how these technologies have empowered the generation of open data, democratising access to key geospatial information for innovation, sustainability and public-private collaboration.
Aerial photogrammetry: helicopters with advanced sensors
In the past, capturing geospatial data from the air involved long and complex processes. Analogue cameras mounted on aircraft generated aerial photographs that had to be processed manually to create two-dimensional maps. While this approach was innovative at the time, it also had limitations, such as lower resolution, long processing times and greater dependence on weather and daylight. However, technological advances have reduced these restrictions, even allowing operations at night or in adverse weather conditions.
Today, aerial photogrammetry has taken a qualitative leap forward thanks to the use of helicopters equipped with state-of-the-art sensors. The high-resolution digital cameras allow images to be captured at multiple angles, including oblique views that provide a more complete perspective of the terrain. In addition, the incorporation of thermal sensors and LiDAR (Light Detection and Ranging) technologies adds an unprecedented layer of detail and accuracy. These systems generate point clouds and three-dimensional models that can be integrated directly into geospatial analysis software, eliminating much of the manual processing.
| Features | Advantages | Disadvantages |
|---|---|---|
| Coverage and flexibility | It allows coverage of large areas and access to complex terrain. | May be limited for use in areas with airspace restrictions. Inaccessible to undergrouns or difficult to access areas such as tunnels. |
| Data type | Capture visual, thermal and topographic data in a single flight. | - |
| Precision | Generates point clouds and 3D models with high accuracy. | - |
| Efficiency in large projects | It allows coverage of large areas where drones do not have sufficient autonomy. | High operational cost compared to other technologies. |
|
Environmental impact and noise
|
- | Generates noise and greater environmental impact, limiting its use in sensitive areas. |
| Weather conditions | - | It depends on the weather; adverse conditions such as wind or rain affect its operation. |
| Amortised | - | High cost compared to drones or ground-based methods. |
Figure 1. Table with advantages and disadvantages of aerial photogrammetry with helicopters.
Mobile mapping: from backpacks to BIM integration
The mobile mapping is a geospatial data capture technique using vehicles equipped with cameras, LiDAR scanners, GPS and other advanced sensors. This technology allows detailed information to be collected as the vehicle moves, making it ideal for mapping urban areas, road networks and dynamic environments.
In the past, topographic surveys required stationary measurements, which meant traffic disruptions and considerable time to cover large areas. In contrast, mobile mapping has revolutionised this process, allowing data to be captured quickly, efficiently and with less impact on the environment. In addition, there are portable versions of this technology, such as backpacks with robotic scanners, which allow access to pedestrian or hard-to-reach areas.
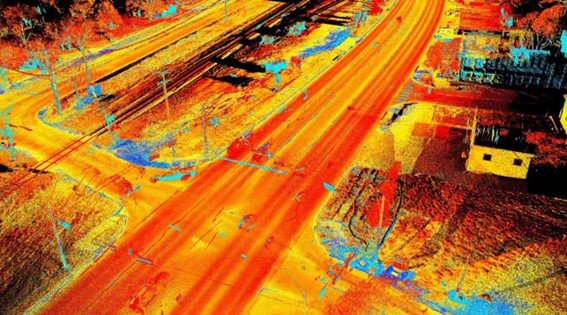
Figure 2. Image captured with mobile mapping techniques.
| Features | Advantages | Disadvantages |
|---|---|---|
| Speed | Captures data while the vehicle is on the move, reducing operating times. | Lower accuracy in areas with poor visibility for sensors (e.g. tunnels). |
| Urban coverage | Ideal for urban environments and complex road networks. | It is efficient in areas where vehicles can circulate, but its range is limited such as in rural or inaccessible terrain. |
| Flexibility of implementation | Available in portable (backpack) versions for pedestrian or hard-to-reach areas. | Portable equipment tends to have a shorter range than vehicular systems. |
| GIS and BIM implementation | It facilitates the generation of digital models and their use in planning and analysis. | Requires advanced software to process large volumes of data. |
| Impact on the environment | It does not require traffic interruptions or exclusive access to work areas. | Dependence on optimal environmental conditions, such as adequate light and climate. |
| Accessibility | Accessible to underground or hard-to-reach areas such as tunnels |
Figure 3. Table with advantages and disadvantages of mobile mopping.
The mobile mapping is presented as a versatile and efficient solution for capturing geospatial data on the move, becoming a key tool for the modernisation of urban and territorial management systems.
HAPS and ballons: new heights for information capture
HAPS (High-Altitude Platform Stations) and hot-air balloons represent an innovative and efficient alternative for capturing geospatial data from high altitudes. These platforms, located in the stratosphere or at controlled altitudes, combine features of drones and satellites, offering an intermediate solution that stands out for its versatility and sustainability:
- HAPS, like zeppelins and similar aircraft, operate in the stratosphere, at altitudes between 18 and 20 kilometres, allowing a wide and detailed view of the terrain.
- The aerostatic balloons, on the other hand, are ideal for local or temporary studies, thanks to their easiness of deployment and operation at lower altitudes.
Both technologies can be equipped with high-resolution cameras, LiDAR sensors, thermal instruments and other advanced technologies for data capture.
| Features | Advantages | Disadvantages |
|---|---|---|
| Useful | Large capture area, especially with HAPS in the stratosphere. | Limited coverage compared to satellites in orbit. |
| Sustainability | Lower environmental impact and energy footprint compared to helicopters or aeroplanes. | Dependence on weather conditions for deployment and stability. |
| Amortised | Lower operating costs than traditional satellites. | Higher initial investment than drones or ground equipment. |
| Versatility | Ideal for temporary or emergency projects. | Limited range in hot air balloons. |
| Duration of operation | HAPS can operate for long periods (days or weeks). | Hot air balloons have a shorter operating time. |
Figure 4. Table with advantages and disadvantages of HAPS and ballons
HAPS and balloons are presented as key tools to complement existing technologies such as drones and satellites, offering new possibilities in geospatial data collection in a sustainable, flexible and efficient way. As these technologies evolve, their adoption will expand access to crucial data for smarter land and resource management.
Satellite technology: PAZ satellite and its future with PAZ-2
Satellite technology is a fundamental tool for capturing geospatial data globally. Spain has taken significant steps in this field with the development and launch of the PAZ satellite. This satellite, initially designed for security and defence purposes, has shown enormous potential for civilian applications such as environmental monitoring, natural resource management and urban planning.
PAZ is an Earth observation satellite equipped with a synthetic aperture radar (SAR), which allows high-resolution imaging, regardless of weather or light conditions.
The upcoming launch of PAZ-2 (planned for 2030) promises to further expand Spain''s observation capabilities. This new satellite, designed with technological improvements, aims to complement the functions of PAZ and increase the availability of data for civil and scientific applications. Planned improvements include:
- Higher image resolution.
- Ability to monitor larger areas in less time.
- Increased frequency of captures for more dynamic analysis.
| Feature | Advantages | Disadvantages |
|---|---|---|
| Global coverage | Ability to capture data from anywhere on the planet. | Limitations in resolution compared to more detailed terrestrial technologies. |
| Climate independance | SAR sensors allow captures even in adverse weather conditions. | |
| Data frequency | PAZ-2 will improve the frequency of captures, ideal for continuous monitoring. | Limited time in the lifetime of the satellite. |
| Access to open data | It encourages re-use in civil and scientific projects. | Requires advanced infrastructure to process large volumes of data. |
Figure 5. Table with advantages and disadvantages of PAZ and PAZ-2 satellite technology
With PAZ and the forthcoming PAZ-2, Spain strengthens its position in the field of satellite observation, opening up new opportunities for efficient land management, environmental analysis and the development of innovative solutions based on geospatial datas. These satellites are not only a technological breakthrough, but also a strategic tool to promote sustainability and international cooperation in data access.
Conclusion: challenges and opportunities in data management
The evolution of geospatial data capture techniques offers a unique opportunity to improve the accuracy, accessibility and quality of data, and in the specific case of open data, it is essential to foster transparency and re-use of public information. However, this progress cannot be understood without analysing the role played by technological tools in this process.
Innovations such as LiDAR in helicopters, Mobile Mapping, SAM, HAPS and satellites such as PAZ and PAZ-2 not only optimise data collection, but also have a direct impact on data quality and availability.
In short, these technological tools generate high quality information that can be made available to citizens as open data, a situation that is being driven by the shift in mindset towards transparency and accessibility. This balance makes open data and technological tools complementary, essential to maximise the social, economic and environmental value of geospatial data.
You can see a summary of these techniques and their applications in the following infographic:
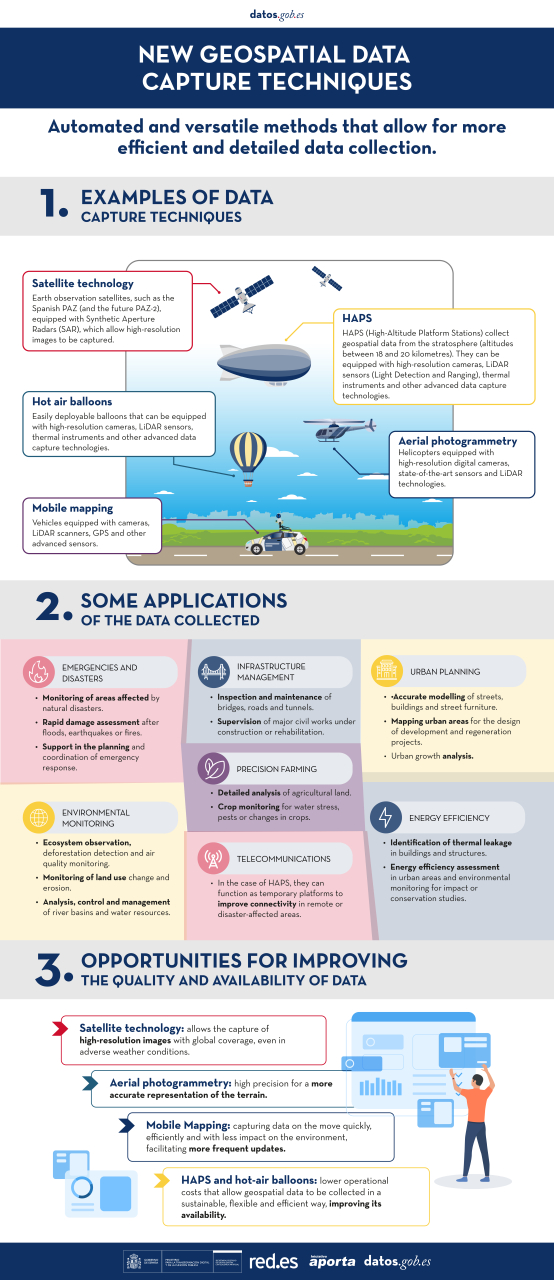
Content prepared by Mayte Toscano, Senior Consultant in Data Economy Technologies. The contents and points of view reflected in this publication are the sole responsibility of the author.