Blog
In February 2024, the European geospatial community took a major step forward with the first major update of the INSPIRE implementation schemes in almost a decade. This update, which generates version 5.0 of the schemas, introduces changes that affect the way spatial data are harmonised, transformed and published in Europe. For implementers, policy makers and data users, these changes present both challenges and opportunities.
In this article, we will explain what these changes entail, how they impact on data validation and what steps need to be taken to adapt to this new scenario.
What is INSPIRE and why does it matter?
The INSPIRE Directive (Infrastructure for Spatial Information in Europe) determines the general rules for the establishment of an Infrastructure for Spatial Information in the European Community based on the Member States'' Infrastructures. Adopted by the European Parliament and the Council on March 14, 2007 (Directive 2007/2/EC), it is designed to achieve these objectives by ensuring that spatial information is consistent and accessible across EU member countries.
A key element of INSPIRE is the “application schemas”.These schemas define how data should be structured to comply with INSPIRE standards, ensuring that data from different countries are compatible with each other. In addition, the schemes make data validation easier with official tools, ensuring their quality and compliance with European standards.
What changes with the 5.0 upgrade?
The transition to version 5.0 brings significant modifications, some of which are not backwards compatible. Among the most notable changes are:
- Removal of mandatory properties: this simplifies data models, but requires implementers to review their previous configurations and adjust the data to comply with the new rules.
- Renaming of types and properties: with the update of the INSPIRE schemas to version 5.0, some element names and definitions have changed. This means that data that were harmonised following the 4.x schemas no longer exactly match the new specifications. In order to keep these data compliant with current standards, it is necessary to re-transform them using up-to-date tools. This re-transformation ensures that data continues to comply with INSPIRE standards and can be shared and used seamlessly across Europe. The complete table with these updates is as follows:
| Schema | Description of the change | Type of change | Latest version |
|---|---|---|---|
| ad | Changed the data type for the "building" association of the entity type Address. | Non-disruptive | v4.1 |
| au | Removed the enumeration from the schema and changed the encoding of attributes referring to enumerations. | Disruptive | v5.0 |
| BaseTypes.xsd | Removed VerticalPositionValue enumeration from BaseTypes schema. | Disruptive | v4.0 |
| ef | Added a new attribute "thematicId" to the AbstractMonitoringObject spatial object type | Non-disruptive | v4.1 |
| el-cov | Changed the encoding of attributes referring to enumerations. | Disruptive | v5.0 |
| ElevationBaseTypes.xsd | Deleted outline enumeration. | Disruptive | v5.0. |
| el-tin | Changed the encoding of attributes referring to enumerations. | Disruptive | v5.0 |
| el-vec | Removed the enumeration from the schema and changed the encoding of attributes referring to enumerations. | Disruptive | v5.0 |
| hh | Added new attributes to the EnvHealthDeterminantMeasure type, new entity types and removed some data types. | Disruptive | v5.0 |
| hy | Updated to version 5.0 as the schema imports the hy-p schema which was updated to version 5. | Disruptive y non-disruptive | v5.0 |
| hyp | Changed the data type of the geometry attribute of the DrainageBasin type. | Disruptive y non- disruptive | v5.0 |
| lcv | Added association role to the LandCoverUnit entity type. | Disruptive | v5.0 |
| mu | Changed the encoding of attributes referring to enumerations. | Disruptive | v4.0 |
| nz-core | Removed the enumeration from the schema and changed the encoding of attributes referring to enumerations. | Disruptive | v5.0 |
| ObservableProperties.xsd | Removed the enumeration from the schema and changed the encoding of attributes referring to enumerations. | Disruptive | v4.0 |
| pf | Changed the definition of the ProductionInstallation entity type. | Non-disruptive | v4.1 |
| plu | Fixed typo in the "backgroudMapURI" attribute of the BackgroundMapValue data type. | Disruptive | v4.0.1 |
| ps | Fixed typo in inspireId, added new attribute, and moved attributes to data type. | Disruptive | v5.0 |
| sr | Changed the stereotype of the ShoreSegment object from featureType to datatype. | Disruptive | v4.0.1 |
| su-vector | Added a new attribute StatisticalUnitType to entity type VectorStatisticalUnit | Non-disruptive | v4.1 |
| tn | Removed the enumeration from the schema and changed the encoding of attributes referring to enumerations. | Disruptive | v5.0 |
| tn-a | Changed the data type for the "controlTowers" association of the AerodromeNode entity type. | Non-disruptive | v4.1 |
| tn-ra | Removed enumerations from the schema and changed the encoding of attributes referring to enumerations. | Disruptive | v5.0 |
| tn-ro | Removed enumerations from the schema and changed the encoding of attributes referring to enumerations. | Disruptive | v5.0 |
| tn-w | Removed the abstract stereotype for the entity type TrafficSeparationScheme. Removed enumerations from the schema and changed the encoding of attributes referring to enumerations | Disruptive y non disruptive | v5.0 |
| us-govserv | Updated the version of the imported us-net-common schema (from 4.0 to 5.0). | Disruptive | v5.0 |
| us-net-common | Defined the data type for the authorityRole attribute. Changed the encoding of attributes referring to enumerations. | Disruptive | v5.0 |
| us-net-el | Updated the version of the imported us-net-common schema (from 4.0 to 5.0). | Disruptive | v5.0 |
| us-net-ogc | Updated the version of the imported us-net-common schema (from 4.0 to 5.0). | Disruptive | v5.0 |
| us-net-sw | Updated the version of the imported us-net-common schema (from 4.0 to 5.0). | Disruptive | v5.0 |
| us-net-th | Updated the version of the imported us-net-common schema (from 4.0 to 5.0). | Disruptive | v5.0 |
| us-net-wa | Updated the version of the imported us-net-common schema (from 4.0 to 5.0). | Disruptive | v5.0 |
Figure 1. Latest INSPIRE updates.
- Major changes in version 4.0: although normally a major change in a schema would lead to a new major version (e.g. from 4.0 to 5.0), some INSPIRE schemas in version 4.0 have received significant updates without changing version number. A notable example of this is the Planned Land Use (PLU) scheme. These updates imply that projects and services using the PLU scheme in version 4.0 must be reviewed and modified to adapt to the new specifications. This is particularly relevant for those working with XPlanung, a standard used in urban and land use planning in some European countries. The changes made to the PLU scheme oblige implementers to update their transformation projects and republish data to ensure that they comply with the new INSPIRE rules.
Impact on validation and monitoring
Updating affects not only how data is structured, but also how it is validated. The official INSPIRE tools, such as the Validador, have incorporated the new versions of the schemas, which generates different validation scenarios:
- Data conforming to previous versions: data harmonised to version 4.x can still pass basic validation tests, but may fail specific tests requiring the use of the updated schemas.
- Specific tests for updated themes: some themes, such as Protected Sites, require data to follow the most recent versions of the schemas to pass all compliance tests.
In addition, the Joint Research Center (JRC) has indicated that these updated versions will be used in official INSPIRE monitoring from 2025 onwards, underlining the importance of adapting as soon as possible.
What does this mean for consumers?
To ensure that data conforms to the latest versions of the schemas and can be used in European systems, it is essential to take concrete steps:
- If you are publishing new datasets: use the updated versions of the schemas from the beginning.
- If you are working with existing data: update the schemas of your datasets to reflect the changes you have made. This may involve adjusting types of features and making new transformations.
- Publishing services: If your data is already published, you will need to re-transform and republish it to ensure it conforms to the new specifications.
These actions are essential not only to comply with INSPIRE standards, but also to ensure long-term data interoperability.
Conclusion
The update to version 5.0 of the INSPIRE schemas represents a technical challenge, but also an opportunity to improve the interoperability and usability of spatial data in Europe. Adopting these modifications not only ensures regulatory compliance, but also positions implementers as leaders in the modernisation of spatial data infrastructure.
Although the updates may seem complex, they have a clear purpose: to strengthen the interoperability of spatial data in Europe. With better harmonised data and updated tools, it will be easier for governments, businesses and organisations to collaborate and make informed decisions on crucial issues such as sustainability, land management and climate change.
Furthermore, these improvements reinforce INSPIRE''s commitment to technological innovation, making European spatial data more accessible, useful and relevant in an increasingly interconnected world.
Content prepared by Mayte Toscano, Senior Consultant in Data Economy Technologies. The contents and points of view reflected in this publication are the sole responsibility of its author.
Blog
In the field of geospatial data, encoding and standardisation play a key role in ensuring interoperability between systems and improving accessibility to information.
The INSPIRE Directive (Infrastructure for Spatial Information in Europe) determines the general rules for the establishment of an Infrastructure for Spatial Information in the European Community based on the Member States' Infrastructures. Adopted by the European Parliament and the Council on March 14, 2007 (Directive 2007/2/EC), it is designed to achieve these objectives by ensuring that spatial information is consistent and accessible across EU member countries.
Among the various encodings available for INSPIRE datasets, the GeoPackage standard emerges as a flexible and efficient alternative to traditional formats such as GML or GeoJSON. This article will explore how GeoPackage can improve INSPIRE data management and how it can be implemented using tools such as hale studio, a visual platform that facilitates data transformation according to INSPIRE specifications.
What is GeoPackage?
GeoPackage es un estándar desarrollado por el Open Geospatial Consortium (OGC) que utiliza SQLite como base para almacenar información geoespacial de manera compacta y accesible. Unlike other formats that require intermediate transformation processes, the data in a GeoPackage file can be read and updated directly in its native format. This allows for more efficient read and write operations, especially in GIS applications.
Main features of GeoPackage
- Open format and standard: as an open standard, GeoPackage is suitable for the publication of open spatial data, facilitating access to geospatial data in formats that users can handle without costly licensing or usage restrictions.
- Unique container: a GeoPackage file can store vector data, image mosaics and non-spatial data.
- Compatibility: is supported by several GIS platforms, including QGIS and ArcGIS, as well as ETL tools such as FME.
- Spatial indexing: the format includes spatial indexes (RTree) that allow faster data search and manipulation.
For more technical details, please refer to the GeoPackage standard on the OGC website.
Why use GeoPackage in INSPIRE?
INSPIRE requires spatial data to be interoperable at European level, and its default encoding standard is GML. However, GeoPackage is offered as an alternative that can reduce complexity in certain use cases, especially those where performance and usability are crucial.
The use of GeoPackage within INSPIRE is supported by good practices developed to create optimised logical models for ease of use in GIS environments. These practices allow the creation of use-case specific schemas and offer a flexibility that other formats do not provide. In addition, GeoPackage is especially useful in scenarios where medium to large datasets are handled, as its compact format reduces file size and therefore facilitates data exchange.
Implementation of GeoPackage in INSPIRE using Hale Studio
One of the recommended tools to implement GeoPackage in INSPIRE is the software open-source hale studio. This data transformation software allows mapping and transforming data models visually and without programming.
The following describes the basic steps for transforming an INSPIRE-compliant dataset using hale studio:
- Load the source model: import the dataset in its original format, such as GML.
- Define the target model (GeoPackage): load a blank GeoPackage file to act as the target model for storing the transformed data.
- Configure data mapping: through the hale visual interface, map attributes and apply transformation rules to ensure compliance with the INSPIRE GeoPackage model.
- Export the dataset: once the transformation has been validated, export the file in GeoPackage format.
Hale studio facilitates this transformation and enables data models to be optimised for improved performance in GIS environments. More information about hale studio and its transformation capabilities is available on its official website.
Examples of implementation
The application of the GeoPackage standard in INSPIRE has already been tested in several use cases, providing a solid framework for future implementations.
-
Environmental Noise Directive (END): in this context, GeoPackage has been used to store and manage noise-related data, aligning the models with INSPIRE specifications. The European Environment Agency (EEA) provides templates and guidelines to facilitate this implementation, available in its repository.
- Project GO-PEG: this project uses GeoPackage to develop 3D models in geology, allowing the detailed representation of geological areas, such as the Po basin in Italy. Guidelines and examples of GO-PEG implementation are available here.
These examples illustrate how GeoPackage can improve the efficiency and usability of INSPIRE data in practical applications, especially in GIS environments that require fast and direct manipulation of spatial data.
The implementation of GeoPackage in the framework of INSPIRE demonstrates its applicability for open data at the European level. Initiatives such as the Environmental Noise Directive (END) and the GO-PEG Project have shown how open data in GeoPackage can serve multiple sectors, from environmental management to geological surveys.
Benefits of GeoPackage for data providers and data users
The adoption of GeoPackage in INSPIRE offers benefits for both data generators and data consumers:
- For suppliers: GeoPackage's simplified model reduces coding errors and improves data harmonisation, making it easier to distribute data in compact formats.
- For users: compatibility with GIS tools allows access to data without the need for additional transformations, improving the consumption experience and reducing loading and consultation times.
Limitations and challenges
While GeoPackage is a robust alternative, there are some challenges to consider:
-
Interoperability limitations: unlike GML, GeoPackage is not compatible with all network data publishing services, although advances in protocols such as STAC are improving these limitations.
- Optimisation for large datasets: although GeoPackage is optimal for medium to large datasets, file size can be a constraint on extremely large data or low bandwidth networks.
Conclusion
The incorporation of the GeoPackage standard into INSPIRE represents a significant advance for the management and distribution of spatial data in Europe, promoting a more efficient and accessible spatial data infrastructure. This approach contributes to the interoperability of data and facilitates its use in various GIS systems, improving the experience of both providers and users.
For those wishing to implement this format, tools such as hale studio offer practical and accessible solutions that simplify the INSPIRE data transformation process. With the adoption of best practices and the use of optimised data models, GeoPackage can play a crucial role in the future of spatial data infrastructure in Europe. In addition, this approach aligned with the principles of transparency and data reuse allows administrations and organisations to take advantage of open data to support informed decision-making and the development of innovative applications in various areas.
Content prepared by Mayte Toscano, Senior Consultant in Data Economy Technologies. The contents and points of view reflected in this publication are the sole responsibility of its author.
Evento
Spatial and geospatial data are essential for decision-making, spatial planning and resource management. The ability to visualise and analyse data in a spatial context offers valuable tools to address complex challenges in areas ranging from defence to sustainability. Participating in events that address these issues not only broadens our knowledge, but also fosters collaboration and innovation in the sector.
In this post, we present two upcoming events dealing with geospatial data and its most innovative uses. Don't miss them!
II Conference on Geospatial Intelligence: Territory and Defence
The Instituto Geográfico de Aragón (IGEAR) in collaboration with the Academia General Militar, the Centro Universitario de la Defensa and Telespazio Ibérica, has organized the second edition of the Jornada de Inteligencia Geoespacial: Territory and Defence, an event that will bring together professionals from the sector to explore how geospatial data can optimize strategies in the field of security and territorial management.
During the next 21 November, the crown room of the Pignatelli Building in Zaragoza will bring together speakers and attendees to discuss the impact of geospatial intelligence in Spain. The event will be open to a maximum of 100 attendees by invitation.
Geospatial intelligence, or GEOINT for short, focuses on understanding the dynamics occurring within a given geographic space.To achieve this, GEOINT relies on detailed analysis of imagery, databases and other relevant information, based on the idea that, although the circumstances surrounding each situation may vary, there is one common characteristic: all action takes place at specific geographic coordinates.
GEOINT is a very broad field that can be applied both in the military field, to execute movements by analyzing the terrain, and in the scientific field , to study environments, or even in the business field, to help adapt census, historical, meteorological, agricultural and geological information to commercial uses.
The II Geospatial Intelligence Conference will present case studies and technological advances and will promote discussions on the future of geospatial intelligence in defense contexts. For more details, you can visit the event's website.
- When? On 21 November 2024 at 8:00h.
- Wheree? Crown Hall of the Pignatelli Building. Paseo María Agustín, 36. Zaragoza.
- How to access? Through this link.
XV Edition of the Iberian Conference on Spatial Data Infrastructures (JIIDE) and III geoEuskadi
This year, the Board of Directors of the Geographic Information Infrastructure of Spain (CODIIGE) is jointly organizing the Iberian Conference on Spatial Data Infrastructures (JIIDE ) and the III geoEuskadi Kongresua Congress. Both events aim to enhance and promote activities related to geographic information in various sectors, covering both the publication and standardized accessibility of geographic data as well as its production, processing and exploitation.
On the one hand, in the JIIDE collaborate the Direção-Geral do Território de Portugal, the Instituto Geográfico Nacional de España, through the Centro Nacional de Información Geográfica, and the Govern d'Andorra.
The geoEuskadi Kongresua is organised by the Directorate of Territorial Planning and Urban Agenda of the Basque Government. This year, all these entities will come together to carry out a single event under the slogan “The value of geospatial data”.
The conference will focus on new technological trends related to data accessibility and reuse, as well as current techniques for Earth observation and representation.
Digital geospatial data is a key driver for economic growth, competitiveness, innovation, job creation and social progress. Therefore, III geoEuskadi and the XV edition JIIDE 2024 will emphasize the importance of technologies, such as big data and artificial intelligence, to generate ideas that improve business decision making and the creation of systems that perform tasks that traditionally require human intervention.
In addition, collaboration for the co-production and harmonization of data between different administrations and organizations will be highlighted, something that continues to be essential to generate valuable geospatial data that can become true references. This is a time of renewal, driven by the revision of the INSPIRE Directive, the update of the regulations on environmental spatial data and the new regulations on open data and data governance that favor a modernization in the publication and reuse of these data.
During the event, examples of reuse of high-value datasets will also be presented, both through OGC APIs and through download services and interoperable formats.
The combination of these events will represent a privileged space to reflect on geographic information and will be a showcase for the most innovative projects in the Iberian Peninsula. In addition, there will be technical workshops to share specific knowledge and round tables to promote debate. To learn more about this event, visit the JIIDE portal..
- When? From 13 to 15 November.
- Where? Europa Conference Centre (Vitoria-Gasteiz).
- How do I register? Through this link.
Don't miss the opportunity to participate in these events that promote the advancement of the use of spatial and geospatial data. We encourage you to join this conference to learn, collaborate and contribute to the development of this constantly evolving sector.
Blog
Open data can transform how we interact with our cities, offering opportunities to improve quality of life. When made publicly available, they enable the development of innovative applications and tools that address urban challenges, from accessibility to road safety and participation.
Real-time information can have positive impacts on citizens. For example, applications that use open data can suggest the most efficient routes, considering factors such as traffic and ongoing construction; information on the accessibility of public spaces can improve mobility for people with disabilities; data on cycling or pedestrian routes encourages greener and healthier modes of transport; and access to urban data can empower citizens to participate in decision-making about their city. In other words, citizen use of open data not only improves the efficiency of the city and its services, but also promotes a more inclusive, sustainable and participatory city.
To illustrate these ideas, this article discusses maps for "navigating" cities, made with open data. In other words, initiatives are shown that improve the relationship between citizens and their urban environment from different aspects such as accessibility, school safety and citizen participation. The first project is Mapcesible, which allows users to map and assess the accessibility of different locations in Spain. The second, Eskola BideApp, a mobile application designed to support safe school routes. And finally, maps that promote transparency and citizen participation in urban management. The first identifies noise pollution, the second locates available services in various areas within 15 minutes and the third displays banks in the city. These maps use a variety of public data sources to provide a detailed overview of different aspects of urban life.
The first initiative is a project of a large foundation, the second a collaborative and local proposal, and the third a personal project. Although they are based on very different approaches, all three have in common the use of public and open data and the vocation to help people understand and experience the city. The variety of origins of these projects indicates that the use of public and open data is not limited to large organisations.
Below is a summary of each project, followed by a comparison and reflection on the use of public and open data in urban environments.
Mapcesible, map for people with reduced mobility
Mapcessible was launched in 2019 to assess the accessibility of various spaces such as shops, public toilets, car parks, accommodation, restaurants, cultural spaces and natural environments.

Figure 1. Mapcesible. Source: https://mapcesible.fundaciontelefonica.com/intro
This project is supported by organizations such as the NGO Spanish Confederation of People with Physical and Organic Disabilities (COCEMFE) and the company ILUNION. It currently has more than 40,000 evaluated accessible spaces and thousands of users.

Figure 2. Mapcesible. Source: https://mapcesible.fundaciontelefonica.com/filters
Mapcesible uses open data as part of its operation. Specifically, the application incorporates fourteen datasets from official bodies, including the Ministry of Agriculture and Environment, city councils of different cities (including Madrid and Barcelona) and regional governments. This open data is combined with information provided by the users of the application, who can map and evaluate the accessibility of the places they visit. This combination of official data and citizen collaboration allows Mapcesible to provide up-to-date and detailed information on the accessibility of various spaces throughout Spain, thus benefiting people with reduced mobility.
Eskola BideAPP, application to define safe school routes.
Eskola BideAPP is an application developed by Montera34 - a team dedicated to data visualisation and the development of collaborative projects - in alliance with the Solasgune Association to support school pathways. Eskola BideAPP has served to ensure that boys and girls can access their schools safely and efficiently. The project mainly uses public data from the OpenStreetMap, e.g. geographical and cartographic data on streets, pavements, crossings, as well as data collected during the process of creating safe routes for children to walk to school in order to promote their autonomy and sustainable mobility.
The application offers an interactive dashboard to visualise the collected data, the generation of paper maps for sessions with students, and the creation of reports for municipal technicians. It uses technologies such as QGIS (a free and open source geographic information system) and a development environment for the R programming language, dedicated to statistical computing and graphics.
The project is divided into three main stages:
- Data collection through questionnaires in classrooms.
- Analysis and discussion of results with the children to co-design personalised routes.
- Testing of the designed routes.
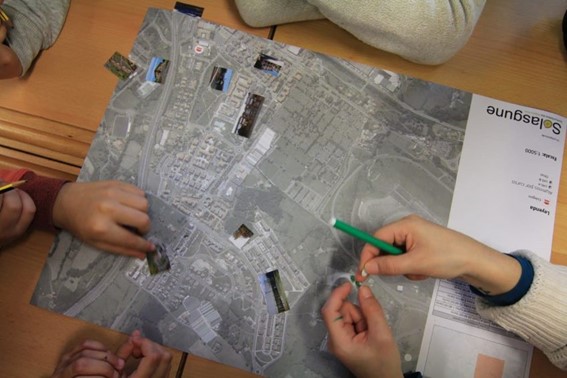
Figure 3. Eskola BideaAPP. Photo by Julián Maguna (Solasgune). Source: https://montera34.com/project/eskola-bideapp/
Pablo Rey, one of the promoters of Montera34 together with Alfonso Sánchez, reports for this article that Eskola BideAPP, since 2019, has been used in eight municipalities, including Derio, Erandio, Galdakao, Gatika, Plentzia, Leioa, Sopela and Bilbao. However, it is currently only operational in the latter two. "The idea is to implement it in Portugalete at the beginning of 2025," he adds.
It''s worth noting the maps from Montera34 that illustrated the effect of Airbnb in San Sebastián and other cities, as well as the data analyses and maps published during the COVID-19 pandemic, which also visualized public data.In addition, Montera34 has used public data to analyse abstention, school segregation, minor contracts or make open data available to the public. For this last project, Montera34 has started with the ordinances of the Bilbao City Council and the minutes of its plenary sessions, so that they are not only available in a PDF document but also in the form of open and accessible data.
Mapas de Madrid sobre contaminación acústica, servicios y ubicación de bancos
Abel Vázquez Montoro has made several maps with open data that are very interesting, for example, the one made with data from the Strategic Noise Map (MER) offered by the Madrid City Council and land registry data. The map shows the noise affecting each building, facade and floor in Madrid.

Figure 4. Noise maps in Madrid. Source: https://madb.netlify.app/.
This map is organised as a dashboard with three sections: general data of the area visible on the map, dynamic 2D and 3D map with configurable options and detailed information on specific buildings. It is an open, free, non-commercial platform that uses free and open source software such as GitLab - a web-based Git repository management platform - and QGIS. The map allows the assessment of compliance with noise regulations and the impact on quality of life, as it also calculates the health risk associated with noise levels, using the attributable risk ratio (AR%).
15-minCity is another interactive map that visualises the concept of the "15-minute city" applied to different urban areas, i.e. it calculates how accessible different services are within a 15-minute walking or cycling radius from any point in the selected city.

Figure 5. 15-minCity. Source: https://whatif.sonycsl.it/15mincity/15min.php?idcity=9166
Finally, "Where to sit in Madrid" is another interactive map that shows the location of benches and other places to sit in public spaces in Madrid, highlighting the differences between rich (generally with more public seating) and poor (with less) neighbourhoods. This map uses the map-making tool, Felt, to visualise and share geospatial information in an accessible way. The map presents different types of seating, including traditional benches, individual seats, bleachers and other types of seating structures.

Figure 6. Where to sit in Madrid. Source: https://felt.com/map/Donde-sentarse-en-Madrid-TJx8NGCpRICRuiAR3R1WKC?loc=40.39689,-3.66392,13.97z
Its maps visualise public data on demographic information (e.g. population data by age, gender and nationality), urban information on land use, buildings and public spaces, socio-economic data (e.g. income, employment and other economic indicators for different districts and neighbourhoods), environmental data, including air quality, green spaces and other related aspects, and mobility data.
What do they have in common?
| Name | Promoter | Type of data used | Profit motive | Users | Characteristics |
|---|---|---|---|---|---|
| Mapcesible | Telefónica Foundation | Combines user-generated and public data (14 open data sets from government agencies) | Non-profit | More than 5.000 | Collaborative app, available on iOS and Android, more than 40,000 mapped accessible points. |
| Eskola BideAPP | Montera34 and Solasgune Association | Combines user-generated and public data (classroom questionnaires) and some public data. | Non-profit. | 4.185 | Focus on safe school routes, uses QGIS and R for data processing |
| Mapa Estratégico de Ruido (MER) | Madrid City Council | 2D and 3D geographic and visible area data | Non-profit | No data | It allows the assessment of compliance with noise regulations and the impact on quality of life, as it also calculates the associated health risk. |
| 15 min-City | Sony GSL | Geographic data and services | Non-profit | No data | Interactive map visualising the concept of the "15-minute city" applied to different urban areas. |
| MAdB "Dónde sentarse en Madrid" | Private | Public data (demographic, electoral, urban, socio-economic, etc.) | Non-profit | No data | Interactive maps of Madrid |
Figure 7. Comparative table of solutions
These projects share the approach of using open data to improve access to urban services, although they differ in their specific objectives and in the way information is collected and presented. Mapcesible, Eskola BideApp, MAdB and "Where to sit in Madrid" are of great value.
On the one hand, Mapcesible offers unified and updated information that allows people with disabilities to move around the city and access services. Eskola BideApp involves the community in the design and testing of safe routes for walking to school; this not only improves road safety, but also empowers young people to be active agents in urban planning. In the meantime, 15-min city, MER and the maps developed by Vázquez Montoro visualise complex data about Madrid so that citizens can better understand how their city works and how decisions that affect them are made.
Overall, the value of these projects lies in their ability to create a data culture, teaching how to value, interpret and use information to improve communities.
Content created by Miren Gutiérrez, PhD and researcher at the University of Deusto, expert in data activism, data justice, data literacy, and gender disinformation. The contents and viewpoints reflected in this publication are the sole responsibility of the author.
Entrevista
In this episode we will delve into the importance of three related categories of high-value datasets. These are Earth observation and environmental data, geospatial data and mobility data. To tell us about them, we have interviewed two experts in the field:
- Paloma Abad Power, deputy director of the National Centre for Geographic Information (CNIG).
- Rafael Martínez Cebolla, geographer of the Government of Aragón.
With them we have explored how these high-value datasets are transforming our environment, contributing to sustainable development and technological innovation.
Listen to the full podcast (only available in Spanish)
Summary / Transcript of the interview
1. What are high-value datasets and why are their important?
Paloma Abad Power: According to the regulation, high-value datasets are those that ensure highest socio-economic potential and, for this, they must be easy to find, i.e. they must be accessible, interoperable and usable. And what does this mean? That means that the datasets must have their descriptions, i.e. the online metadata, which report the statistics and their properties, and which can be easily downloaded or used.
In many cases, these data are often reference data, i.e. data that serve to generate other types of data, such as thematic data, or can generate added value.
Rafael Martínez Cebolla: They could be defined as those datasets that represent phenomena that are useful for decision making, for any public policy or for any action that a natural or legal person may undertake.
In this sense, there are already some directives, which are not so recent, such as the Water Framework Directive or the INSPIRE Directive, which motivated this need to provide shared data under standards that drive the sustainable development of our society.
2. These high-value data are defined by a European Directive and an Implementing Regulation which dictated six categories of high-value datasets. On this occasion we will focus on three of them: Earth observation and environmental data, geospatial data and mobility data. What do these three categories of data have in common and what specific datasets do they cover?
Paloma Abad Power: In my opinion, these data have in common the geographical component, i.e. they are data located on the ground and therefore serve to solve problems of different nature and linked to society.
Thus, for example, we have, with national coverage, the National Aerial Orthophotography Plan (PNOA), which are the aerial images, the System of Land Occupation Information (SIOSE), cadastral parcels, boundary lines, geographical names, roads, postal addresses, protected sites - which can be both environmental and also castles, i.e. historical heritage- etc. And these categories cover almost all the themes defined by the annexes of the INSPIRE directive.
Rafael Martínez Cebolla: It is necessary to know what is pure geographic information, with a direct geographic reference, as opposed to other types of phenomena that have indirect geographic references. In today's world, 90% of information can be located, either directly or indirectly. Today more than ever, geographic tagging is mandatory for any corporation that wants to implement a certain activity, be it social, cultural, environmental or economic: the implementation of renewable energies, where I am going to eat today, etc. These high-value datasets enhance these geographical references, especially of an indirect nature, which help us to make a decision.
3. Which agencies publish these high-value datasets? In other words, where could a user locate datasets in these categories?
Paloma Abad Power: It is necessary to highlight the role of the National Cartographic System, which is an action model in which the organisations of the NSA (National State Administration) and the autonomous communities participate. It is coordinating the co-production of many unique products, funded by these organisations.
These products are published through interoperable web services. They are published, in this case, by the National Center for Geographic Information (CNIG), which is also responsible for much of the metadata for these products.
They could be located through the Catalogues of the IDEE (Spatial Data Infrastructure of Spain) or the Official Catalogue of INSPIRE Data and Services, which is also included in datos.gob.es and the European Data Portal.
And who can publish? All bodies that have a legal mandate for a product classified under the Regulation. Examples: all the mapping bodies of the Autonomous Communities, the General Directorate of Cadastre, Historical Heritage, the National Statistics Institute, the Geological and Mining Institute (IGME), the Hydrographic Institute of the Navy, the Ministry of Agriculture, Fisheries and Food (MAPA), the Ministry for Ecological Transition and the Demographic Challenge, etc. There are a multitude of organisations and many of them, as I have mentioned, participate in the National Cartographic System, provide the data and generate a single service for the citizen.
Rafael Martínez Cebolla: The National Cartographic System defines very well the degree of competences assumed by the administrations. In other words, the public administration at all levels provides official data, assisted by private enterprise, sometimes through public procurement.
The General State Administration goes up to scales of 1:25,000 in the case of the National Geographic Institute (IGN) and then the distribution of competencies for the rest of the scales is for the autonomous or local administrations. In addition, there are a number of actors, such as hydrographic confederations, state departments or the Cadastre, which have under their competences the legal obligation to generate these datasets.
For me it is an example of how it should be distributed, although it is true that it is then necessary to coordinate very well, through collegiate bodies, so that the cartographic production is well integrated.
Paloma Abad Power: There are also collaborative projects, such as, for example, a citizen map, technically known as an X, Y, Z map, which consists of capturing the mapping of all organisations at national and local level. That is, from small scales 1:1,000,000 or 1:50,000,000 to very large scales, such as 1:1000, to provide the citizen with a single multi-scale map that can be served through interoperable and standardised web services.
4. Do you have any other examples of direct application of this type of data?
Rafael Martínez Cebolla: A clear example was seen with the pandemic, with the mobility data published by the National Institute of Statistics. These were very useful data for the administration, for decision making, and from which we have to learn much more for the management of future pandemics and crises, including economic crises. We need to learn and develop our early warning systems.
I believe that this is the line of work: data that is useful for the general public. That is why I say that mobility has been a clear example, because it was the citizen himself who was informing the administration about how he was moving.
Paloma Abad Power: I am going to contribute some data. For example, according to statistics from the National Cartographic System services, the most demanded data are aerial images and digital terrain models. In 2022 there were 8 million requests and in 2023 there were 19 million requests for orthoimages alone.
Rafael Martínez Cebolla: I would like to add that this increase is also because things are being done well. On the one hand, discovery systems are improved. My general feeling is that there are many successful example projects, both from the administration itself and from companies that need this basic information to generate their products.
There was an application that was generated very quickly with de-escalation - you went to a website and it told you how far you could walk through your municipality - because people wanted to get out and walk. This example arises from spatial data that have moved out of the public administration. I believe that this is the importance of successful examples, which come from people who see a compelling need.
5. And how do you incentivise such re-use?
Rafael Martínez Cebolla: I have countless examples. Incentivisation also involves promotion and marketing, something that has sometimes failed us in the public administration. You stick to certain competences and it seems that just putting it on a website is enough. And that is not all.
We are incentivising re-use in two ways. On the one hand, internally, within the administration itself, teaching them that geographic information is useful for planning and evaluating public policies. And I give you the example of the Public Health Atlas of the Government of Aragon, awarded by an Iberian society of epidemiology the year before the pandemic. It was useful for them to know what the health of the Aragonese was like and what preventive measures they had to take.
As for the external incentives, in the case of the Geographic Institute of Aragon, it was seen that the profile entering the geoportal was very technical. The formats used were also very technical, which meant that the general public was not reached. To solve this problem, we promoted portals such as the IDE didactica, a portal for teaching geography, which reaches any citizen who wants to learn about the territory of Aragon.
Paloma Abad Power: I would like to highlight the economic benefit of this, as was shown, for example, in the economic study carried out by the National Centre for Graphic Information with the University of Leuven to measure the economic benefit of the Spatial Data Infrastructure of Spain. It measure the benefit of private companies using free and open services, rather than using, for example, Google Maps or other non-open sources..
Rafael Martínez Cebolla: For better and for worse, because the quality of the official data sometimes we wish it were better. Both Paloma in the General State Administration and I in the regional administration sometimes know that there are official data where more money needs to be invested so that the quality of the data would be better and could be reusable.
But it is true that these studies are key to know in which dimension high-value datasets move. That is to say, having studies that report on the real benefit of having a spatial data infrastructure at state or regional level is, for me, key for two things: for the citizen to understand its importance and, above all, for the politician who arrives every N years to understand the evolution of these platforms and the revolution in geospatial information that we have experienced in the last 20 years.
6. The Geographic Institute of Aragon has also produced a report on the advantages of reusing this type of data, is that right?
Rafael Martínez Cebolla: Yes, it was published earlier this year. We have been doing this report internally for three or four years, because we knew we were going to make the leap to a spatial knowledge infrastructure and we wanted to see the impact of implementing a knowledge graph within the data infrastructure. The Geographic Institute of Aragon has made an effort in recent years to analyse the economic benefit of having this infrastructure available for the citizens themselves, not for the administration. In other words, how much money Aragonese citizens save in their taxes by having this infrastructure. Today we know that having a geographic information platform saves approximately 2 million euros a year for the citizens of Aragon.
I would like to see the report for the next January or February, because I think the leap will be significant. The knowledge graph was implemented in April last year and this gap will be felt in the year ahead. We have noticed a significant increase in requests, both for viewing and downloading.
Basically from one year to the next, we have almost doubled both the number of accesses and downloads. This affects the technological component: you have to redesign it. More people are discovering you, more people are accessing your data and, therefore, you have to dedicate more investment to the technological component, because it is being the bottleneck.
7. What do you see as the challenges to be faced in the coming years?
Paloma Abad Power: In my opinion, the first challenge is to get to know the user in order to provide a better service. The technical user, the university students, the users on the street, etc. We are thinking of doing a survey when the user is going to use our geographic information. But of course, such surveys sometimes slow down the use of geographic information. That is the great challenge: to know the user in order to make services more user-friendly, applications, etc. and to know how to get to what they want and give it to them better.
There is also another technical challenge. When the spatial infrastructures began, the technical level was very high, you had to know what a visualisation service was, the metadata, know the parameters, etc. This has to be eliminated, the user can simply say I want, for example, to consult and visualise the length of the Ebro river, in a more user-friendly way. Or for example the word LiDAR, which was the Italian digital model with high accuracy. All these terms need to be made much more user-friendly.
Rafael Martínez Cebolla: Above all, let them be discovered. My perception is that we must continue to promote the discovery of spatial data without having to explain to the untrained user, or even to some technicians, that we must have a data, a metadata, a service..... No, no. Basically it is that generalist search engines know how to find high-value datasets without knowing that there is such a thing as spatial data infrastructure.
It is a matter of publishing the data under friendly standards, under accessible versions and, above all, publishing them in permanent URIs, which are not going to change. In other words, the data will improve in quality, but will never change.
And above all, from a technical point of view, both spatial data infrastructures and geoportals and knowledge infrastructures have to ensure that high-value information nodes are related to each other from a semantic and geographical point of view. I understand that knowledge networks will help in this regard. In other words, mobility has to be related to the observation of the territory, to public health data or to statistical data, which also have a geographical component. This geographical semantic relationship is key for me.
Interview clips
1. What are high-value datasets and why are their important?
2. Where can a user locate geographic data?
3. How is the reuse of data with a geographic component being encouraged?
Blog
The Implementing Regulation (EU) 2023/138 of the European Commission sets clear guidelines for public bodies on the availability of high-value datasets within 16 months. These high-value datasets are grouped into the following themes, which were already described in this post post:
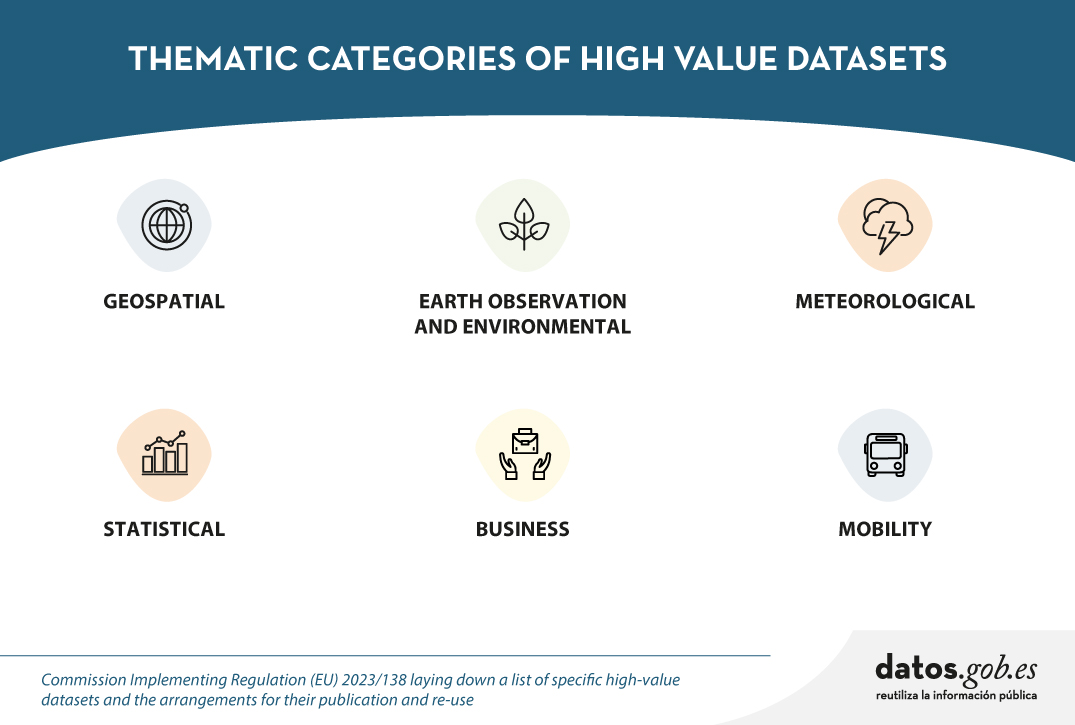
This article focuses on the geospatial category, called High-Value Geospatial Datasets (HVDG).
For all HVDGs, the following shall apply Directive 2007/2/EC of the European Parliament and of the Council of 14 March 2007 establishing an infrastructure for spatial information in the European Community (INSPIRE) with the exception of agricultural and reference parcels, for which Regulation (EU) 2021/211/EEC applies Regulation (EU) No 2021/2116 of the European Parliament and of the Council of 2 December 2021.
As reflected in the table below, the regulation provides detailed information on the requirements to be considered for these HVDGs, such as scales or granularity and attributes of each dataset. These are complementary to the attributes defined in the European Regulation (No 1089/2010), which establishes the interoperability of spatial data sets and services.
| Datasets | Scales | Attributes |
|---|---|---|
| Administrative units |
Levels of generalisation available with a granularity down to the scale of 1:5 000. From municipalities to countries; maritime units. |
|
| Geographical names |
Not applicable. |
|
| Directorates | Not applicable. |
|
| Buildings | Levels of generalisation available with a granularity up to the scale of 1:5 000 |
|
| Cadastral parcels | Levels of generalisation available with a granularity up to the scale of 1:5 000 |
|
| Reference areas | Levels of generalisation available with a granularity up to the scale of 1:5 000 |
|
| Agricultural areas | Level of accuracy equivalent to 1:10 000 scale and from 2016, 1:5 000 scale |
|
To ensure the accessibility and re-use of all these valuable datasets, it is imperative to follow certain provisions to facilitate their publication. Here are the key requirements:
- Open Licence: All datasets must be made available for re-use under a licence Creative Commons BY 4.0 or any equivalent less restrictive open licence. This encourages the freedom to share and adapt information.
- Open and Machine Readable Format: Data should be presented in an open, machine-readable format and be publicly documented. This ensures that the information is easily understandable and accessible to any person or automated system.
- Application Programming Interfaces (APIs) and Mass Download: Application programming interfaces (APIs) should be provided to facilitate programmatic access to data. In addition, direct bulk downloading of datasets should be possible, allowing flexible options for users according to their needs.
- Updated version: The availability of datasets in their most up-to-date version is essential. This ensures that users have access to the latest information, promoting the relevance and accuracy of data.
- Metadata: The description of the data will also be carefully taken care of through the use of metadata. This metadata shall, as a minimum, include the elements as defined in Commission Regulation (EC) No 1205/2008 of 3 December 2008. This regulation implements Directive 2007/2/EC of the European Parliament and of the Council and sets standards for metadata associated with datasets. The use of standardised metadata provides additional information essential for understanding, interpreting and using datasets effectively. By following these standards, interoperability and consistency in reporting is facilitated, thus promoting a more complete and accurate understanding of the available data.
These provisions not only promote transparency and openness, but also facilitate collaboration and the effective use of information in a variety of contexts.
Does Spain comply with the Geospatial HVD Regulation?
The INSPIRE (Infrastructure for Spatial Information in Europe) Directive determines the general rules for the establishment of an Infrastructure for Spatial Information in the European Community based on the Infrastructures of the Member States. Adopted by the European Parliament and Council on 14 March 2007 (Directive 2007/2/EC), entered into force on 25 April 2007.
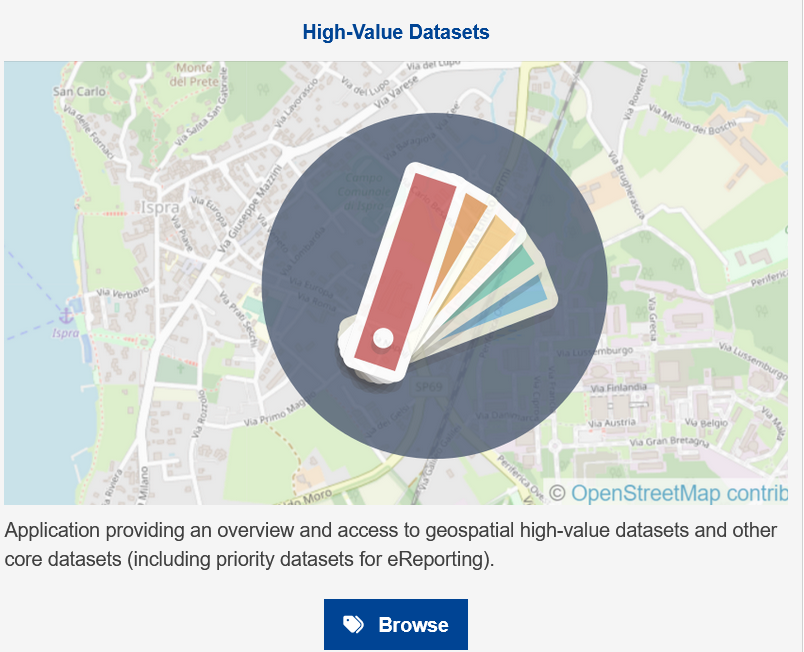
INSPIRE makes it easier to find, share and use spatial data from different countries and in each of the regions, with HVDs available in the the Commission's new catalogue of HVDs and in each of the catalogues of the Spatial Data Infrastructures of the Autonomous Communities, as well as in the Official INSPIRE Data and Services Catalogue of Spain. The information is available through an online platform whit data from different countries.
WARNING!: They are currently working on this Geoportal carrying out the tasks of data dump, therefore, there may be some temporal inconsistency with the data provided, which correspond to the Official Catalogue of INSPIRE Data and Services (CODSI).
In Spain, we can find the Law 14/2010 of 5 July 2010 on geographic information infrastructures and services in Spain (LISIGE), which transposes Directive 2007/2/EC INSPIRE. This law frames the work to make all national spatial data available and obliges the adaptation of national spatial data to the Technical Guides or Guidelines collected by the INSPIRE Directive, thus ensuring that these data are compatible and interoperable in a Community and cross-border context.
LISIGE applies to geographic data that meet these conditions:
- Refering to a geographical area of the national territory, the territorial sea, the contiguous zone, the continental shelf and the exclusive economic zone.
- Having been generated by or under the responsibility of public administrations.
- Being in electronic format.
- Their production and maintenance is the responsibility of a public sector administration or body.
- Being within the themes of Annexes I (Geographic Reference Information), II (Fundamental Thematic Data) or III (General Thematic Data) referred to in the aforementioned law
Furthermore, it is clarified that the geographic data and services regulated by the LISIGE will be available on the NSDI Geoportal and on the CODSI as well as in the rest of the catalogues of the Autonomous Communities. The National Geographic Institute (IGN) is responsible for its maintenance.
Thanks to the tireless efforts of the entire Spanish administration since the publication of LISIGE, Spain has achieved a remarkable milestone. It is currently available on the INSPIRE Geoportal a wide range of information classified as High Value Geospatial Data Set (HVDG) is now available on the INSPIRE Geoportal. This achievement reflects our country's continued commitment to transparency and access to high quality geospatial data.
As of January 2024 Spain has published in the INSPIRE Geoportal and in CODSI the following information related to the High Geospatial Value Datasets (HVD)
- 31 datasets associated with their metadata
- 34 download services (WFS, ATOM Feed, OGC Api Feature)
- 28 visualisation services (WMS, WMTS)
Analysing the sets of high geospatial value we see that, according to the thematics, they have already been published:
| HVDG Spain | Datasets | Download services | Visualisation services | Covers Spanish territory |
|---|---|---|---|---|
| Administrative units |
5 | 7 | 7 | Sí |
| Geographical names |
7 | 8 | 8 | Sí |
| Directorates | 6 | 5 | 7 | Sí |
| Buildings | 5 | 3 | 4 | Sí |
| Cadastral parcels | 3 | 3 | 3 | Sí |
| Reference areas | 3 | 0 | 3 | Sí |
| Agricultural areas | 2 | 2 | 2 | Sí |
Spain currently complies with the HVDG Regulation in all categories. Specifically, it complies with the established legislation at the level of scale or granularity, attributes, license, format, availability of the data in API or maximum download, with being the most updated version and with the metadata.
A detailed analysis of the datasets published under the HVD framework highlights several key issues:
- Comprehensive Geographic Coverage: At least one dataset covering the whole of Spain has been made available.
- Comprehensive Metadata: Metadata has been generated for all High Geospatial Value Datasets (HVDGs). These metadata are published in the Official INSPIRE Catalogue of INSPIRE Data and Services (CODSI), validated to comply with the standards of the Commission Regulation (EC) No 1205/2008.
- Viewing and Downloading Services: All HVDGs have viewing and download services. Download services can be bulk download or download APIs. Currently, they are WFS and ATOM. In the future may be OGC API Feature or API Coverage.
- Open Licences and Open Formats: All published services are licensed under Creative Commons BY 4.0, and download services use standard and open formats such as the GML format documented by the international standard ISO 19136.
- Compliance with INSPIRE Data Models: Almost all datasets comply with the INSPIRE data models, thus ensuring the consistency and quality of the attributes set out in the HVDG regulation.
- Data Updated and Maintained: Download services guarantee the availability of data in the most up-to-date version. Each public administration responsible for the data is responsible for maintaining and updating the information.
This analysis highlights the commitment and efficiency in the management of geospatial data in Spain, contributing to the transparency, accessibility and quality of the information provided to the community.
It should be noted that, in Spain, all HVDG requirements are met. Organisations such as the CNIG and the ICGC or the Government of Navarre, in addition to publishing through WFS or ATOM services, are already working on publishing these datasets with the APIs of OGC.
The INSPIRE Geoportal has become a valuable source of information, thanks to the dedication and collaboration of various governmental entities, including Spanish ones. This breakthrough not only highlights progress in the implementation of geospatial standards, but also strengthens the basis for sustainable development and informed decision-making in Spain. A significant achievement for the country in the geospatial field!
Content prepared by Mayte Toscano, Senior Consultant in Data Economy Technologies. The contents and points of view reflected in this publication are the sole responsibility of its author.
Blog
On September 8, the webinar \"Geospatial Trends 2023: Opportunities for data.europa.eu\" was held, organized by the Data Europa Academy and focused on emerging trends in the geospatial field. Specifically, the online conference addressed the concept of GeoAI (Geospatial Artificial Intelligence), which involves the application of artificial intelligence (AI) combined with geospatial data.
Next, we will analyze the most cutting-edge technological developments of 2023 in this field, based on the knowledge provided by the experts participating in the aforementioned webinar.
What is GeoAI?
The term GeoAI, as defined by Kyoung-Sook Kim, co-chair of the GeoAI Working Group of the Open Geospatial Consortium (OGC), refers to \"a set of methods or automated entities that use geospatial data to perceive, construct (automate), and optimize spaces in which humans, as well as everything else, can safely and efficiently carry out their geographically referenced activities.\"
GeoAI allows us to create unprecedented opportunities, such as:
- Extracting geospatial data enriched with deep learning: Automating the extraction, classification, and detection of information from data such as images, videos, point clouds, and text.
- Conducting predictive analysis with machine learning: Facilitating the creation of more accurate prediction models, pattern detection, and automation of spatial algorithms.
- Improving the quality, uniformity, and accuracy of data: Streamlining manual data generation workflows through automation to enhance efficiency and reduce costs.
- Accelerating the time to gain situational knowledge: Assisting in responding more rapidly to environmental needs and making more proactive, data-driven decisions in real-time.
- Incorporating location intelligence into decision-making: Offering new possibilities in decision-making based on data from the current state of the area that needs governance or planning.
Although this technology gained prominence in 2023, it was already discussed in the 2022 geospatial trends report, where it was indicated that integrating artificial intelligence into spatial data represents a great opportunity in the world of open data and the geospatial sector.
Use Cases of GeoAI
During the Geospatial Trends 2023 conference, companies in the GIS sector, Con terra and 52ºNorth, shared practical examples highlighting the use of GeoAI in various geospatial applications.
Examples presented by Con terra included:
- KINoPro: A research project using GeoAI to predict the activity of the \"black arches\" moth and its impact on German forests.
- Anomaly detection in cell towers: Using a neural network to detect causes of anomalies in towers that can affect the location in emergency calls.
- Automated analysis of construction areas: Aiming to detect building areas for industrial zones using OpenData and satellite imagery.
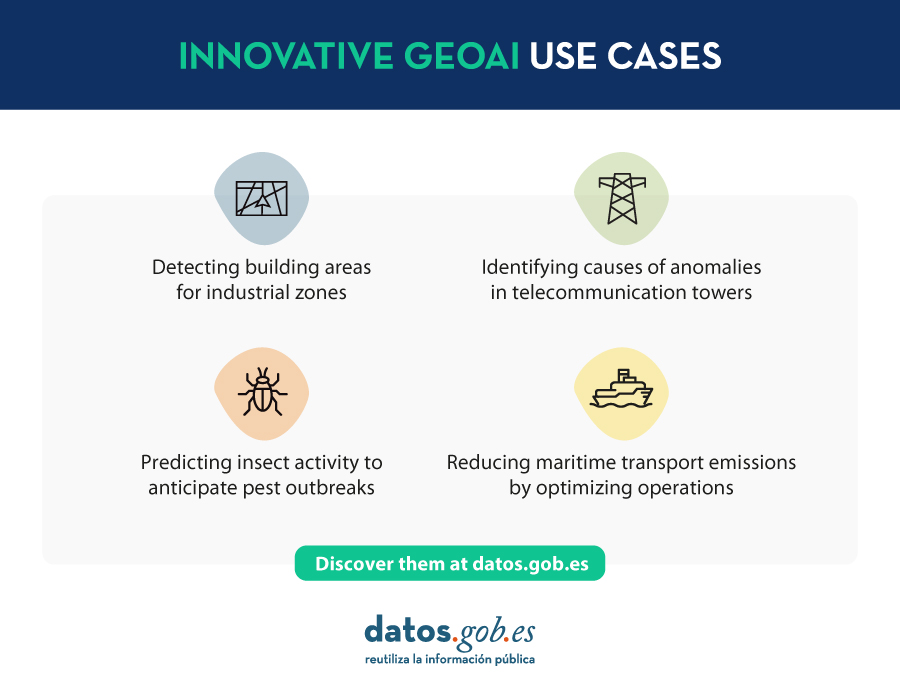
On the other hand, 52ºNorth presented use cases such as MariData, which seeks to reduce emissions from maritime transport by using GeoAI to calculate optimal routes, considering ship position, environmental data, and maritime traffic regulations. They also presented KI:STE, which applies artificial intelligence technologies in environmental sciences for various projects, including classifying Sentinel-2 images into (un)protected areas.
These projects highlight the importance of GeoAI in various applications, from predicting environmental events to optimizing maritime transport routes. They all emphasize that this technology is a crucial tool for addressing complex problems in the geospatial community.
GeoAI not only represents a significant opportunity for the spatial sector but also tests the importance of having open data that adheres to FAIR principles (Findable, Accessible, Interoperable, Reusable). These principles are essential for GeoAI projects as they ensure transparent, efficient, and ethical access to information. By adhering to FAIR principles, datasets become more accessible to researchers and developers, fostering collaboration and continuous improvement of models. Additionally, transparency and the ability to reuse open data contribute to building trust in results obtained through GeoAI projects.
Reference
| Reference video | https://www.youtube.com/watch?v=YYiMQOQpk8A |
Blog
Image segmentation is a method that divides a digital image into subgroups (segments) to reduce its complexity, thus facilitating its processing or analysis. The purpose of segmentation is to assign labels to pixels to identify objects, people, or other elements in the image.
Image segmentation is crucial for artificial vision technologies and algorithms, but it is also used in many applications today, such as medical image analysis, autonomous vehicle vision, face recognition and detection, and satellite image analysis, among others.
Segmenting an image is a slow and costly process. Therefore, instead of processing the entire image, a common practice is image segmentation using the mean-shift approach. This procedure employs a sliding window that progressively traverses the image, calculating the average pixel values within that region.
This calculation is done to determine which pixels should be incorporated into each of the delineated segments. As the window advances along the image, it iteratively recalibrates the calculation to ensure the suitability of each resulting segment.
When segmenting an image, the factors or characteristics primarily considered are:
-
Color: Graphic designers have the option to use a green-toned screen to ensure chromatic uniformity in the background of the image. This practice enables the automation of background detection and replacement during the post-processing stage.
-
Edges: Edge-based segmentation is a technique that identifies the edges of various objects in a given image. These edges are identified based on variations in contrast, texture, color, and saturation.
-
Contrast: The image is processed to distinguish between a dark figure and a light background based on high-contrast values.
These factors are applied in different segmentation techniques:
-
Thresholds: Divide the pixels based on their intensity relative to a specified threshold value. This method is most suitable for segmenting objects with higher intensity than other objects or backgrounds.
-
Regions: Divide an image into regions with similar characteristics by grouping pixels with similar features.
-
Clusters: Clustering algorithms are unsupervised classification algorithms that help identify hidden information in the images. The algorithm divides the images into groups of pixels with similar characteristics, separating elements into groups and grouping similar elements in these groups.
-
Watersheds: This process transforms grayscale images, treating them as topographic maps, where the brightness of pixels determines their height. This technique is used to detect lines forming ridges and watersheds, marking the areas between watershed boundaries.
Machine learning and deep learning have improved these techniques, such as cluster segmentation, and have also generated new segmentation approaches that use model training to enhance program capabilities in identifying important features. Deep neural network technology is especially effective for image segmentation tasks.
Currently, there are different types of image segmentation, with the main ones being:
- Semantic Segmentation: Semantic image segmentation is a process that creates regions within an image and assigns semantic meaning to each of them. These objects, also known as semantic classes, such as cars, buses, people, trees, etc., have been previously defined through model training, where these objects are classified and labeled. The result is an image where pixels are classified into each located object or class.
- Instance Segmentation: Instance segmentation combines the semantic segmentation method (interpreting the objects in an image) with object detection (locating them within the image). As a result of this segmentation, objects are located, and each of them is individualized through a bounding box and a binary mask, determining which pixels within that window belong to the located object.
- Panoptic Segmentation: This is the most recent type of segmentation. It combines semantic segmentation and instance segmentation. This method can determine the identity of each object because it locates and distinguishes different objects or instances and assigns two labels to each pixel in the image: a semantic label and an instance ID. This way, each object is unique.
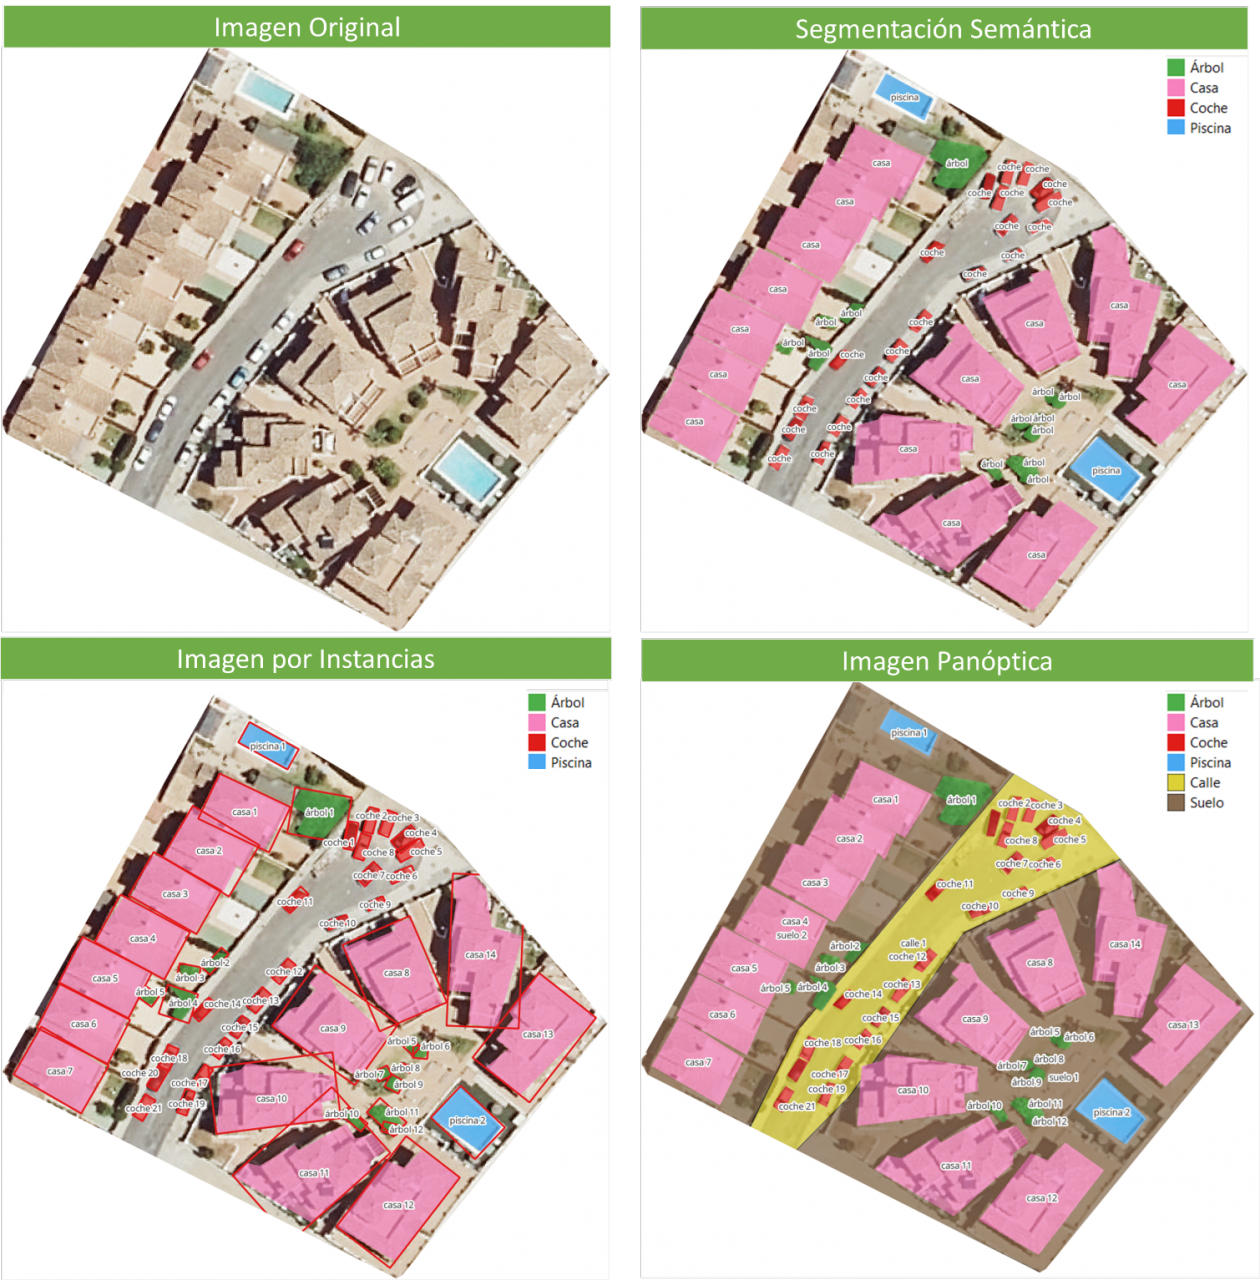
In the image, you can observe the results of applying different segmentations to a satellite image. Semantic segmentation returns a category for each type of identified object. Instance segmentation provides individualized objects along with their bounding boxes, and in panoptic segmentation, we obtain individualized objects and also differentiate the context, allowing for the detection of the ground and street regions.
Meta's New Model: SAM
In April 2023, Meta's research department introduced a new Artificial Intelligence (AI) model called SAM (Segment Anything Model). With SAM, image segmentation can be performed in three ways:
-
By selecting a point in the image, SAM will search for and distinguish the object intersecting with that point and find all identical objects in the image.
-
Using a bounding box, a rectangle is drawn on the image, and all objects found in that area are identified.
-
By using keywords, users can type a word in a console, and SAM can identify objects that match that word or explicit command in both images and videos, even if that information was not included in its training.
SAM is a flexible model that was trained on the largest dataset to date, called SA-1B, which includes 11 million images and 1.1 billion segmentation masks. Thanks to this data, SAM can detect various objects without the need for additional training.
Currently, SAM and the SA-1B dataset are available for non-commercial use and research purposes only. Users who upload their images are required to commit to using it solely for academic purposes. To try it out, you can visit this GitHub link.
In August 2023, the Image and Video Analysis Group of the Chinese Academy of Sciences released an update to their model called FastSAM, significantly reducing processing time with a 50 times faster execution speed compared to the original SAM model. This makes the model more practical for real-world usage. FastSAM achieved this acceleration by training on only 2% of the data used to train SAM, resulting in lower computational requirements while maintaining high accuracy.
SAMGEO: The Version for Analyzing Geospatial Data
The segment-geospatial package developed by Qiusheng Wu aims to facilitate the use of the Segment Anything Model (SAM) for geospatial data. For this purpose, two Python packages, segment-anything-py and segment-geospatial, have been developed, and they are available on PyPI and conda-forge.
The goal is to simplify the process of leveraging SAM for geospatial data analysis, allowing users to achieve it with minimal coding effort. These libraries serve as the basis for the QGIS Geo-SAM plugin and the integration of the model in ArcGIS Pro.
En la imagen se pueden observar los resultados de aplicar las distintas segmentaciones a una imagen satelital. La segmentación semántica devuelve una categoría por cada tipo de objeto identificado. La segmentación por instancia devuelve los objetos individualizados y la caja delimitadora y, en la segmentación panóptica, obtenemos los objetos individualizados y el contexto también diferenciado, pudiendo detectar el suelo y la región de calles.

Conclusions
In summary, SAM represents a significant revolution not only for the possibilities it opens in terms of editing photos or extracting elements from images for collages or video editing but also for the opportunities it provides to enhance computer vision when using augmented reality glasses or virtual reality headsets.
SAM also marks a revolution in spatial information acquisition, improving object detection through satellite imagery and facilitating the rapid detection of changes in the territory.
Content created by Mayte Toscano, Senior Consultant in Data Economy Technologies.
The content and viewpoints reflected in this publication are the sole responsibility of the author.
Documentación
1. Introduction
Visualizations are graphical representations of the data allowing to transmit in a simple and effective way related information. The visualization capabilities are extensive, from basic representations, such as a line chart, bars or sectors, to visualizations configured on control panels or interactive dashboards.
In this "Step-by-Step Visualizations" section we are periodically presenting practical exercises of open data visualizations available in datos.gob.es or other similar catalogs. They address and describe in an easy manner stages necessary to obtain the data, to perform transformations and analysis relevant to finally creating interactive visualizations, from which we can extract information summarized in final conclusions. In each of these practical exercises simple and well-documented code developments are used, as well as open-source tools. All generated materials are available for reuse in the GitHub repository.
In this practical exercise, we made a simple code development that is conveniently documented relying on free to use tools.
Access the data lab repository on Github
Run the data pre-procesing code on top of Google Colab
2. Objective
The main scope of this post is to show how to generate a custom Google Maps map using the "My Maps" tool based on open data. These types of maps are highly popular on websites, blogs and applications in the tourism sector, however, the useful information provided to the user is usually scarce.
In this exercise, we will use potential of the open-source data to expand the information to be displayed on our map in an automatic way. We will also show how to enrich open data with context information that significantly improves the user experience.
From a functional point of view, the goal of the exercise is to create a personalized map for planning tourist routes through the natural areas of the autonomous community of Castile and León. For this, open data sets published by the Junta of Castile and León have been used, which we have pre-processed and adapted to our needs in order to generate a personalized map.
3. Resources
3.1. Datasets
The datasets contain different tourist information of geolocated interest. Within the open data catalog of the Junta of Castile and León, we may find the "dictionary of entities" (additional information section), a document of vital importance, since it defines the terminology used in the different data sets.
- Viewpoints in natural areas
- Observatories in natural areas
- Shelters in natural areas
- Trees in natural areas
- Park houses in natural areas
- Recreational areas in natural areas
- Registration of hotel establishments
These datasets are also available in the Github repository.
3.2. Tools
To carry out the data preprocessing tasks, the Python programming language written on a Jupyter Notebook hosted in the Google Colab cloud service has been used.
"Google Colab" also called " Google Colaboratory", is a free cloud service from Google Research that allows you to program, execute and share from your browser code written in Python or R, so it does not require installation of any tool or configuration.
For the creation of the interactive visualization, the Google My Maps tool has been used.
"Google My Maps" is an online tool that allows you to create interactive maps that can be embedded in websites or exported as files. This tool is free, easy to use and allows multiple customization options.
If you want to know more about tools that can help you with the treatment and visualization of data, you can go to the section "Data processing and visualization tools".
4. Data processing and preparation
The processes that we describe below are commented in the Notebook which you can run from Google Colab.
Before embarking on building an effective visualization, we must carry out a prior data treatment, paying special attention to obtaining them and validating their content, ensuring that they are in the appropriate and consistent format for processing and that they do not contain errors.
The first step necessary is performing the exploratory analysis of the data (EDA) in order to properly interpret the starting data, detect anomalies, missing data or errors that could affect the quality of the subsequent processes and results. If you want to know more about this process, you can go to the Practical Guide of Introduction to Exploratory Data Analysis.
The next step is to generate the tables of preprocessed data that will be used to feed the map. To do so, we will transform the coordinate systems, modify and filter the information according to our needs.
The steps required in this data preprocessing, explained in the Notebook, are as follows:
- Installation and loading of libraries
- Loading datasets
- Exploratory Data Analysis (EDA)
- Preprocessing of datasets
During the preprocessing of the data tables, it is necessary to change the coordinate system since in the source datasets the ESTR89 (standard system used in the European Union) is used, while we will need them in the WGS84 (system used by Google My Maps among other geographical applications). How to make this coordinate change is explained in the Notebook. If you want to know more about coordinate types and systems, you can use the "Spatial Data Guide".
Once the preprocessing is finished, we will obtain the data tables "recreational_natural_parks.csv", "rural_accommodations_2stars.csv", "natural_park_shelters.csv", "observatories_natural_parks.csv", "viewpoints_natural_parks.csv", "park_houses.csv", "trees_natural_parks.csv" which include generic and common information fields such as: name, observations, geolocation,... together with specific information fields, which are defined in details in section "6.2 Personalization of the information to be displayed on the map".
You will be able to reproduce this analysis, as the source code is available in our GitHub account. The code can be provided through a document made on a Jupyter Notebook once loaded into the development environment can be easily run or modified. Due to informative nature of this post and to favor understanding of non-specialized readers, the code is not intended to be the most efficient, but rather to facilitate its understanding so you could possibly come up with many ways to optimize the proposed code to achieve similar purposes. We encourage you to do so!
5. Data enrichment
To provide more related information, a data enrichment process is carried out on the dataset "hotel accommodation registration" explained below. With this step we will be able to automatically add complementary information that was initially not included. With this, we will be able to improve the user experience during their use of the map by providing context information related to each point of interest.
For this we will apply a useful tool for such kind of a tasks: OpenRefine. This open-source tool allows multiple data preprocessing actions, although this time we will use it to carry out an enrichment of our data by incorporating context by automatically linking information that resides in the popular Wikidata knowledge repository.
Once the tool is installed on our computer, when executed – a web application will open in the browser in case it is not opened automatically.
Here are the steps to follow.
Step 1
Loading the CSV into the system (Figure 1). In this case, the dataset "Hotel accommodation registration".
Figure 1. Uploading CSV file to OpenRefine
Step 2
Creation of the project from the uploaded CSV (Figure 2). OpenRefine is managed by projects (each uploaded CSV will be a project), which are saved on the computer where OpenRefine is running for possible later use. In this step we must assign a name to the project and some other data, such as the column separator, although the most common is that these last settings are filled automatically.
Figure 2. Creating a project in OpenRefine
Step 3
Linked (or reconciliation, using OpenRefine nomenclature) with external sources. OpenRefine allows us to link resources that we have in our CSV with external sources such as Wikidata. To do this, the following actions must be carried out:
- Identification of the columns to be linked. Usually, this step is based on the analyst experience and knowledge of the data that is represented in Wikidata. As a hint, generically you can reconcile or link columns that contain more global or general information such as country, streets, districts names etc., and you cannot link columns like geographical coordinates, numerical values or closed taxonomies (types of streets, for example). In this example, we have the column "municipalities" that contains the names of the Spanish municipalities.
- Beginning of reconciliation (Figure 3). We start the reconciliation and select the default source that will be available: Wikidata. After clicking Start Reconciling, it will automatically start searching for the most suitable Wikidata vocabulary class based on the values in our column.
- Obtaining the values of reconciliation. OpenRefine offers us an option of improving the reconciliation process by adding some features that allow us to conduct the enrichment of information with greater precision.
Figure 3. Selecting the class that best represents the values in the "municipality"
Step 4
Generate a new column with the reconciled or linked values (Figure 4). To do this we need to click on the column "municipality" and go to "Edit Column → Add column based in this column", where a text will be displayed in which we will need to indicate the name of the new column (in this example it could be "wikidata"). In the expression box we must indicate: "http://www.wikidata.org/ entity/"+cell.recon.match.id and the values appear as previewed in the Figure. "http://www.wikidata.org/entity/" is a fixed text string to represent Wikidata entities, while the reconciled value of each of the values is obtained through the cell.recon.match.id statement, that is, cell.recon.match.id("Adanero") = Q1404668
Thanks to the abovementioned operation, a new column will be generated with those values. In order to verify that it has been executed correctly, we click on one of the cells in the new column which should redirect to the Wikidata webpage with reconciled value information.
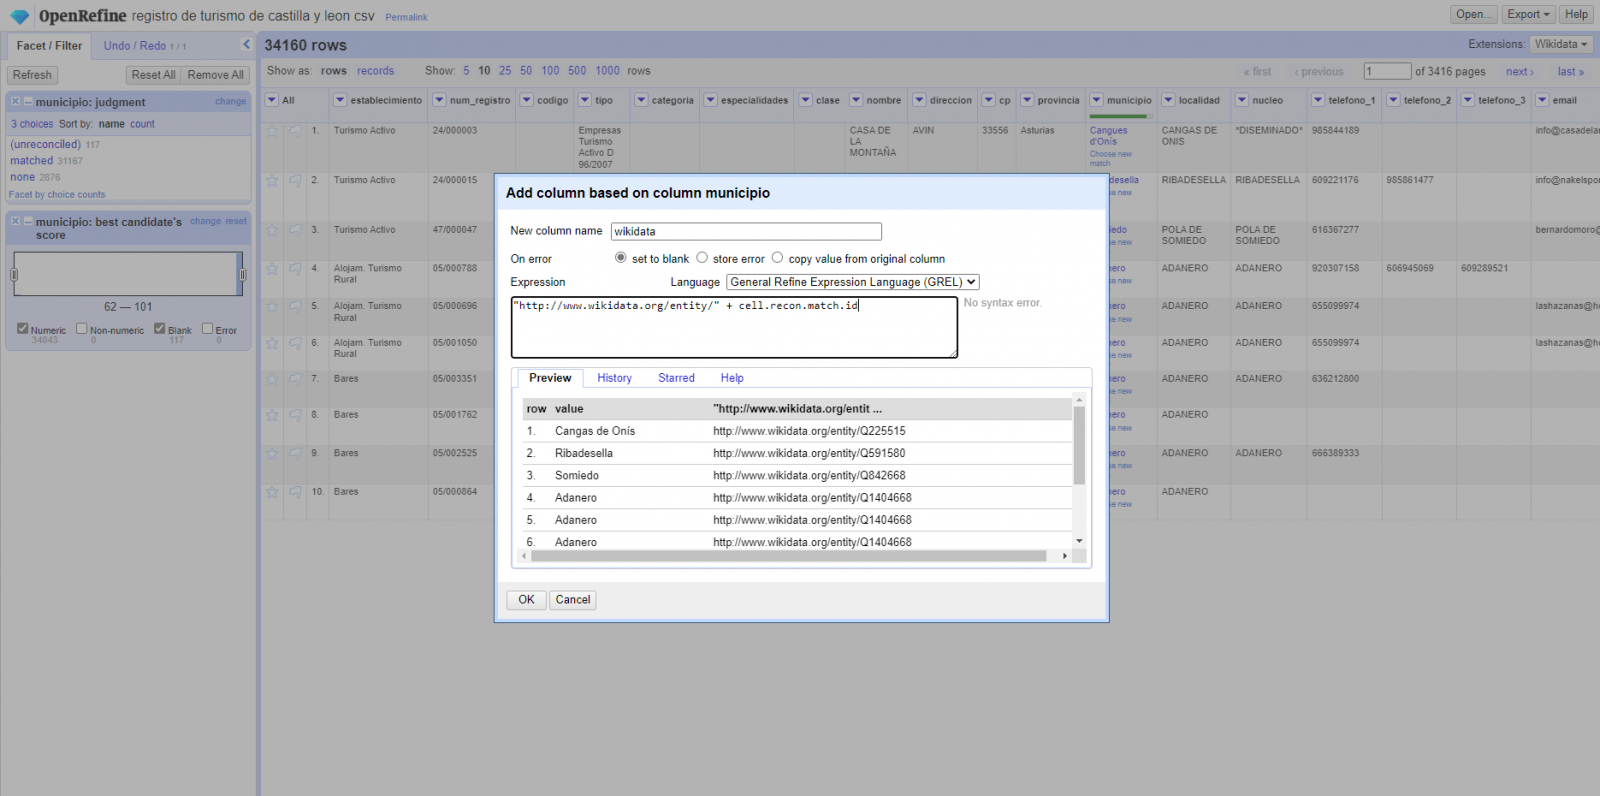
Figure 4. Generating a new column with reconciled values
Step 5
We repeat the process by changing in step 4 the "Edit Column → Add column based in this column" with "Add columns from reconciled values" (Figure 5). In this way, we can choose the property of the reconciled column.
In this exercise we have chosen the "image" property with identifier P18 and the "population" property with identifier P1082. Nevertheless, we could add all the properties that we consider useful, such as the number of inhabitants, the list of monuments of interest, etc. It should be mentioned that just as we enrich data with Wikidata, we can do so with other reconciliation services.
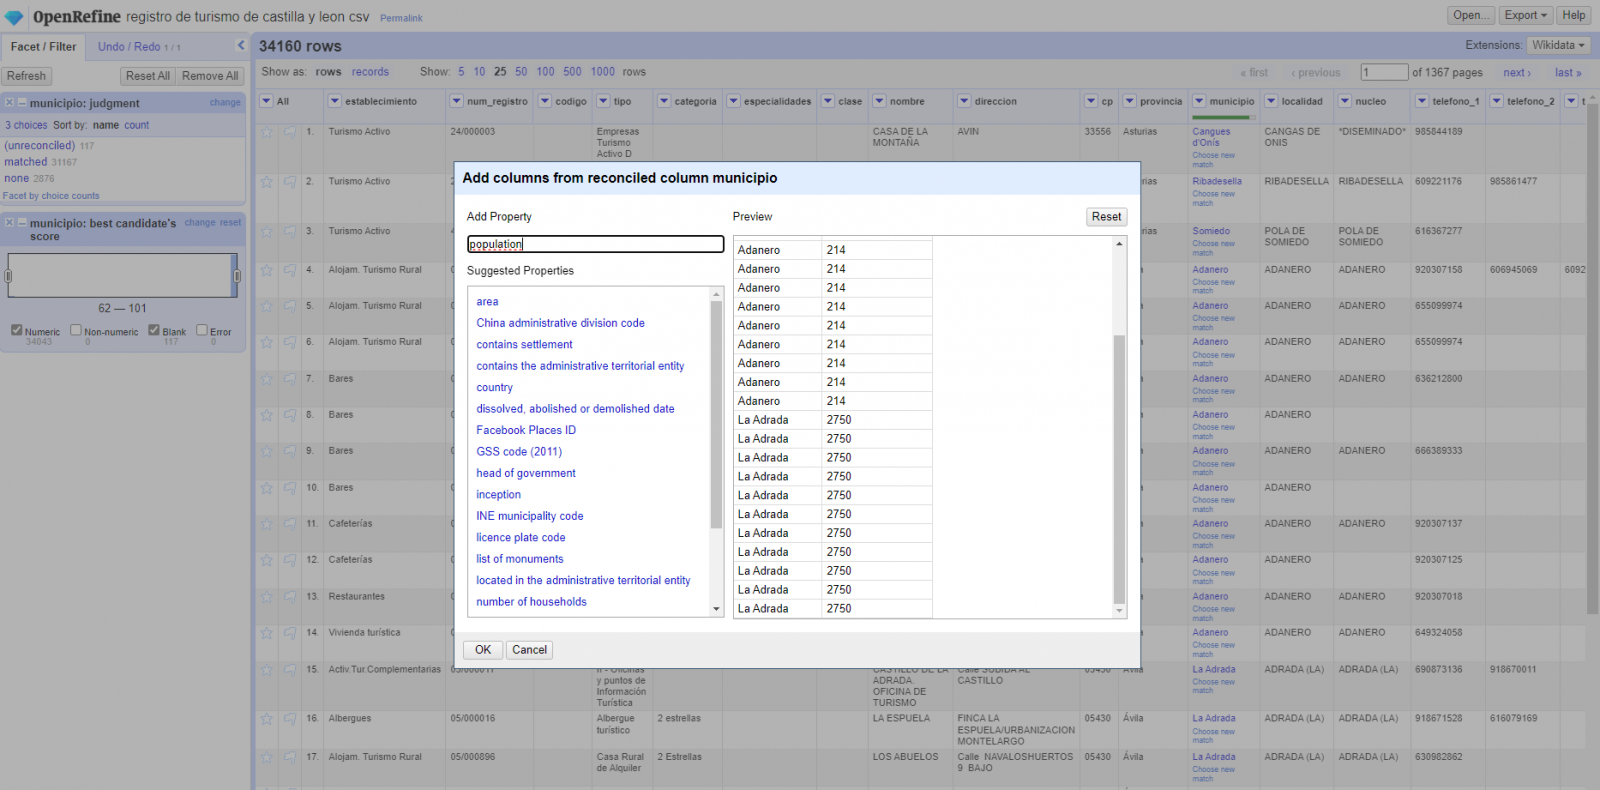
Figura 5. Choice of property for reconciliation
In the case of the "image" property, due to the display, we want the value of the cells to be in the form of a link, so we have made several adjustments. These adjustments have been the generation of several columns according to the reconciled values, adequacy of the columns through commands in GREL language (OpenRefine''s own language) and union of the different values of both columns. You can check these settings and more techniques to improve your handling of OpenRefine and adapt it to your needs in the following User Manual.
6. Map visualization
6.1 Map generation with "Google My Maps"
To generate the custom map using the My Maps tool, we have to execute the following steps:
- We log in with a Google account and go to "Google My Maps", with free access with no need to download any kind of software.
- We import the preprocessed data tables, one for each new layer we add to the map. Google My Maps allows you to import CSV, XLSX, KML and GPX files (Figure 6), which should include associated geographic information. To perform this step, you must first create a new layer from the side options menu.
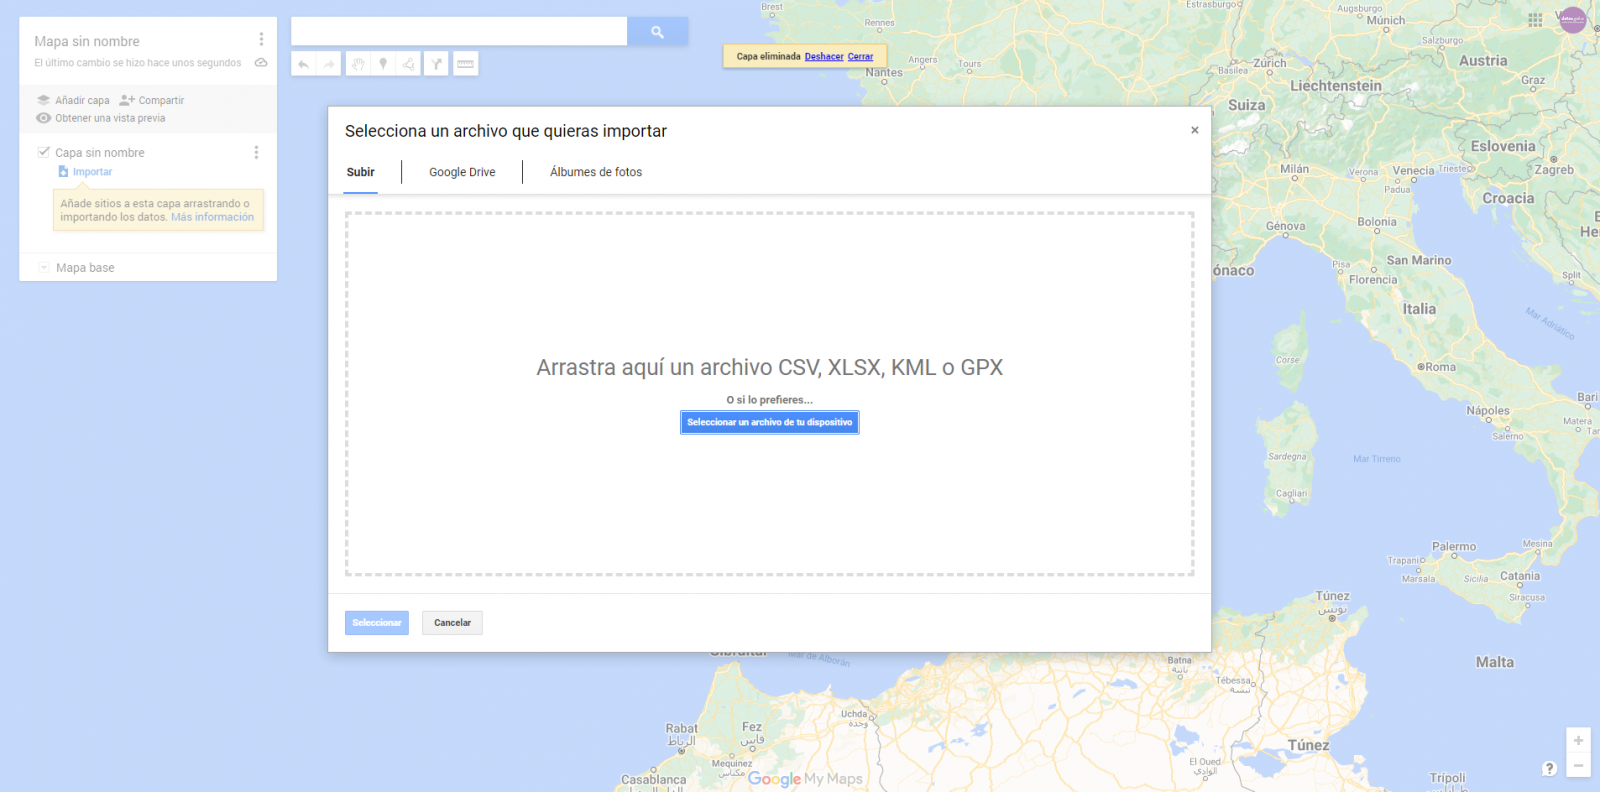
Figure 6. Importing files into "Google My Maps"
- In this case study, we''ll import preprocessed data tables that contain one variable with latitude and other with longitude. This geographic information will be automatically recognized. My Maps also recognizes addresses, postal codes, countries, ...
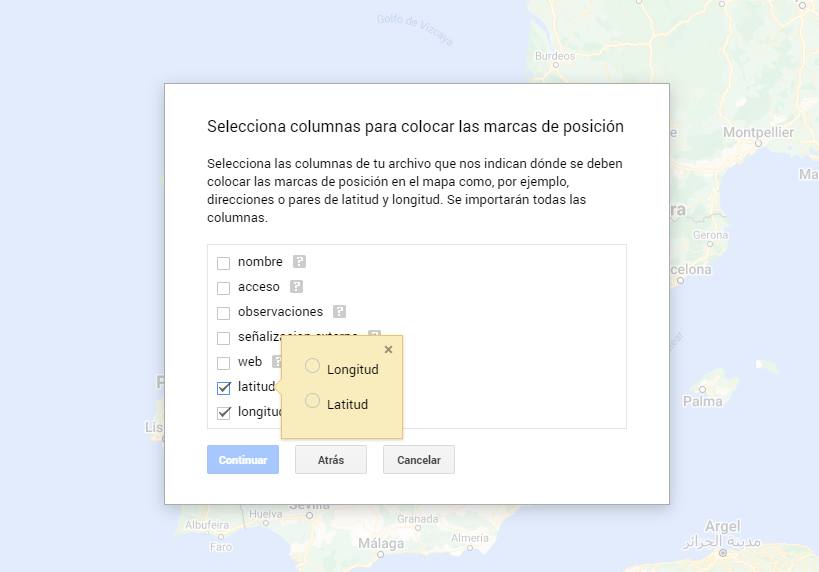
Figura 7. Select columns with placement values
- With the edit style option in the left side menu, in each of the layers, we can customize the pins, editing their color and shape.

Figure 8. Position pin editing
- Finally, we can choose the basemap that we want to display at the bottom of the options sidebar.
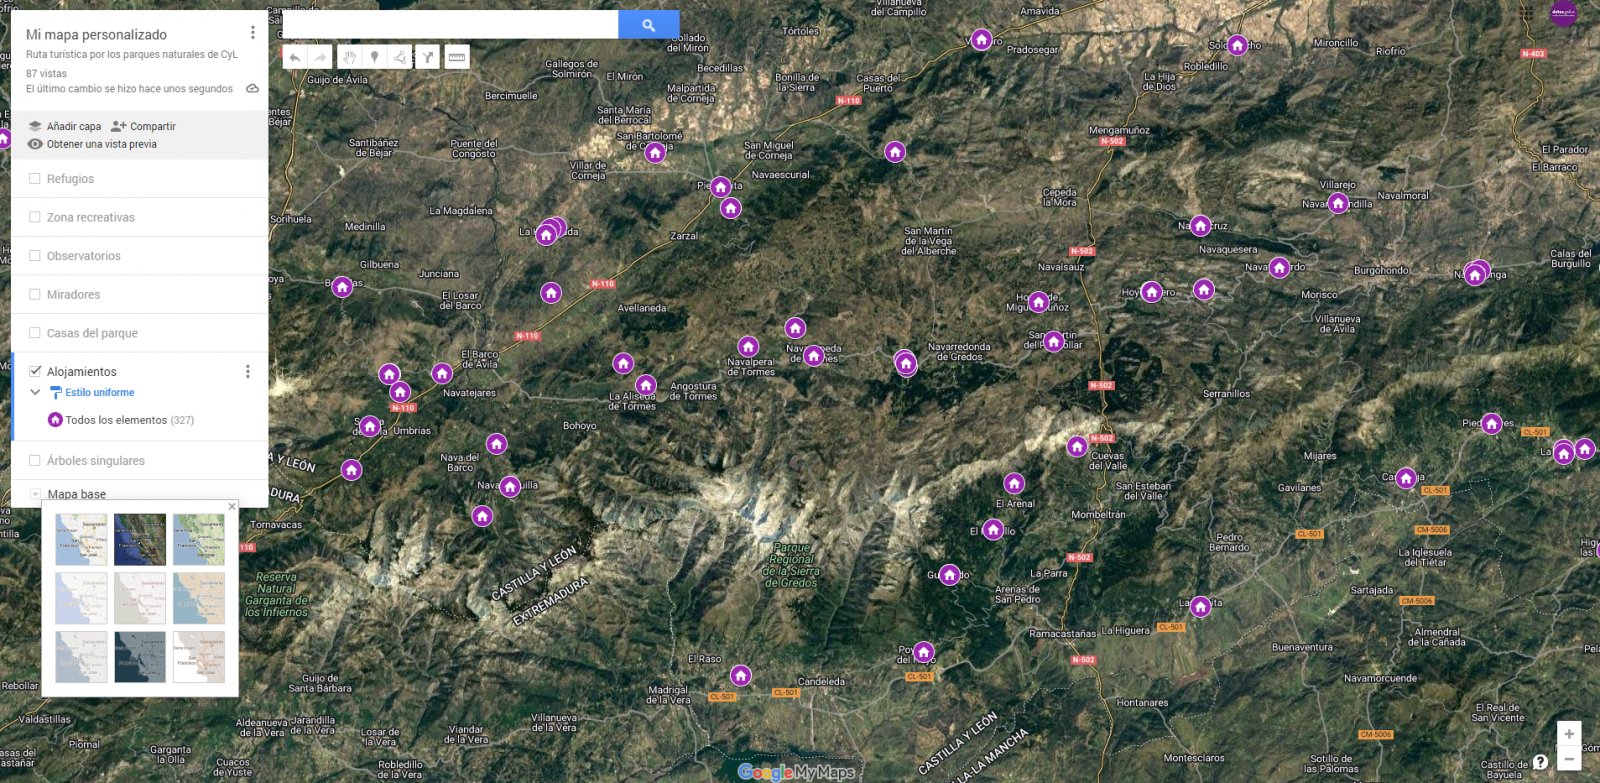
Figura 9. Basemap selection
If you want to know more about the steps for generating maps with "Google My Maps", check out the following step-by-step tutorial.
6.2 Personalization of the information to be displayed on the map
During the preprocessing of the data tables, we have filtered the information according to the focus of the exercise, which is the generation of a map to make tourist routes through the natural spaces of Castile and León. The following describes the customization of the information that we have carried out for each of the datasets.
- In the dataset belonging to the singular trees of the natural areas, the information to be displayed for each record is the name, observations, signage and position (latitude / longitude)
- In the set of data belonging to the houses of the natural areas park, the information to be displayed for each record is the name, observations, signage, access, web and position (latitude / longitude)
- In the set of data belonging to the viewpoints of the natural areas, the information to be displayed for each record is the name, observations, signage, access and position (latitude / longitude)
- In the dataset belonging to the observatories of natural areas, the information to be displayed for each record is the name, observations, signaling and position (latitude / longitude)
- In the dataset belonging to the shelters of the natural areas, the information to be displayed for each record is the name, observations, signage, access and position (latitude / longitude). Since shelters can be in very different states and that some records do not offer information in the "observations" field, we have decided to filter to display only those that have information in that field.
- In the set of data belonging to the recreational areas of the natural park, the information to be displayed for each record is the name, observations, signage, access and position (latitude / longitude). We have decided to filter only those that have information in the "observations" and "access" fields.
- In the set of data belonging to the accommodations, the information to be displayed for each record is the name, type of establishment, category, municipality, web, telephone and position (latitude / longitude). We have filtered the "type" of establishment only those that are categorized as rural tourism accommodations and those that have 2 stars.
Following a visualization of the custom map we have created is returned. By selecting the icon to enlarge the map that appears in the upper right corner, you can access its full-screen display
6.3 Map functionalities (layers, pins, routes and immersive 3D view)
At this point, once the custom map is created, we will explain various functionalities offered by "Google My Maps" during the visualization of the data.
- Layers
Using the drop-down menu on the left, we can activate and deactivate the layers to be displayed according to our needs.
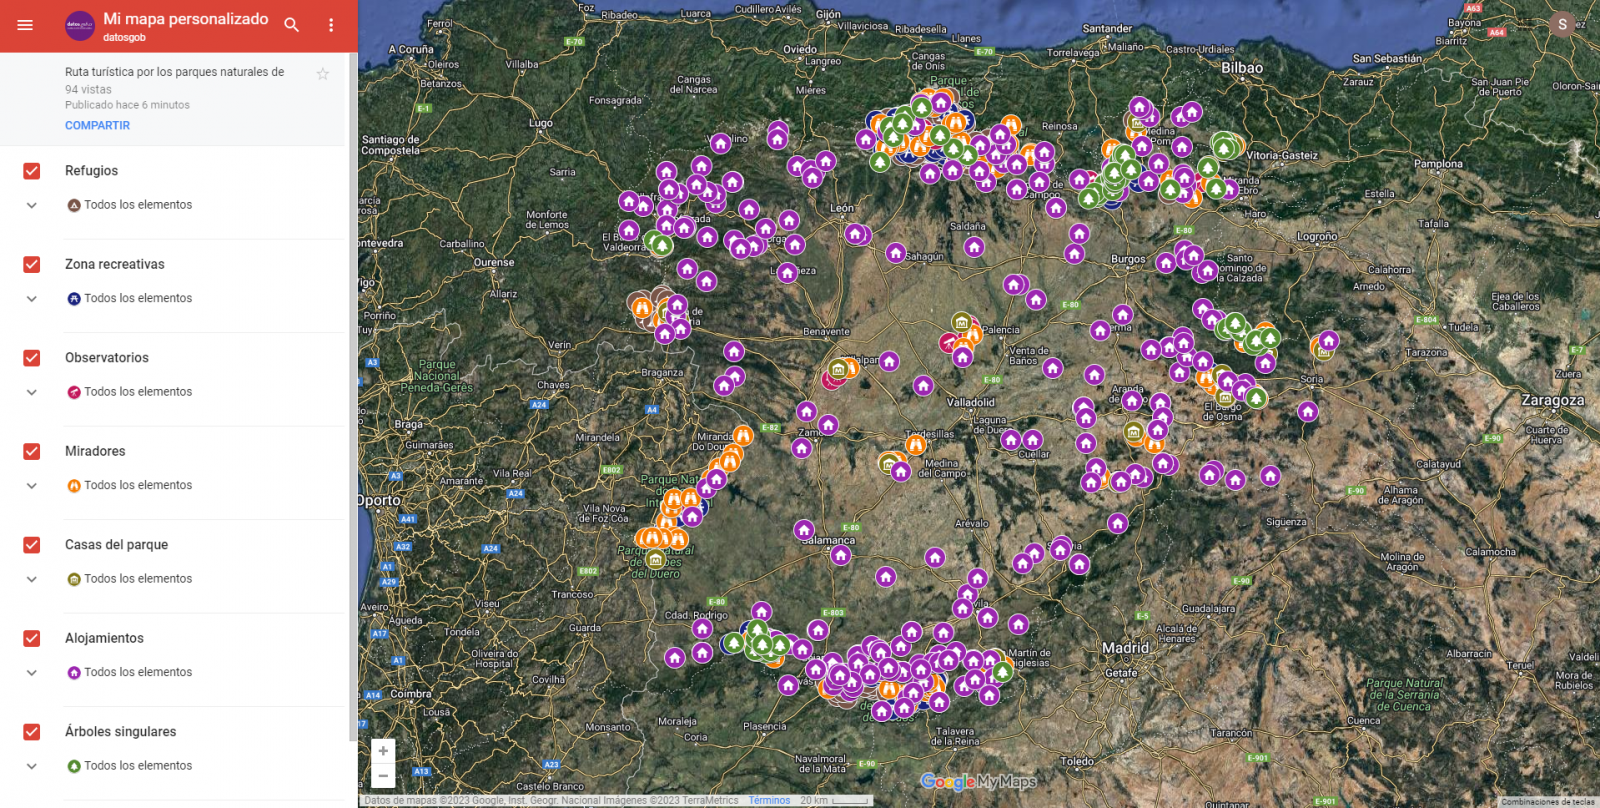
Figure 10. Layers in "My Maps"
-
Pins
By clicking on each of the pins of the map we can access the information associated with that geographical position.
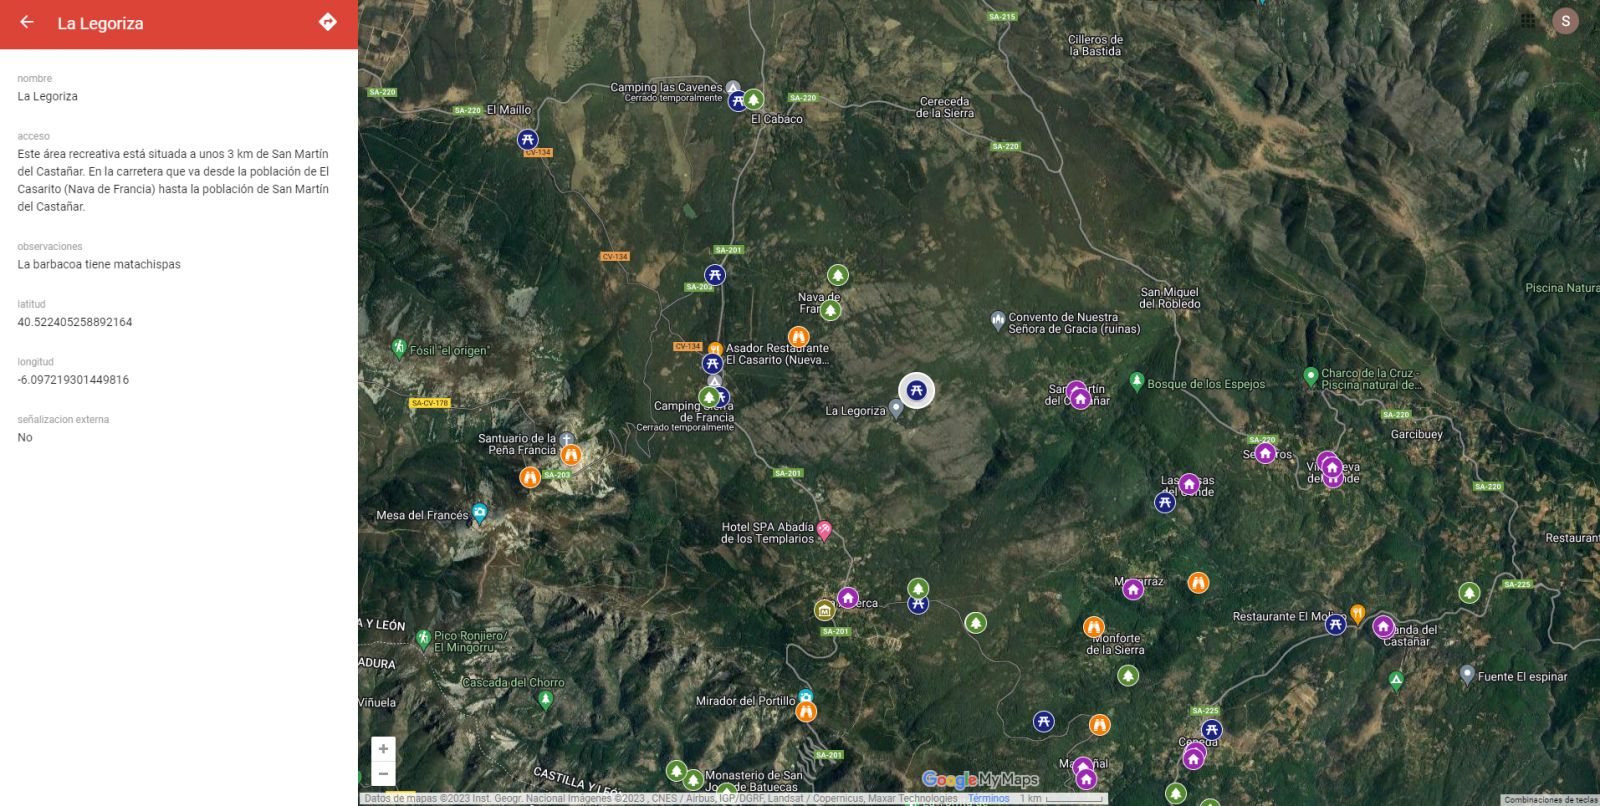
Figure 11. Pins in "My Maps"
-
Routes
We can create a copy of the map on which to add our personalized tours.
In the options of the left side menu select "copy map". Once the map is copied, using the add directions symbol, located below the search bar, we will generate a new layer. To this layer we can indicate two or more points, next to the means of transport and it will create the route next to the route indications.

Figure 12. Routes in "My Maps"
-
3D immersive map
Through the options symbol that appears in the side menu, we can access Google Earth, from where we can explore the immersive map in 3D, highlighting the ability to observe the altitude of the different points of interest. You can also access through the following link.
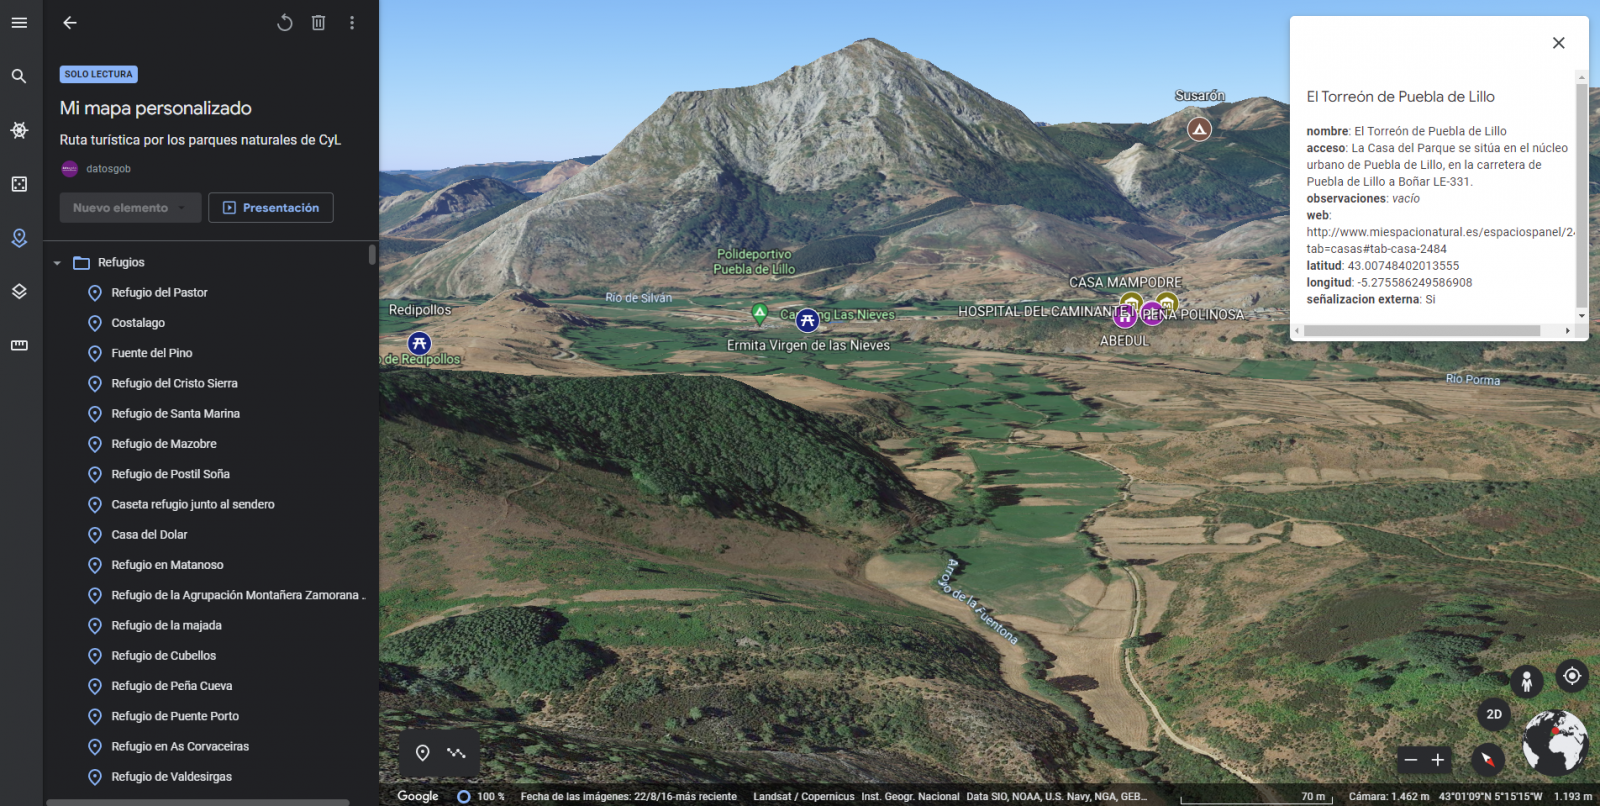
Figure 13. 3D immersive view
7. Conclusions of the exercise
Data visualization is one of the most powerful mechanisms for exploiting and analyzing the implicit meaning of data. It is worth highlighting the vital importance that geographical data have in the tourism sector, which we have been able to verify in this exercise.
As a result, we have developed an interactive map with information provided by Linked Data, which we have customized according to our interests.
We hope that this step-by-step visualization has been useful for learning some very common techniques in the treatment and representation of open data. We will be back to show you new reuses. See you soon!
Documentación
This report published by the European Data Portal (EDP) aims to help open data users in harnessing the potential of the data generated by the Copernicus program.
The Copernicus project generates high-value satellite data, generating a large amount of Earth observation data, this is in line with the European Data Portal's objective of increasing the accessibility and value of open data.
The report addresses the following questions, What can I do with Copernicus data? How can I access the data?, and What tools do I need to use the data? using the information found in the European Data Portal, specialized catalogues and examining practical examples of applications using Copernicus data.
This report is available at this link: "Copernicus data for the open data community"