
Description
Open data can transform how we interact with our cities, offering opportunities to improve quality of life. When made publicly available, they enable the development of innovative applications and tools that address urban challenges, from accessibility to road safety and participation.
Real-time information can have positive impacts on citizens. For example, applications that use open data can suggest the most efficient routes, considering factors such as traffic and ongoing construction; information on the accessibility of public spaces can improve mobility for people with disabilities; data on cycling or pedestrian routes encourages greener and healthier modes of transport; and access to urban data can empower citizens to participate in decision-making about their city. In other words, citizen use of open data not only improves the efficiency of the city and its services, but also promotes a more inclusive, sustainable and participatory city.
To illustrate these ideas, this article discusses maps for "navigating" cities, made with open data. In other words, initiatives are shown that improve the relationship between citizens and their urban environment from different aspects such as accessibility, school safety and citizen participation. The first project is Mapcesible, which allows users to map and assess the accessibility of different locations in Spain. The second, Eskola BideApp, a mobile application designed to support safe school routes. And finally, maps that promote transparency and citizen participation in urban management. The first identifies noise pollution, the second locates available services in various areas within 15 minutes and the third displays banks in the city. These maps use a variety of public data sources to provide a detailed overview of different aspects of urban life.
The first initiative is a project of a large foundation, the second a collaborative and local proposal, and the third a personal project. Although they are based on very different approaches, all three have in common the use of public and open data and the vocation to help people understand and experience the city. The variety of origins of these projects indicates that the use of public and open data is not limited to large organisations.
Below is a summary of each project, followed by a comparison and reflection on the use of public and open data in urban environments.
Mapcesible, map for people with reduced mobility
Mapcessible was launched in 2019 to assess the accessibility of various spaces such as shops, public toilets, car parks, accommodation, restaurants, cultural spaces and natural environments.

Figure 1. Mapcesible. Source: https://mapcesible.fundaciontelefonica.com/intro
This project is supported by organizations such as the NGO Spanish Confederation of People with Physical and Organic Disabilities (COCEMFE) and the company ILUNION. It currently has more than 40,000 evaluated accessible spaces and thousands of users.

Figure 2. Mapcesible. Source: https://mapcesible.fundaciontelefonica.com/filters
Mapcesible uses open data as part of its operation. Specifically, the application incorporates fourteen datasets from official bodies, including the Ministry of Agriculture and Environment, city councils of different cities (including Madrid and Barcelona) and regional governments. This open data is combined with information provided by the users of the application, who can map and evaluate the accessibility of the places they visit. This combination of official data and citizen collaboration allows Mapcesible to provide up-to-date and detailed information on the accessibility of various spaces throughout Spain, thus benefiting people with reduced mobility.
Eskola BideAPP, application to define safe school routes.
Eskola BideAPP is an application developed by Montera34 - a team dedicated to data visualisation and the development of collaborative projects - in alliance with the Solasgune Association to support school pathways. Eskola BideAPP has served to ensure that boys and girls can access their schools safely and efficiently. The project mainly uses public data from the OpenStreetMap, e.g. geographical and cartographic data on streets, pavements, crossings, as well as data collected during the process of creating safe routes for children to walk to school in order to promote their autonomy and sustainable mobility.
The application offers an interactive dashboard to visualise the collected data, the generation of paper maps for sessions with students, and the creation of reports for municipal technicians. It uses technologies such as QGIS (a free and open source geographic information system) and a development environment for the R programming language, dedicated to statistical computing and graphics.
The project is divided into three main stages:
- Data collection through questionnaires in classrooms.
- Analysis and discussion of results with the children to co-design personalised routes.
- Testing of the designed routes.
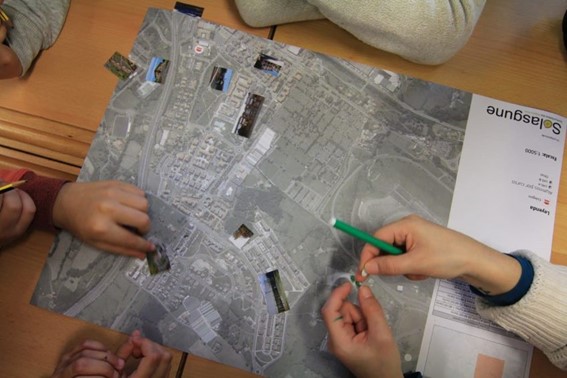
Figure 3. Eskola BideaAPP. Photo by Julián Maguna (Solasgune). Source: https://montera34.com/project/eskola-bideapp/
Pablo Rey, one of the promoters of Montera34 together with Alfonso Sánchez, reports for this article that Eskola BideAPP, since 2019, has been used in eight municipalities, including Derio, Erandio, Galdakao, Gatika, Plentzia, Leioa, Sopela and Bilbao. However, it is currently only operational in the latter two. "The idea is to implement it in Portugalete at the beginning of 2025," he adds.
It''s worth noting the maps from Montera34 that illustrated the effect of Airbnb in San Sebastián and other cities, as well as the data analyses and maps published during the COVID-19 pandemic, which also visualized public data.In addition, Montera34 has used public data to analyse abstention, school segregation, minor contracts or make open data available to the public. For this last project, Montera34 has started with the ordinances of the Bilbao City Council and the minutes of its plenary sessions, so that they are not only available in a PDF document but also in the form of open and accessible data.
Mapas de Madrid sobre contaminación acústica, servicios y ubicación de bancos
Abel Vázquez Montoro has made several maps with open data that are very interesting, for example, the one made with data from the Strategic Noise Map (MER) offered by the Madrid City Council and land registry data. The map shows the noise affecting each building, facade and floor in Madrid.

Figure 4. Noise maps in Madrid. Source: https://madb.netlify.app/.
This map is organised as a dashboard with three sections: general data of the area visible on the map, dynamic 2D and 3D map with configurable options and detailed information on specific buildings. It is an open, free, non-commercial platform that uses free and open source software such as GitLab - a web-based Git repository management platform - and QGIS. The map allows the assessment of compliance with noise regulations and the impact on quality of life, as it also calculates the health risk associated with noise levels, using the attributable risk ratio (AR%).
15-minCity is another interactive map that visualises the concept of the "15-minute city" applied to different urban areas, i.e. it calculates how accessible different services are within a 15-minute walking or cycling radius from any point in the selected city.

Figure 5. 15-minCity. Source: https://whatif.sonycsl.it/15mincity/15min.php?idcity=9166
Finally, "Where to sit in Madrid" is another interactive map that shows the location of benches and other places to sit in public spaces in Madrid, highlighting the differences between rich (generally with more public seating) and poor (with less) neighbourhoods. This map uses the map-making tool, Felt, to visualise and share geospatial information in an accessible way. The map presents different types of seating, including traditional benches, individual seats, bleachers and other types of seating structures.

Figure 6. Where to sit in Madrid. Source: https://felt.com/map/Donde-sentarse-en-Madrid-TJx8NGCpRICRuiAR3R1WKC?loc=40.39689,-3.66392,13.97z
Its maps visualise public data on demographic information (e.g. population data by age, gender and nationality), urban information on land use, buildings and public spaces, socio-economic data (e.g. income, employment and other economic indicators for different districts and neighbourhoods), environmental data, including air quality, green spaces and other related aspects, and mobility data.
What do they have in common?
| Name | Promoter | Type of data used | Profit motive | Users | Characteristics |
|---|---|---|---|---|---|
| Mapcesible | Telefónica Foundation | Combines user-generated and public data (14 open data sets from government agencies) | Non-profit | More than 5.000 | Collaborative app, available on iOS and Android, more than 40,000 mapped accessible points. |
| Eskola BideAPP | Montera34 and Solasgune Association | Combines user-generated and public data (classroom questionnaires) and some public data. | Non-profit. | 4.185 | Focus on safe school routes, uses QGIS and R for data processing |
| Mapa Estratégico de Ruido (MER) | Madrid City Council | 2D and 3D geographic and visible area data | Non-profit | No data | It allows the assessment of compliance with noise regulations and the impact on quality of life, as it also calculates the associated health risk. |
| 15 min-City | Sony GSL | Geographic data and services | Non-profit | No data | Interactive map visualising the concept of the "15-minute city" applied to different urban areas. |
| MAdB "Dónde sentarse en Madrid" | Private | Public data (demographic, electoral, urban, socio-economic, etc.) | Non-profit | No data | Interactive maps of Madrid |
Figure 7. Comparative table of solutions
These projects share the approach of using open data to improve access to urban services, although they differ in their specific objectives and in the way information is collected and presented. Mapcesible, Eskola BideApp, MAdB and "Where to sit in Madrid" are of great value.
On the one hand, Mapcesible offers unified and updated information that allows people with disabilities to move around the city and access services. Eskola BideApp involves the community in the design and testing of safe routes for walking to school; this not only improves road safety, but also empowers young people to be active agents in urban planning. In the meantime, 15-min city, MER and the maps developed by Vázquez Montoro visualise complex data about Madrid so that citizens can better understand how their city works and how decisions that affect them are made.
Overall, the value of these projects lies in their ability to create a data culture, teaching how to value, interpret and use information to improve communities.
Content created by Miren Gutiérrez, PhD and researcher at the University of Deusto, expert in data activism, data justice, data literacy, and gender disinformation. The contents and viewpoints reflected in this publication are the sole responsibility of the author.

Comments