Noticia
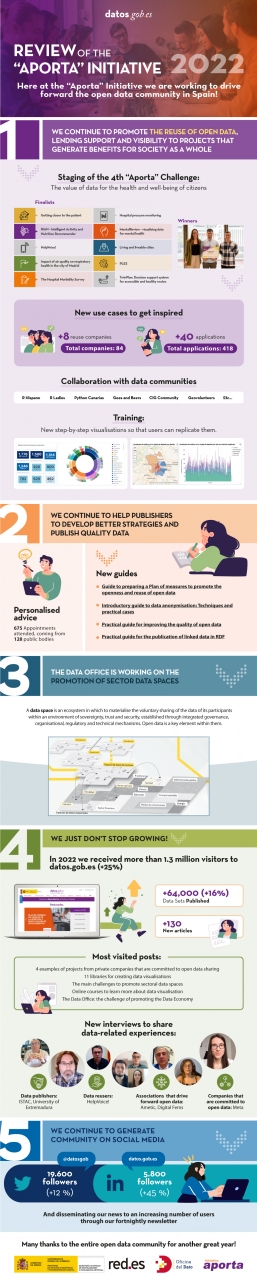
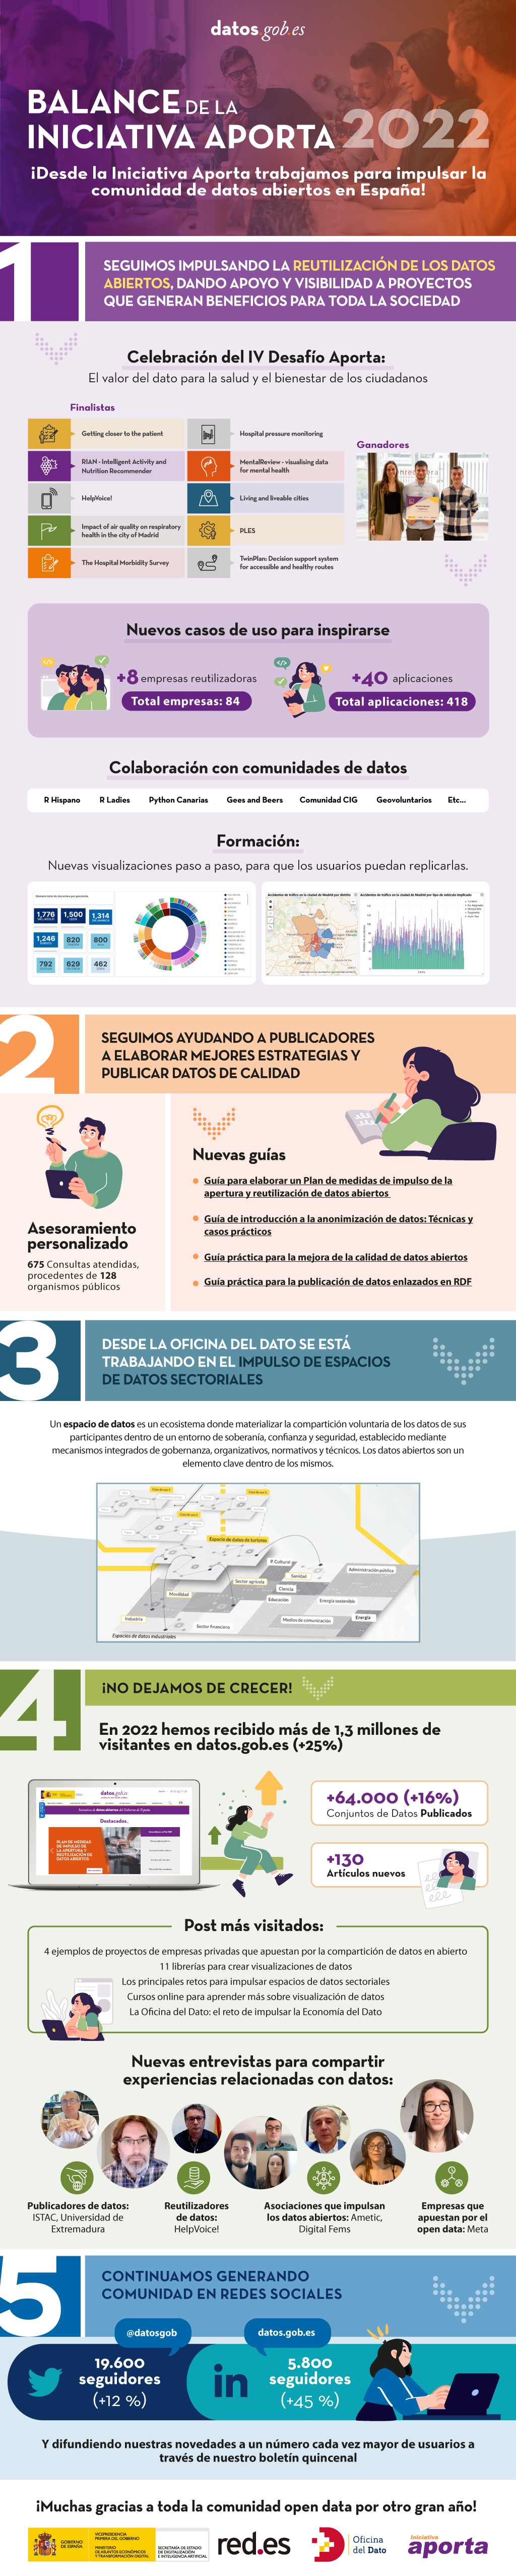
Just a few days before the end of 2022, we’d like to take this opportunity to take stock of the year that is drawing to a close, a period during which the open data community has not stopped growing in Spain and in which we have joined our joint forces and desires with the Data Office. The latter unit is responsible for boosting the management, sharing and use of data throughout all the production sectors of the Spanish Economy and Society, focusing its efforts in particular on promoting spaces for sharing and making use of sectoral data.
It is precisely thanks to the incorporation of the Data Office under the Aporta Initiative that we have been able to double the dissemination effect and promote the role that open data plays in the development of the data economy.
Concurrently, during 2022 we have continued working to bring open data closer to the public, the professional community and public administrations. Thus, and with the aim of promoting the reuse of open data for social purposes, we have once again organised a new edition of the Aporta Challenge.
Focusing on the health and well-being of citizens, the fourth edition of this competition featured three winners of the very highest level and the common denominator of their digital solutions is to improve the physical and mental health of people, thanks to services developed with open data.
New examples of use cases and step-by-step visualisations
In turn, throughout this year we have continued to characterise new examples of use cases that help to increase the catalogue of open data reuse companies and applications. With the new admissions, datos.gob.es already has a catalogue of 84 reuse companies and a total of 418 applications developed from open data. Of the latter, more than 40 were identified in 2022.
Furthermore, since last year we inaugurated the step-by -step visualisations section, we have continued to explore their potential so that users can be inspired and easily replicate the examples.
Reports, guides and audio-visual material to promote the use of open data
For the purpose of continuing to provide advice to the communities of open data publishers and reusers, another of the mainstays in 2022 has been a focus on offering innovative reports on the latest trends in artificial intelligence and other emerging technologies, as well as the development of guides , infographics and videos which foster an up-close knowledge of new use cases and trends related with open data.
Some of the most frequently read articles at the datos.gob.es portal have been '4 examples of projects by private companies that are committed to open data sharing', 'How is digital transformation evolving in Spain?' either 'The main challenges to promote sectoral data spaces', inter alia. As far as the interviews are concerned, we would highlight those held with the winners of the 4th “Aporta” Challenge, with Hélène Verbrugghe, Public Policy Manager for Spain and Portugal of Meta or with Alberto González Yanes, Head of the Economic Statistics Service of the Canary Islands Institute of Statistics (ISTAC), inter alia.
Finally, we would like to thank the open data community for its support for another year. During 2022, we have managed to ensure that the National Data Catalogue exceeds 64,000 published data sets. In addition, datos.gob.es has received more than 1,300,000 visits, 25% more than in 2021, and the profiles of datos.gob.es on LinkedIn and Twitter have grown by 45% and 12%, respectively.
Here at datos.gob.es and the Data Office we are taking on this new year full of enthusiasm and a desire to work so that open data keep making progress in Spain through publishers and reusers.
Here's to a highly successful 2023!
If you’d like to see the infographic in full size you can click here.
** In order to access the links included in the image itself, please download the pdf version available below.
Documentación
The FEMP's Network of Local Entities for Transparency and Citizen Participation has just presented a guide focused on data visualisation. The document, which takes as a reference the Guide to data visualisation developed by the City Council of L'Hospitalet, has been prepared based on the search for good practices promoted by public and private organisations.
The guide includes recommendations and basic criteria to represent data graphically, facilitating its comprehension. In principle, it is aimed at all the entities that are members of the FEMP's Network of Local Entities for Transparency and Citizen Participation. However, it is also useful for anyone wishing to acquire a general knowledge of data visualisation.
Specifically, the guide has been developed with three objectives in mind:
- To provide principles and good practices in the field of data visualisation.
- To provide a model for the visualisation and communication of local authority data by standardising the use of different visual resources.
- Promote the principles of quality, simplicity, inclusiveness and ethics in data communication.
What does the guide include?
After a brief introduction, the guide begins with a series of basic concepts and general principles to be followed in data visualisation, such as the principle of simplification, the use of space or accessibility and exclusive design. Through graphic examples, the reader learns what to do and what not to do if we want our visualisation to be easily understood.
The guide then focuses on the different stages of designing a data visualisation through a sequential methodological process, as shown in the following diagram:
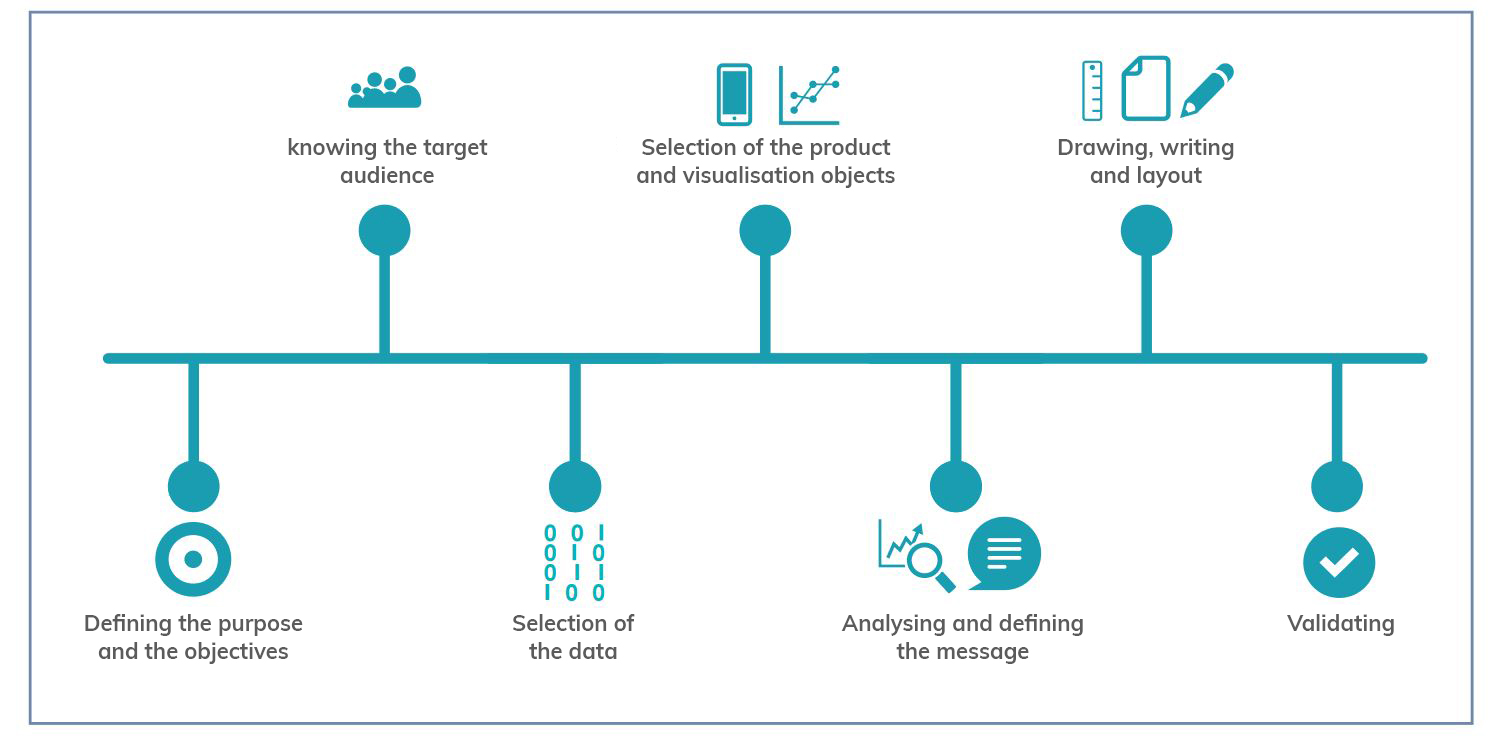
As the image shows, before developing the visualisation, it is essential to take the time to establish the objectives we want to achieve and the audience we are targeting, in order to tailor the message and select the most appropriate visualisation based on what we want to represent.
When representing data, users have at their disposal a wide variety of visualisation objects with different functions and performance. Not all objects are suitable for all cases and it will be necessary to determine the most appropriate one for each specific situation. In this sense, the guide offers several recommendations and guidelines so that the reader is able to choose the right element based on his or her objectives and audience, as well as the data he or she wants to display.
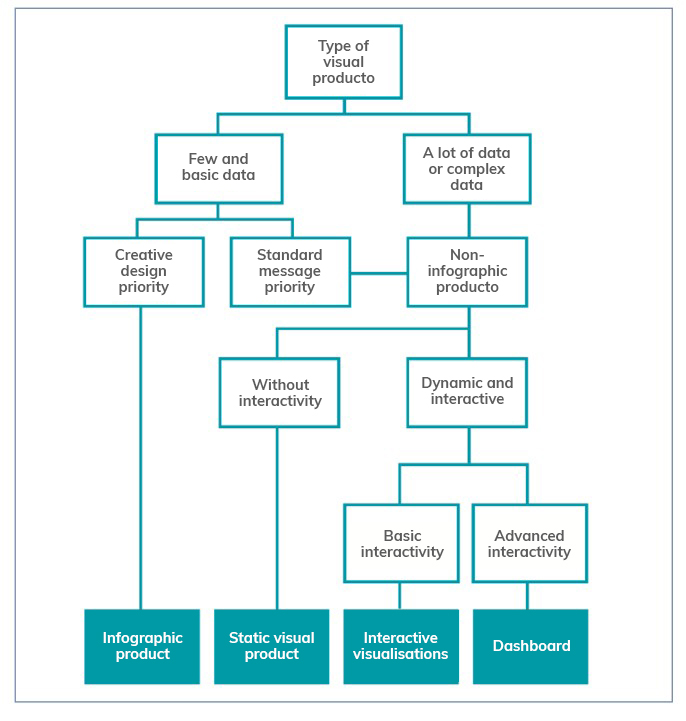
The following chapters focus on the various elements available (infographics, dashboards, indicators, tables, maps, etc.) showing the different subcategories that exist and the good practices to follow in their elaboration, showing numerous examples that facilitate their understanding. Recommendations on the use of the text are also provided.
The guide ends with a selection of resources for further knowledge and data visualisation tools to be considered by anyone who wants to start developing their own visualisations.
You can download the complete guide below, in the "Documentation" section.
Documentación
Data anonymization defines the methodology and set of best practices and techniques that reduce the risk of identifying individuals, the irreversibility of the anonymization process, and the auditing of the exploitation of anonymized data by monitoring who, when, and for what purpose they are used.
This process is essential, both when we talk about open data and general data, to protect people's privacy, guarantee regulatory compliance, and fundamental rights.
The report "Introduction to Data Anonymization: Techniques and Practical Cases," prepared by Jose Barranquero, defines the key concepts of an anonymization process, including terms, methodological principles, types of risks, and existing techniques.
The objective of the report is to provide a sufficient and concise introduction, mainly aimed at data publishers who need to ensure the privacy of their data. It is not intended to be a comprehensive guide but rather a first approach to understand the risks and available techniques, as well as the inherent complexity of any data anonymization process.
What techniques are included in the report?
After an introduction where the most relevant terms and basic anonymization principles are defined, the report focuses on discussing three general approaches to data anonymization, each of which is further integrated by various techniques:
- Randomization: data treatment, eliminating correlation with the individual, through the addition of noise, permutation, or Differential Privacy.
- Generalization: alteration of scales or orders of magnitude through aggregation-based techniques such as K-Anonymity, L-Diversity, or T-Closeness.
- Pseudonymization: replacement of values with encrypted versions or tokens, usually through HASH algorithms, which prevent direct identification of the individual unless combined with additional data, which must be adequately safeguarded.
The document describes each of these techniques, as well as the risks they entail, providing recommendations to avoid them. However, the final decision on which technique or set of techniques is most suitable depends on each particular case.
The report concludes with a set of simple practical examples that demonstrate the application of K-Anonymity and pseudonymization techniques through encryption with key erasure. To simplify the execution of the case, users are provided with the code and data used in the exercise, available on GitHub. To follow the exercise, it is recommended to have minimal knowledge of the Python language.
You can now download the complete report, as well as the executive summary and a summary presentation.
Noticia
On 25 October, the workshop "Use cases of the Spanish Tourism data space" was held, with the aim of starting the design and deployment of the first interoperable Tourism dataspace at European level, built under the Gaia-X seal.
This activity, organised by the Data Office in collaboration with the Secretary of State for Tourism, through SEGITTUR, is part of the public-private collaboration model for the constitution of sectoral data spaces promoted by the Secretary of State for Digitalisation and Artificial Intelligence of the Ministry of Economic Affairs and Digital Transformation. The event is a continuation of the process of revitalisation of national data spaces that began with the event "Governmental impulse to a data-driven reindustrialisation - Spanish Tourism Data Space", and is part of the actions carried out by the Government of Spain to create the legal, political, technological and funding environment conducive to the deployment of the data economy, as detailed in the Digital Spain 2026 strategy. This action is aligned with the European scene.
Why a tourism data space?
Data is a vital element in the development and sustainability of the tourism sector. Enabling its proper valorisation reinforces the already significant contribution of the sector to the national economy. The place to realise this latent value is the data space.
According to their European meaning, data spaces are ecosystems where different actors share data voluntarily and securely. In this way, the sharing of data between participants is realised while respecting the principles of self-determination in data sharing (sovereignty), privacy, transparency, security and fair competition.
Tourism, given its ecosystem of public and private participants of different sizes and technological maturity, is an optimal environment in which to test the benefits of these federated data ecosystems. They facilitate the extraction of value from non-traditional data sources, with high scalability, and guaranteeing in any case robust conditions of security, privacy and therefore data sovereignty.
The high availability of tourism data brings great benefits to the sector, as it facilitates the creation of more personalised offers, products and services that provide an improved experience tailored to the needs of customers, thus improving the ability to attract tourists. It also fosters greater knowledge of the sector and informed decision-making by both public and private organisations, which can more easily identify new business opportunities.
An eminently practical workshop
During the workshop, the more than one hundred participants, from both the tourism and technology sectors, tackled the detailed characterisation of different data sharing use cases that could satisfy specific business needs in the tourism sector. The participants were organised around different working groups considering the maturity of the use cases proposed, seeking to encourage the variety of profiles and the grouping of interests. The different work dynamics were carried out in accordance with the methodology for the discovery and design of use cases developed by the Data Office, allowing the validation of their content and their scalability to the rest of the sectoral data spaces to be created.
During the final conclusions of the conference, the Data Office emphasised the central role of data spaces as a place to create new business opportunities within the tourism sector. It was also highlighted that the synergies derived from data sharing go beyond the sum of individual data, and investments, duly supported by public-private collaboration, must be seen beyond the short term and need to be backed by management. The problem to be solved is a business problem and the solution is not exclusively technological. Simple solutions must be sought that are easy to adopt and use, with robust, agile and simple deployment that do not generate barriers to entry for small participants. Taking advantage of the current technological, economic, political and social situation, it is possible to develop a tourism sector that is data-oriented, sustainable, generates social value and is inclusive.
In this link you can see the presentation of the workshop, which includes, among others, methodological aspects for the creation of data spaces, such as the characteristics or the elements to be considered.Below you can also access several infographics:
- Tourism Data Spaces and the Gaia-X Model
- Use case sheet for data sharing
- Identification and proposal of use cases in tourism
- Elements involved in the data sharing process
Documentación
When publishing open data, it is essential to ensure its quality. If data is well documented and of the required quality, it will be easier to reuse, as there will be less additional work for cleaning and processing. In addition, poor data quality can be costly for publishers, who may spend more money on fixing errors than on avoiding potential problems in advance.
To help in this task, the Aporta Initiative has developed the "Practical guide for improving the quality of open data", which provides a compendium of guidelines for acting on each of the characteristics that define quality, driving its improvement. The document takes as a reference the data.europe.eu data quality guide, published in 2021 by the Publications Office of the European Union.
Who is the guide aimed at?
The guide is aimed at open data publishers, providing them with clear guidelines on how to improve the quality of their data.
However, this collection can also provide guidance to data re-users on how to address the quality weaknesses that may be present in the datasets they work with.
What does the guide include?
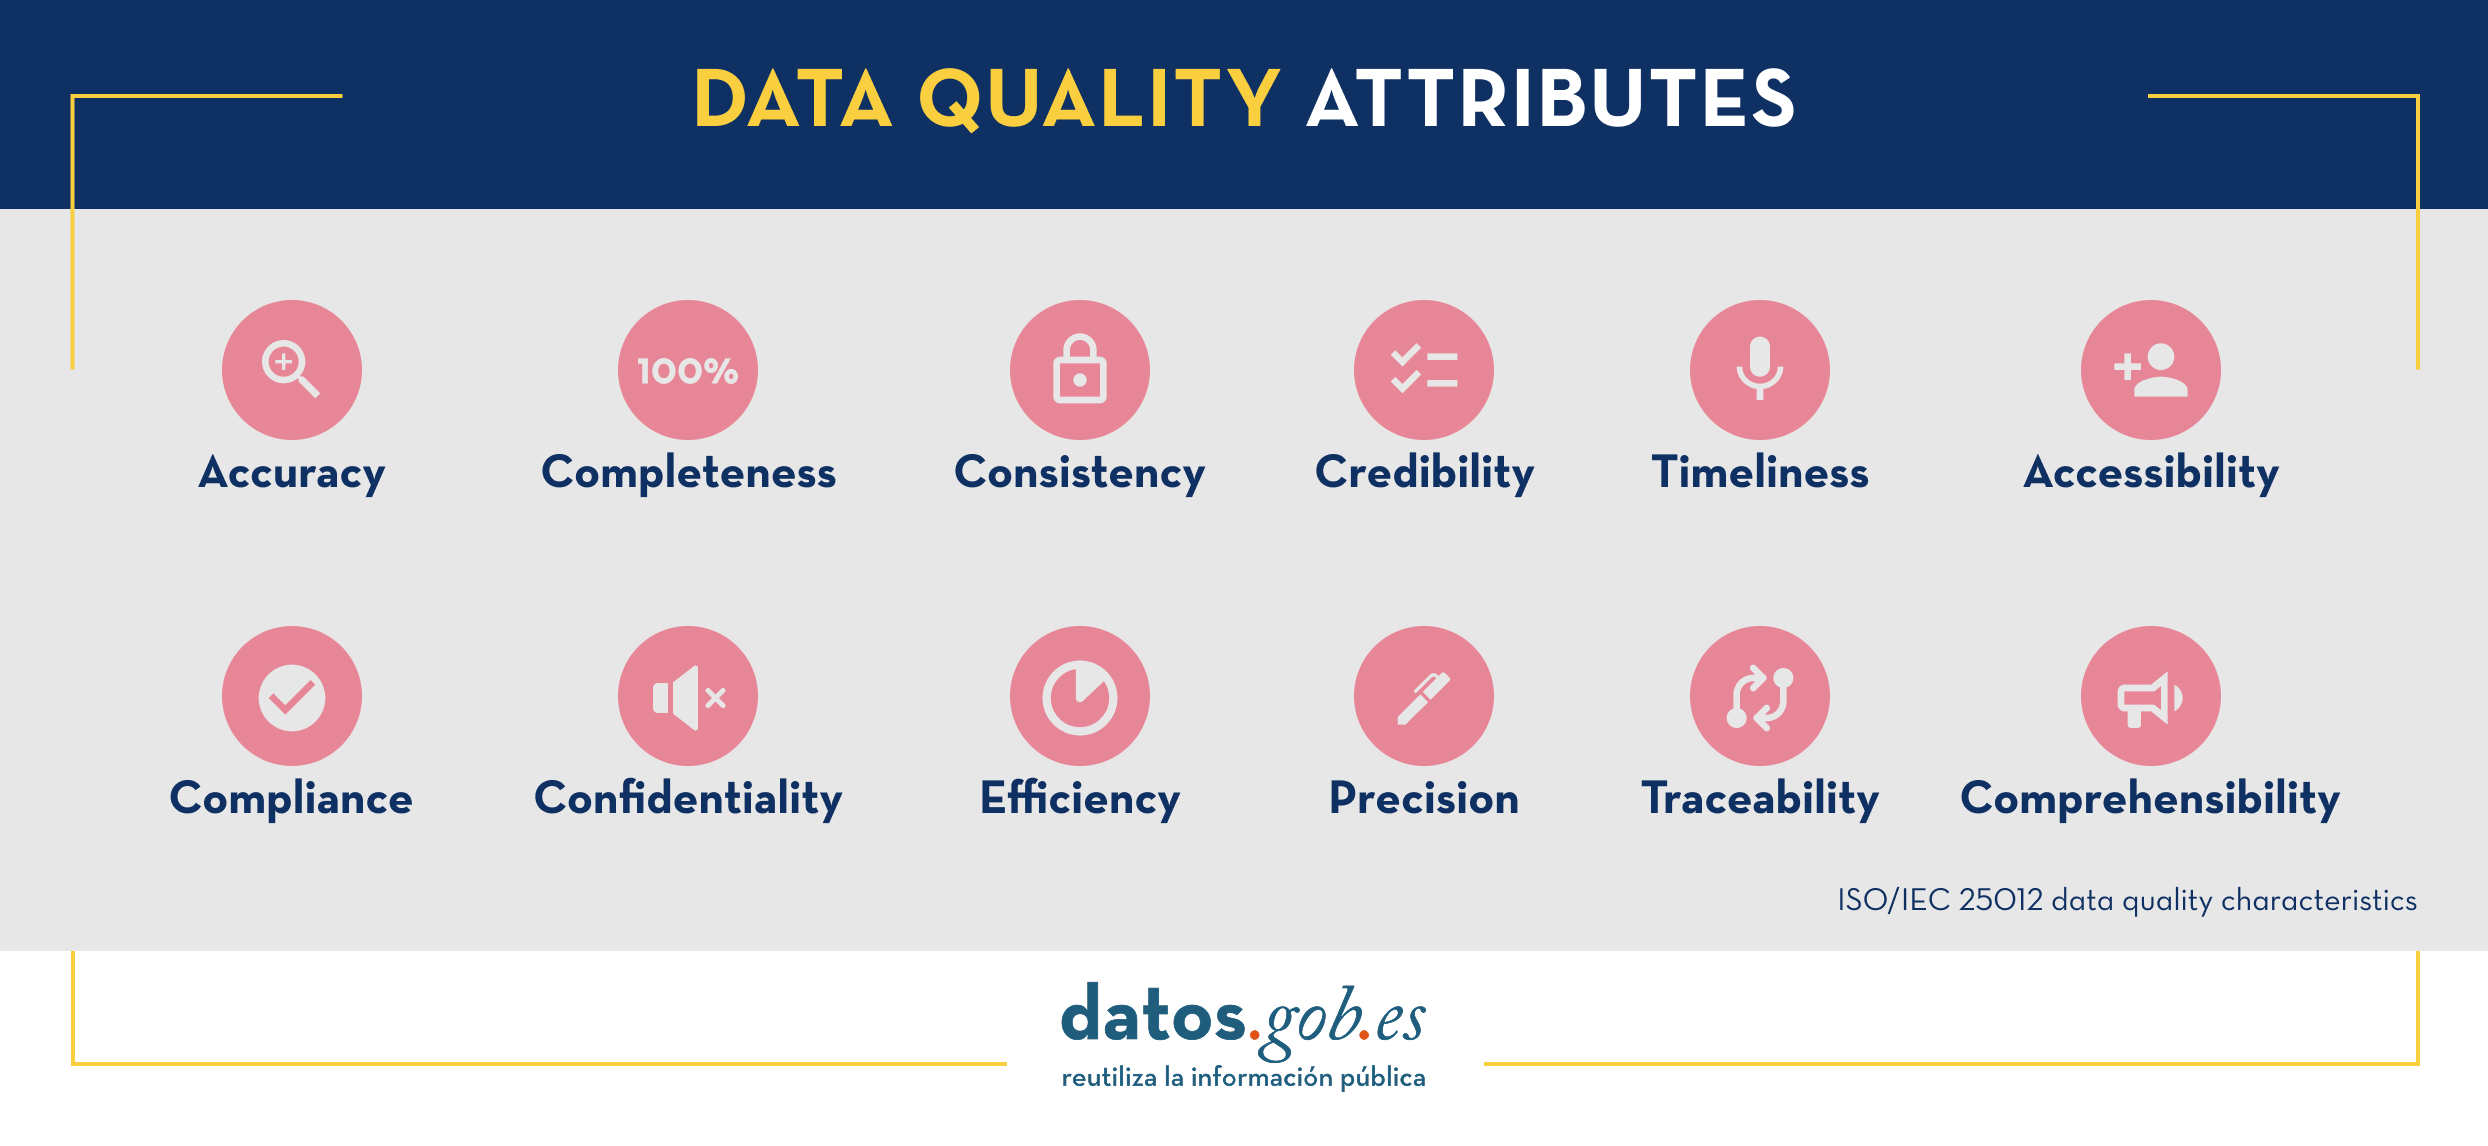
The document begins by defining the characteristics, according to ISO/IEC 25012, that data must meet in order to be considered quality data, which are shown in the following image
Next, the bulk of the guide focuses on the description of recommendations and good practices to avoid the most common problems that usually arise when publishing open data, structured as follows:
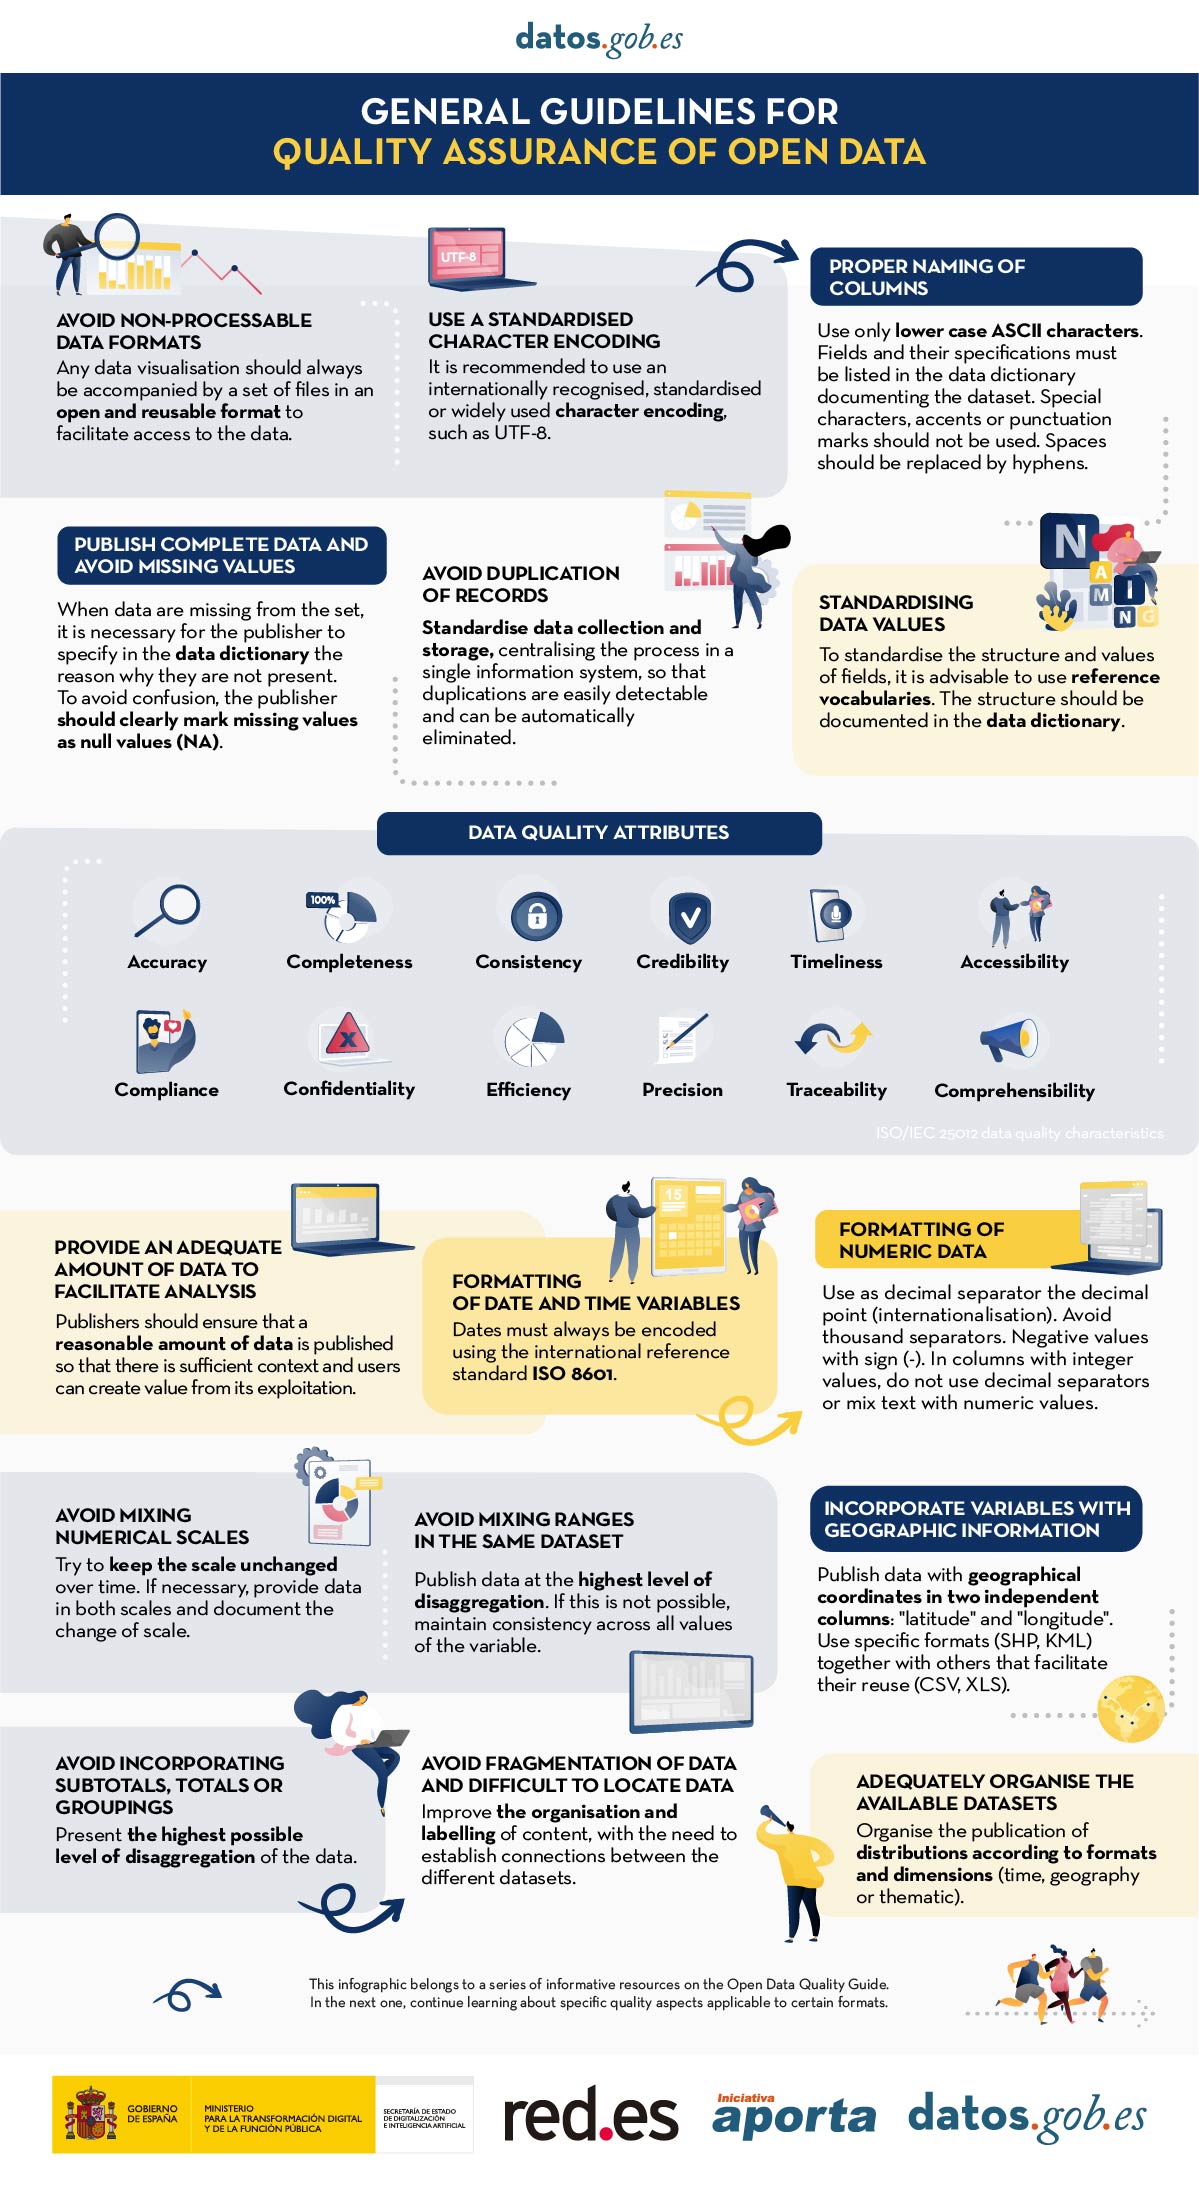
- A first part where a series of general guidelines are detailed to guarantee the quality of open data, such as, for example, using a standardised character encoding, avoiding duplicity of records or incorporating variables with geographic information. For each guideline, a detailed description of the problem, the quality characteristics affected and recommendations for their resolution are provided, together with practical examples to facilitate understanding.
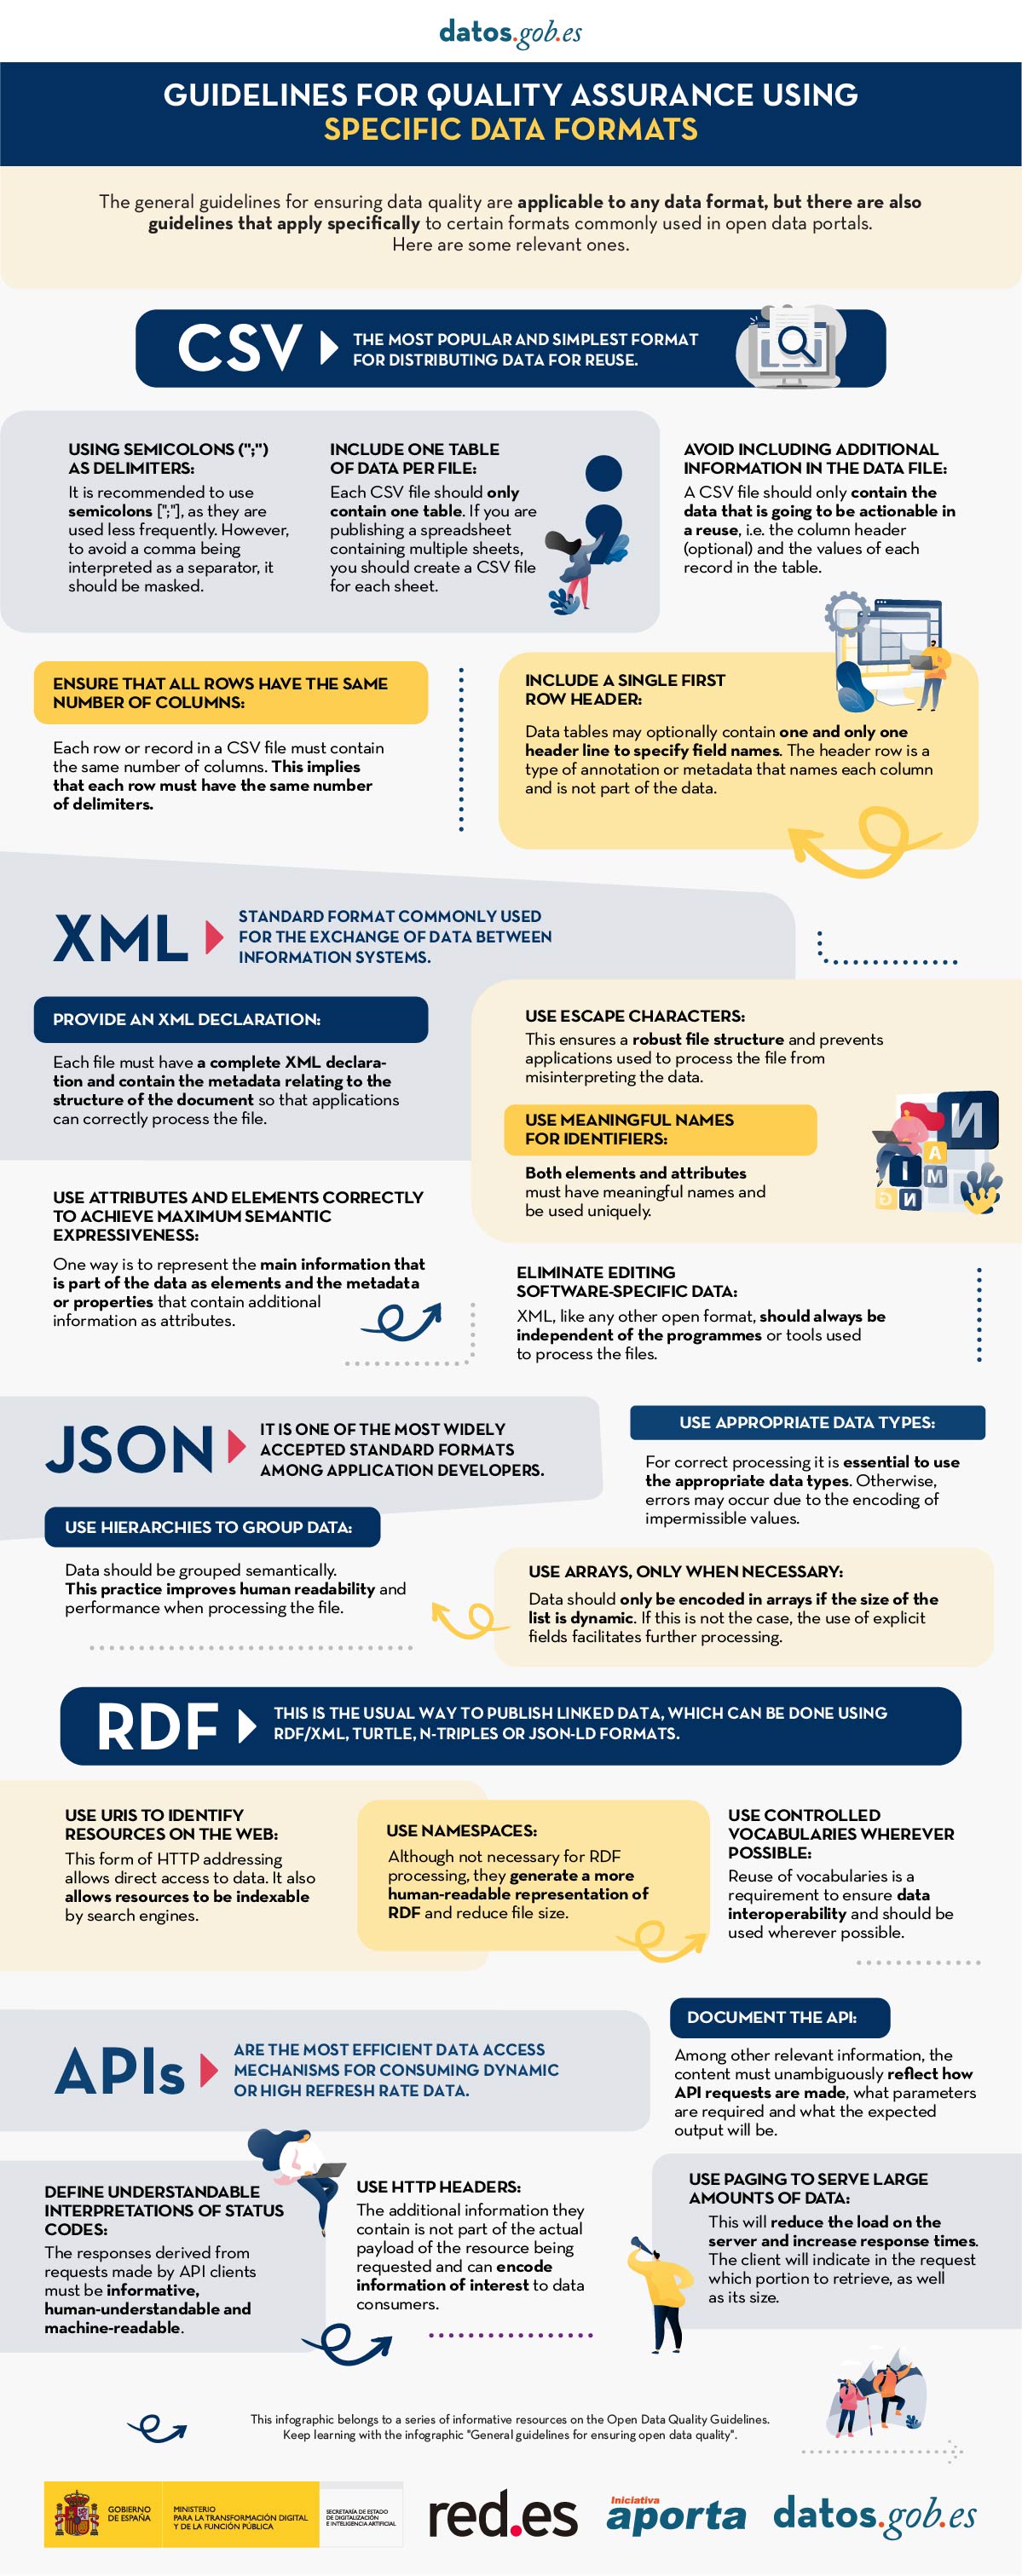
- A second part with specific guidelines for ensuring the quality of open data according to the data format used. Specific guidelines are included for CSV, XML, JSON, RDF and APIs.
- Finally, the guide also includes recommendations for data standardisation and enrichment, as well as for data documentation, and a list of useful tools for working on data quality.
You can download the guide here or at the bottom of the page (only available in Spanish).
Additional materials
The guide is accompanied by a series of infographics that compile the above guidelines:
- Infographic "General guidelines for quality assurance of open data".
- Infographic "Guidelines for quality assurance using specific data formats”.
Documentación
A data space is an ecosystem where, on a voluntary basis, the data of its participants (public sector, large and small technology or business companies, individuals, research organizations, etc.) are pooled. Thus, under a context of sovereignty, trust and security, products or services can be shared, consumed and designed from these data spaces.
This is especially important because if the user feels that he has control over his own data, thanks to clear and concise communication about the terms and conditions that will mark its use, the sharing of such data will become effective, thus promoting the economic and social development of the environment.
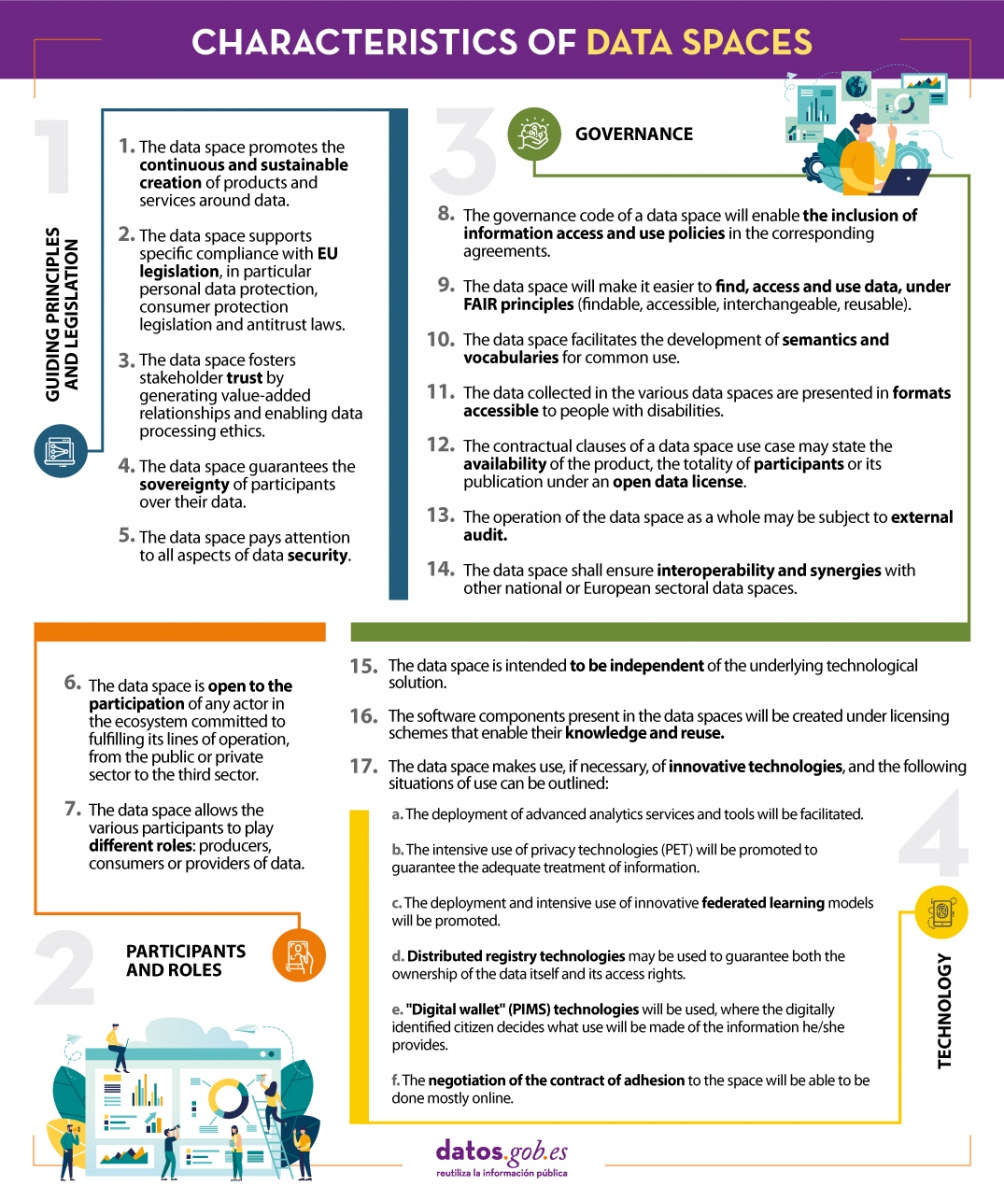
In line with this idea and with the aim of improving the design of data spaces, the Data Office establishes a series of characteristics whose objective is to record the regulations that must be followed to design, from an architectural point of view, efficient and functional data spaces.
We summarize in the following visual some of the most important characteristics for the creation of data spaces. To consult the original document and all the standards proposed by the Data Office, please download the attached document at the end of this article.
(You can download the accessible version in word here)
Blog
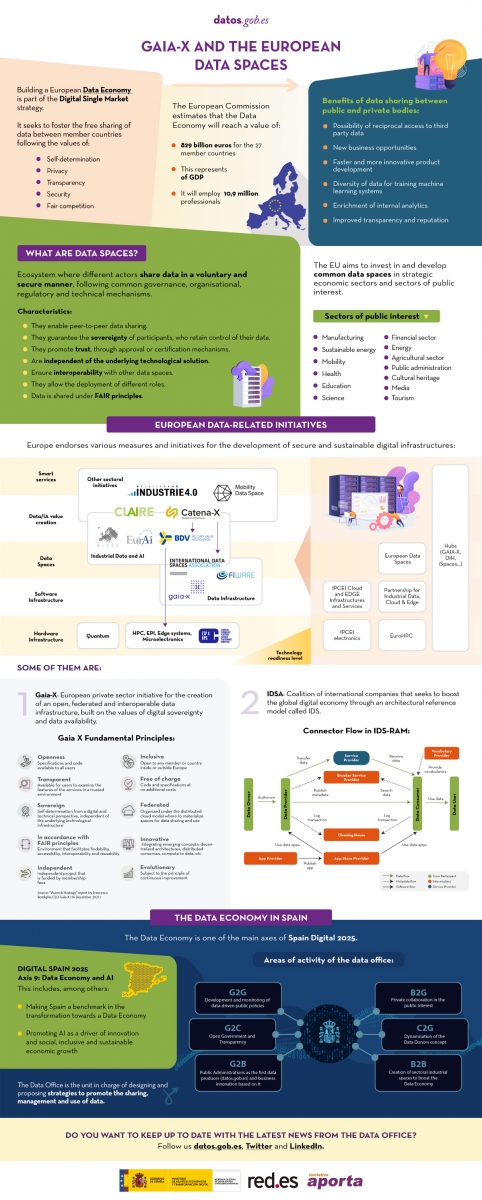
The following infographic shows the context driving the development of data spaces, focusing on some related European initiatives such as Gaia-X and ISDA. For more in-depth content you can read the following articles:
- The importance of deploying European Data Spaces
- Gaia-X and the drive for the data economy
- https://datos.gob.es/en/blog/ids-ram-reference-architecture-model-and-its-role-data-spaces
- The Data Office: the challenge of promoting the Data Economy
Click on the infographic to see it in full size and access the links:
Blog
Last December, the Congress of Deputies approved Royal Decree-Law 24/2021, which included the transposition of Directive (EU) 2019/1024 on open data and the reuse of public sector information. This Royal Decree amends Law 37/2007 on the reuse of public sector information, including new requirements for public bodies, including facilitating access to high-value data.
High-value data are data whose reuse is associated with considerable benefits to society, the environment and the economy. Initially, the European Commission highlighted as high-value data those belonging to the categories of geospatial, environmental, meteorological, statistical, societal and mobility data, although these classes can be extended both by the Commission and by the Ministry of Economic Affairs and Digital Transformation through the Data Office. According to the Directive, this type of data "shall be made available for reuse in a machine-readable format, through appropriate application programming interfaces and, where appropriate, in the form of bulk download". In other words, among other things, an API is required.
What is an API?
An application programming interface or API is a set of definitions and protocols that enable the exchange of information between systems. It should be noted that there are different types of APIs based on their architecture, communication protocols and operating systems.
APIs offer a number of advantages for developers, since they automate data and metadata consumption, facilitate mass downloading and optimize information retrieval by supporting filtering, sorting and paging functionalities. All of this results in both economic and time savings.
In this sense, many open data portals in our country already have their own APIs to facilitate access to data and metadata. In the following infographic you can see some examples at national, regional and local level, including information about the API of datos.gob.es. The infographic also includes brief information on what an API is and what is needed to use it.

Click here to see the infographic in full size and in its accessible version
These examples show the effort that public agencies in our country are making to facilitate access to the information they keep in a more efficient and automated way, in order to promote the reuse of their open data.
In datos.gob.es we have a Practical Guide for the publication of open data using APIs where a series of guidelines and good practices are detailed to define and implement this mechanism in an open data portal.
Content prepared by the datos.gob.es team.