Blog
Open health data is one of the most valuable assets of our society. Well managed and shared responsibly, they can save lives, drive medical discoveries, or even optimize hospital resources. However, for decades, this data has remained fragmented in institutional silos, with incompatible formats and technical and legal barriers that made it difficult to reuse. Now, the European Union is radically changing the landscape with an ambitious strategy that combines two complementary approaches:
- Facilitate open access to statistics and non-sensitive aggregated data.
- Create secure infrastructures to share personal health data under strict privacy guarantees.
In Spain, this transformation is already underway through the National Health Data Space or research groups that are at the forefront of the innovative use of health data. Initiatives such as IMPACT-Data, which integrates medical data to drive precision medicine, demonstrate the potential of working with health data in a structured and secure way. And to make it easier for all this data to be easy to find and reuse, standards such as HealthDCAT-AP are implemented.
All this is perfectly aligned with the European strategy of the European Health Data Space Regulation (EHDS), officially published in March 2025, which is also integrated with the Open Data Directive (ODD), in force since 2019. Although the two regulatory frameworks have different scopes, their interaction offers extraordinary opportunities for innovation, research and the improvement of healthcare across Europe.
A recent report prepared by Capgemini Invent for data.europa.eu analyzes these synergies. In this post, we explore the main conclusions of this work and reflect on its relevance for the Spanish open data ecosystem.
-
Two complementary frameworks for a common goal
On the one hand, the European Health Data Space focuses specifically on health data and pursues three fundamental objectives:
- Facilitate international access to health data for patient care (primary use).
- Promote the reuse of this data for research, public policy, and innovation (secondary use).
- Technically standardize electronic health record (EHR) systems to improve cross-border interoperability.

For its part, the Open Data Directive has a broader scope: it encourages the public sector to make government data available to any user for free reuse. This includes High-Value Datasets that must be published for free, in machine-readable formats, and via APIs in six categories that did not originally include "health." However, in the proposal to expand the new categories published by the EU, the health category does appear.
The complementarity between the two regulatory frameworks is evident: while the ODD facilitates open access to aggregated and non-sensitive health statistics, the EHDS regulates controlled access to individual health data under strict conditions of security, consent and governance. Together, they form a tiered data sharing system that maximizes its social value without compromising privacy, in full compliance with the General Data Protection Regulation (GDPR).
Main benefits computer by user groups
The report looks at four main user groups and examines both the potential benefits and challenges they face in combining EHDS data with open data.
-
Patients: Informed Empowerment with Practical Barriers
European patients will gain faster and more secure access to their own electronic health records, especially in cross-border contexts thanks to infrastructures such as MyHealth@EU. This project is particularly useful for European citizens who are displaced in another European country. .
Another interesting project that informs the public is PatientsLikeMe, which brings together more than 850,000 patients with rare or chronic diseases in an online community that shares information of interest about treatments and other issues.
-
Potential health professionals subordinate to integration
On the other hand, healthcare professionals will be able to access clinical patient data earlier and more easily, even across borders, improving continuity of care and the quality of diagnosis and treatment.
The combination with open data could amplify these benefits if tools are developed that integrate both sources of information directly into electronic health record systems.
3. Policymakers: data for better decisions
Public officials are natural beneficiaries of the convergence between EHDS and open data. The possibility of combining detailed health data (upon request and authorisation through the Health Data Access Bodies that each Member State must establish) with open statistical and contextual information would allow for much more robust evidence-based policies to be developed.
The report mentions use cases such as combining health data with environmental information to assess health impacts. A real example is the French Green Data for Health project, which crosses open data on noise pollution with information on prescriptions for sleep medications from more than 10 million inhabitants, investigating correlations between environmental noise and sleep disorders.
4. Researchers and reusers: the main immediate beneficiaries
Researchers, academics and innovators are the group that will most directly benefit from the EHDS-ODD synergy as they have the skills and tools to locate, access, combine and analyse data from multiple sources. In addition, their work already routinely involves the integration of various data sets.
A recent study published in PLOS Digital Health on the case of Andalusia demonstrates how open data in health can democratize research in health AI and improve equity in treatment.
The development of EHDS is being supported by European programmes such as EU4Health, Horizon Europe and specific projects such as TEHDAS2, which help to define technical standards and pilot real applications.
-
Recommendations to maximize impact
The report concludes with four key recommendations that are particularly relevant to the Spanish open data ecosystem:
- Stimulate research at the EHDS-open data intersection through dedicated funding. It is essential to encourage researchers who combine these sources to translate their findings into practical applications: improved clinical protocols, decision tools, updated quality standards.
- Evaluate and facilitate direct use by professionals and patients. Promoting data literacy and developing intuitive applications integrated into existing systems (such as electronic health records) could change this.
- Strengthen governance through education and clear regulatory frameworks. As EHDS technical entities become operationalized, clear regulation defining common regulatory frameworks will be essential.
- Monitor, evaluate and adapt. The period 2025-2031 will see the gradual entry into force of the various EHDS requirements. Regular evaluations are recommended to assess how EHDS is actually being used, which combinations with open data are generating the most value, and what adjustments are needed.
Moreover, for all this to work, the report suggests that portals such as data.europa.eu (and by extension, datos.gob.es) should highlight practical examples that demonstrate how open data complements protected data from sectoral spaces, thus inspiring new applications.
Overall, the role of open data portals will be fundamental in this emerging ecosystem: not only as providers of quality datasets, but also as facilitators of knowledge, meeting spaces between communities and catalysts for innovation. The future of European healthcare is now being written, and open data plays a leading role in that story.
Blog
In the digital age, technological advancements have transformed the field of medical research. One of the factors contributing to technological development in this area is data, particularly open data. The openness and availability of information obtained from health research provide multiple benefits to the scientific community. Open data in the healthcare sector promotes collaboration among researchers, accelerates the validation process of study results, and ultimately helps save lives.
The significance of this type of data is also evident in the prioritized intention to establish the European Health Data Space (EHDS), the first common EU data space emerging from the European Data Strategy and one of the priorities of the Commission for the 2019-2025 period. As proposed by the European Commission, the EHDS will contribute to promoting better sharing and access to different types of health data, not only to support healthcare delivery but also for health research and policymaking.
However, the handling of this type of data must be appropriate due to the sensitive information it contains. Personal data related to health is considered a special category by the Spanish Data Protection Agency (AEPD), and a personal data breach, especially in the healthcare sector, has a high personal and social impact.
To avoid these risks, medical data can be anonymized, ensuring compliance with regulations and fundamental rights, thereby protecting patient privacy. The Basic Anonymization Guide developed by the AEPD based on the Personal Data Protection Commission Singapore (PDPC) defines key concepts of an anonymization process, including terms, methodological principles, types of risks, and existing techniques.
Once this process is carried out, medical data can contribute to research on diseases, resulting in improvements in treatment effectiveness and the development of medical assistance technologies. Additionally, open data in the healthcare sector enables scientists to share information, results, and findings quickly and accessibly, thus fostering collaboration and study replicability.
In this regard, various institutions share their anonymized data to contribute to health research and scientific development. One of them is the FISABIO Foundation (Foundation for the Promotion of Health and Biomedical Research of the Valencian Community), which has become a reference in the field of medicine thanks to its commitment to open data sharing. As part of this institution, located in the Valencian Community, there is the FISABIO-CIPF Biomedical Imaging Unit, which is dedicated, among other tasks, to the study and development of advanced medical imaging techniques to improve disease diagnosis and treatment.
This research group has developed different projects on medical image analysis. The outcome of all their work is published under open-source licenses: from the results of their research to the data repositories they use to train artificial intelligence and machine learning models.
To protect sensitive patient data, they have also developed their own techniques for anonymizing and pseudonymizing images and medical reports using a Natural Language Processing (NLP) model, whereby anonymized data can be replaced by synthetic values. Following their technique, facial information from brain MRIs can be erased using open-source deep learning software.
BIMCV: Medical Imaging Bank of the Valencian Community
One of the major milestones of the Regional Ministry of Universal Health and Public Health, through the Foundation and the San Juan de Alicante Hospital, is the creation and maintenance of the Medical Imaging Bank of the Valencian Community, BIMCV (Medical Imaging Databank of the Valencia Region in English), a repository of knowledge aimed at achieving "technological advances in medical imaging and providing technological coverage services to support R&D projects," as explained on their website.
BIMCV is hosted on XNAT, a platform that contains open-source images for image-based research and is accessible by prior registration and/or on-demand. Currently, the Medical Imaging Bank of the Valencian Community includes open data from research conducted in various healthcare centers in the region, housing data from over 90,000 subjects collected in more than 150,000 sessions.
New Dataset of Radiological Images
Recently, the FISABIO-CIPF Biomedical Imaging Unit and the Prince Felipe Research Center (FISABIO-CIPF) released in open access the third and final iteration of data from the BIMCV-COVID-19 project. They released image data of chest radiographs taken from patients with and without COVID-19, as well as the models they had trained for the detection of different chest X-ray pathologies, thanks to the support of the Regional Ministry of Innovation, the Regional Ministry of Health and the European Union REACT-EU Funds. All of this was made available "for use by companies in the sector or simply for research purposes," explains María de la Iglesia, director of the unit. "We believe that reproducibility is of great relevance and importance in the healthcare sector," she adds. The datasets and the results of their research can be accessed here.
The findings are mapped using the standard terminology of the Unified Medical Language System (UMLS), as proposed by the results of Dr. Aurelia Bustos' doctoral thesis, an oncologist and computer engineer. They are stored in high resolution with anatomical labels in a Medical Image Data Structure (MIDS) format. Among the stored information are patient demographic data, projection type, and imaging study acquisition parameters, among others, all anonymized.
The contribution that such open data projects make to society not only benefits researchers and healthcare professionals but also enables the development of solutions that can have a significant impact on improving healthcare. One of these solutions can be generative AI, which provides interesting results that healthcare professionals can consider in personalized diagnosis and propose more effective treatment, prioritizing their own judgment.
On the other hand, the digitization of healthcare systems is already a reality, including 3D printing, digital twins applied to medicine, telemedicine consultations, or portable medical devices. In this context, the collaboration and sharing of medical data, provided their protection is ensured, contribute to promoting research and innovation in the sector. In other words, open data initiatives for medical research stimulate technological advancements in healthcare.
Therefore, the FISABIO Foundation, together with the Prince Felipe Research Center, where the platform hosting BIMCV is located, stands out as an exemplary case in promoting the openness and sharing of data in the field of medicine. As the digital age progresses, it is crucial to continue promoting data openness and encouraging its responsible use in medical research, for the benefit of society.
Blog
In this post we have described step-by-step a data science exercise in which we try to train a deep learning model with a view to automatically classifying medical images of healthy and sick people.
Diagnostic imaging has been around for many years in the hospitals of developed countries; however, there has always been a strong dependence on highly specialised personnel. From the technician who operates the instruments to the radiologist who interprets the images. With our current analytical capabilities, we are able to extract numerical measures such as volume, dimension, shape and growth rate (inter alia) from image analysis. Throughout this post we will try to explain, through a simple example, the power of artificial intelligence models to expand human capabilities in the field of medicine.
This post explains the practical exercise (Action section) associated with the report “Emerging technologies and open data: introduction to data science applied to image analysis”. Said report introduces the fundamental concepts that allow us to understand how image analysis works, detailing the main application cases in various sectors and highlighting the role of open data in their implementation.
Previous projects
However, we could not have prepared this exercise without the prior work and effort of other data science lovers. Below we have provided you with a short note and the references to these previous works.
- This exercise is an adaptation of the original project by Michael Blum on the STOIC2021 - disease-19 AI challenge. Michael's original project was based on a set of images of patients with Covid-19 pathology, along with other healthy patients to serve as a comparison.
- In a second approach, Olivier Gimenez used a data set similar to that of the original project published in a competition of Kaggle. This new dataset (250 MB) was considerably more manageable than the original one (280GB). The new dataset contained just over 1,000 images of healthy and sick patients. Olivier's project code can be found at the following repository.
Datasets
In our case, inspired by these two amazing previous projects, we have built an educational exercise based on a series of tools that facilitate the execution of the code and the possibility of examining the results in a simple way. The original data set (chest x-ray) comprises 112,120 x-ray images (front view) from 30,805 unique patients. The images are accompanied by the associated labels of fourteen diseases (where each image can have multiple labels), extracted from associated radiological reports using natural language processing (NLP). From the original set of medical images we have extracted (using some scripts) a smaller, delimited sample (only healthy people compared with people with just one pathology) to facilitate this exercise. In particular, the chosen pathology is pneumothorax.
If you want further information about the field of natural language processing, you can consult the following report which we already published at the time. Also, in the post 10 public data repositories related to health and wellness the NIH is referred to as an example of a source of quality health data. In particular, our data set is publicly available here.
Tools
To carry out the prior processing of the data (work environment, programming and drafting thereof), R (version 4.1.2) and RStudio (2022-02-3) was used. The small scripts to help download and sort files have been written in Python 3.
Accompanying this post, we have created a Jupyter notebook with which to experiment interactively through the different code snippets that our example develops. The purpose of this exercise is to train an algorithm to be able to automatically classify a chest X-ray image into two categories (sick person vs. non-sick person). To facilitate the carrying out of the exercise by readers who so wish, we have prepared the Jupyter notebook in the Google Colab environment which contains all the necessary elements to reproduce the exercise step-by-step. Google Colab or Collaboratory is a free Google tool that allows you to programme and run code on python (and also in R) without the need to install any additional software. It is an online service and to use it you only need to have a Google account.
Logical flow of data analysis
Our Jupyter Notebook carries out the following differentiated activities which you can follow in the interactive document itself when you run it on Google Colab.
- Installing and loading dependencies.
- Setting up the work environment
- Downloading, uploading and pre-processing of the necessary data (medical images) in the work environment.
- Pre-visualisation of the loaded images.
- Data preparation for algorithm training.
- Model training and results.
- Conclusions of the exercise.
Then we carry out didactic review of the exercise, focusing our explanations on those activities that are most relevant to the data analysis exercise:
- Description of data analysis and model training
- Modelling: creating the set of training images and model training
- Analysis of the training result
- Conclusions
Description of data analysis and model training
The first steps that we will find going through the Jupyter notebook are the activities prior to the image analysis itself. As in all data analysis processes, it is necessary to prepare the work environment and load the necessary libraries (dependencies) to execute the different analysis functions. The most representative R package of this set of dependencies is Keras. In this article we have already commented on the use of Keras as a Deep Learning framework. Additionally, the following packages are also required: htr; tidyverse; reshape2; patchwork.
Then we have to download to our environment the set of images (data) we are going to work with. As we have previously commented, the images are in remote storage and we only download them to Colab at the time we analyse them. After executing the code sections that download and unzip the work files containing the medical images, we will find two folders (No-finding and Pneumothorax) that contain the work data.

Once we have the work data in Colab, we must load them into the memory of the execution environment. To this end, we have created a function that you will see in the notebook called process_pix(). This function will search for the images in the previous folders and load them into the memory, in addition to converting them to grayscale and normalising them all to a size of 100x100 pixels. In order not to exceed the resources that Google Colab provides us with for free, we limit the number of images that we load into memory to 1000 units. In other words, the algorithm will be trained with 1000 images, including those that it will use for training and those that it will use for subsequent validation.
Once we have the images perfectly classified, formatted and loaded into memory, we carry out a quick visualisation to verify that they are correct. We obtain the following results:

Self-evidently, in the eyes of a non-expert observer, there are no significant differences that allow us to draw any conclusions. In the steps below we will see how the artificial intelligence model actually has a better clinical eye than we do.
Modelling
Creating the training image set
As we mentioned in the previous steps, we have a set of 1000 starting images loaded in the work environment. Until now, we have had classified (by an x-ray specialist) those images of patients with signs of pneumothorax (on the path "./data/Pneumothorax") and those patients who are healthy (on the path "./data/No -Finding")
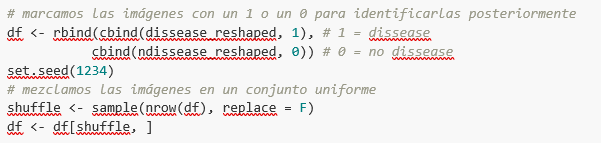
The aim of this exercise is precisely to demonstrate the capacity of an algorithm to assist the specialist in the classification (or detection of signs of disease in the x-ray image). With this in mind, we have to mix the images to achieve a homogeneous set that the algorithm will have to analyse and classify using only their characteristics. The following code snippet associates an identifier (1 for sick people and 0 for healthy people) so that, later, after the algorithm's classification process, it is possible to verify those that the model has classified correctly or incorrectly.
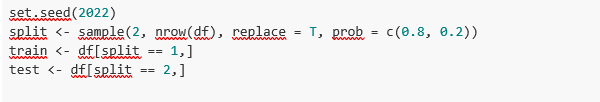
So, now we have a uniform “df” set of 1000 images mixed with healthy and sick patients. Next, we split this original set into two. We are going to use 80% of the original set to train the model. In other words, the algorithm will use the characteristics of the images to create a model that allows us to conclude whether an image matches the identifier 1 or 0. On the other hand, we are going to use the remaining 20% of the homogeneous mixture to check whether the model, once trained, is capable of taking any image and assigning it 1 or 0 (sick, not sick).
Model training
Right, now all we have left to do is to configure the model and train with the previous data set.
Before training, you will see some code snippets which are used to configure the model that we are going to train. The model we are going to train is of the binary classifier type. This means that it is a model that is capable of classifying the data (in our case, images) into two categories (in our case, healthy or sick). The model selected is called CNN or Convolutional Neural Network. Its very name already tells us that it is a neural networks model and thus falls under the Deep Learning discipline. These models are based on layers of data features that get deeper as the complexity of the model increases. We would remind you that the term deep refers precisely to the depth of the number of layers through which these models learn.
Note: the following code snippets are the most technical in the post. Introductory documentation can be found here, whilst all the technical documentation on the model's functions is accessible here.
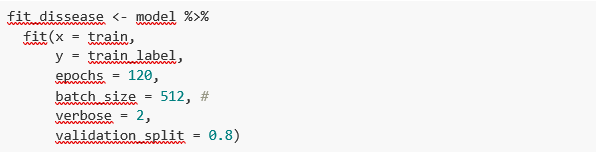
Finally, after configuring the model, we are ready to train the model. As we mentioned, we train with 80% of the images and validate the result with the remaining 20%.
Training result
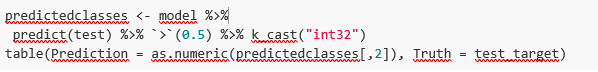
Well, now we have trained our model. So what's next? The graphs below provide us with a quick visualisation of how the model behaves on the images that we have reserved for validation. Basically, these figures actually represent (the one in the lower panel) the capability of the model to predict the presence (identifier 1) or absence (identifier 0) of disease (in our case pneumothorax). The conclusion is that when the model trained with the training images (those for which the result 1 or 0 is known) is applied to 20% of the images for which the result is not known, the model is correct approximately 85% (0.87309) of times.

Indeed, when we request the evaluation of the model to know how well it classifies diseases, the result indicates the capability of our newly trained model to correctly classify 0.87309 of the validation images.
Now let’s make some predictions about patient images. In other words, once the model has been trained and validated, we wonder how it is going to classify the images that we are going to give it now. As we know "the truth" (what is called the ground truth) about the images, we compare the result of the prediction with the truth. To check the results of the prediction (which will vary depending on the number of images used in the training) we use that which in data science is called the confusion matrix. The confusion matrix:
- Places in position (1,1) the cases that DID have disease and the model classifies as "with disease"
- Places in position (2,2), the cases that did NOT have disease and the model classifies as "without disease"
In other words, these are the positions in which the model "hits" its classification.
In the opposite positions, in other words, (1,2) and (2,1) are the positions in which the model is "wrong". So, position (1,2) are the results that the model classifies as WITH disease and the reality is that they were healthy patients. Position (2,1), the very opposite.
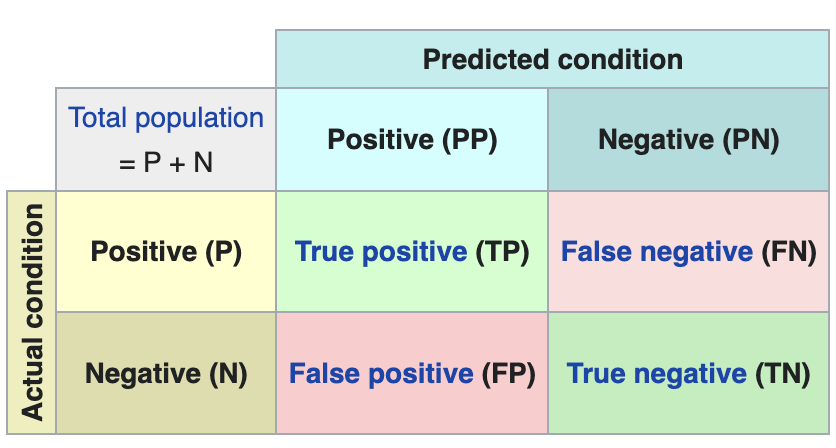
Explanatory example of how the confusion matrix works. Source: Wikipedia https://en.wikipedia.org/wiki/Confusion_matrix
In our exercise, the model gives us the following results:
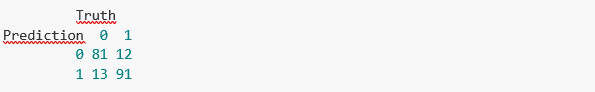
In other words, 81 patients had this disease and the model classifies them correctly. Similarly, 91 patients were healthy and the model also classifies them correctly. However, the model classifies as sick 13 patients who were healthy. Conversely, the model classifies 12 patients who were actually sick as healthy. When we add the hits of the 81+91 model and divide it by the total validation sample, we obtain 87% accuracy of the model.
Conclusions
In this post we have guided you through a didactic exercise consisting of training an artificial intelligence model to carry out chest x-ray imaging classifications with the aim of determining automatically whether someone is sick or healthy. For the sake of simplicity, we have chosen healthy patients and patients with pneumothorax (only two categories) previously diagnosed by a doctor. The journey we have taken gives us an insight into the activities and technologies involved in automated image analysis using artificial intelligence. The result of the training affords us a reasonable classification system for automatic screening with 87% accuracy in its results. Algorithms and advanced image analysis technologies are, and will increasingly be, an indispensable complement in multiple fields and sectors, such as medicine. In the coming years, we will see the consolidation of systems which naturally combine the skills of humans and machines in expensive, complex or dangerous processes. Doctors and other workers will see their capabilities increased and strengthened thanks to artificial intelligence. The joining of forces between machines and humans will allow us to reach levels of precision and efficiency never seen before. We hope that through this exercise we have helped you to understand a little more about how these technologies work. Don't forget to complete your learning with the rest of the materials that accompany this post.
Content prepared by Alejandro Alija, an expert in Digital Transformation.The contents and points of view reflected in this publication are the sole responsibility of its author.
Blog
Health is one of the priority development fields in this century. Most analysts agree that health management - from all possible perspectives - will change radically in the coming years. The analysis of health data will set the way forward in the coming days.
The life expectancy of developed countries increases as the century advances. In the last twenty years, the life expectancy of many developed countries has overcome the barrier of 80 years on average. Japan, Spain, Switzerland, Singapore, among others, are already above 83 years of life expectancy and the trend continues with a constant growth rate.
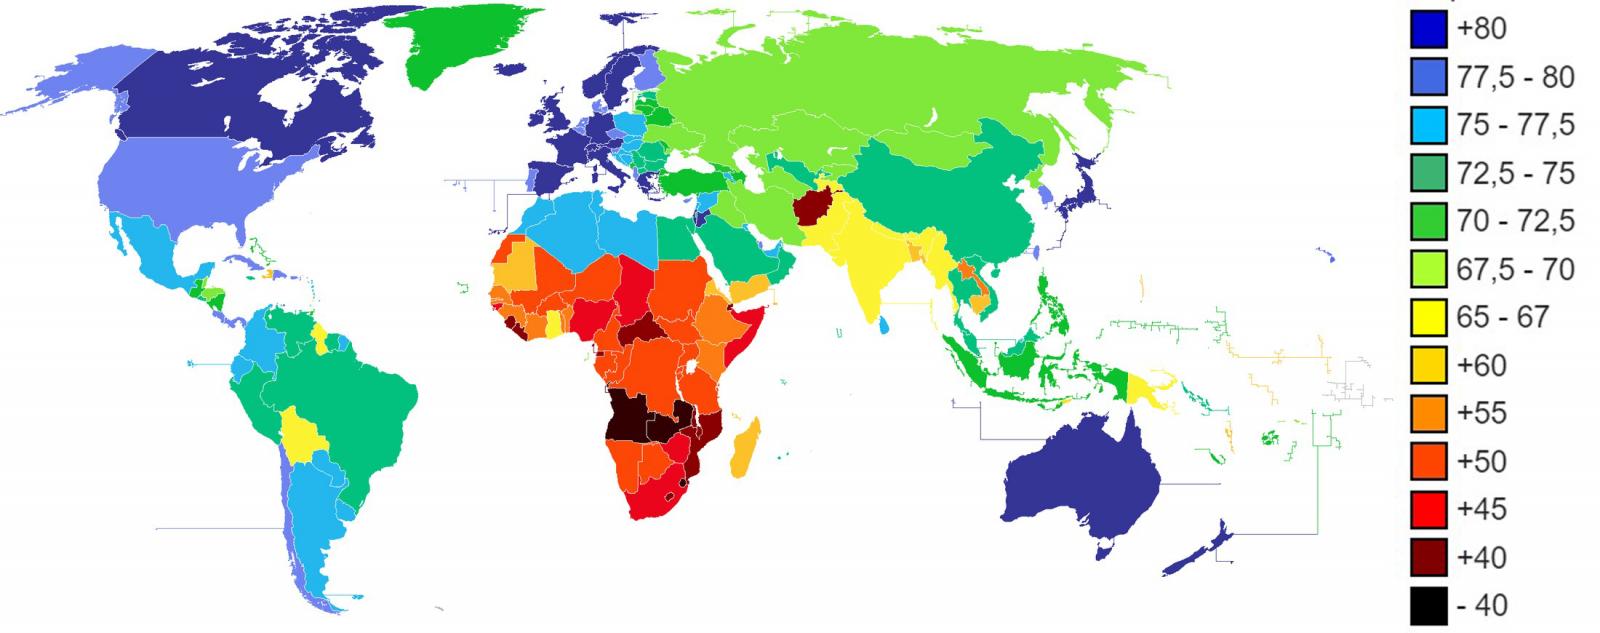
Figure 1. Life expectancy in years according to CIA World Factbook 2013.
Take this introduction on life expectancy to motivate the central theme of this article. As we get older, the diseases that affect us evolve. A longer life expectancy does not necessarily mean a better quality of life in the adult and old age. To live longer, it is necessary to develop better health care. Modern societies need to make a successful transition from treatment to prevention. That is: Prevent rather than cure.
But, to improve prevention, we need to know better the risks and anticipate future complications. The analysis of the data related to our health is vital to face this transition. There are many tasks and necessary actions before going on to establish continuous health data analysis strategies.
By nature, data related to health are sensitive data. Personal health data have a direct impact on our work and personal relationships and can have a very noticeable impact on our economy -on both personal and society level-. Among others, The challenges of health data analysis are:
- Generation of public datasets.
- Standard mechanisms for health data anonymization.
- In real time Health data collection tools.
- Health data models agreed by the scientific community.
- Health data analysis tools prepared for high data volumes.
- Specialist profiles, both health experts and data scientists specialized in this field (semi-structured data and semantic technologies).
Digital transformation of health sector
The digital transformation of health sector represents one of the greatest challenges for public and private health institutions and systems. Many hospital in developed countries have begun to digitize some of the most important data related to our health. Especially, those data recorded in the face-to-face visits to doctors. The Electronic Health Records (EHR) and the diagnostic tests (for example, medical image or clinical analysis) are the registers with a higher digitalization degree. While it is true that the digitization degree of these examples can be high, the way they have been considered is different by countries and systems. Transforming historical and analogical clinical records into digital information adds very little value compared to the effort and investment needed. However, tackling the digitalization of clinical records with the focus on the subsequent intelligent analysis of the data can mean a revolution with an incalculable impact. For example, the implementation of ontologies specially designed for the medical domain such as SNOMED-CT radically changes the future exploitation of medical data and enables a superior intelligence layer supported by the future Artificial Intelligence as an assistant to the doctors and nurses of the future.
Some public repositories
There are different repositories where you can find open data sets related to health. Most available data are statistics related to health indicators. However, there are more specialized repositories where it is possible to find data sets to perform advanced data analysis.
For example, the health systems of the United States and the United Kingdom, respectively, publish their health data in the following repositories:
Other multi-country organizations, such as the World Health Organization (WHO) or UNICEF NGO also have open data repositories:
- UNICEF offers statistics on the situation of women and children worldwide.
- World Health Organization offers world hunger, health, and disease statistics.
Beyond statistical data, Kaggle, a specialized data science website, regularly holds open competitions for teams to solve data-based challenges. For example, in one of the Kaggle competitions, the challenge was to predict hospital readmissions for diabetes. To solve the challenge, they offer a data set (duly anonymized) composed of 65 records of patients with diabetes and 50 fields that include information on: gender, age, weight, etc.
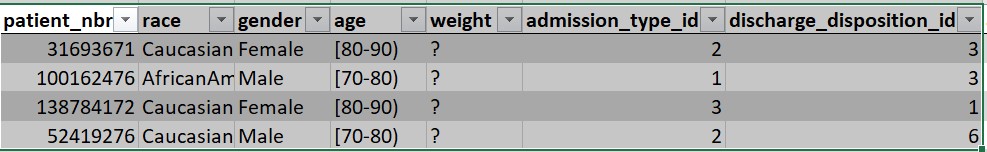
Figure 2. Excerpt from the data set available for the diabetes challenge.
In summary, the systematic analysis of health data opens the doors to predictive medicine. To enable technologies that assist health professionals of the future, it is necessary to build sustainable, scalable and long-lasting data strategies. Collecting, storing, modeling and analyzing health data is the key to a future where healthcare is something more than a mere contact with patients.
Content prepared by Alejandro Alija, expert in Digital Transformation and innovation.
Contents and points of view expressed in this publication are the exclusive responsibility of its author.