Blog
The convergence between open data, artificial intelligence and environmental sustainability poses one of the main challenges for the digital transformation model that is being promoted at European level. This interaction is mainly materialized in three outstanding manifestations:
-
The opening of high-value data directly related to sustainability, which can help the development of artificial intelligence solutions aimed at climate change mitigation and resource efficiency.
-
The promotion of the so-called green algorithms in the reduction of the environmental impact of AI, which must be materialized both in the efficient use of digital infrastructure and in sustainable decision-making.
-
The commitment to environmental data spaces, generating digital ecosystems where data from different sources is shared to facilitate the development of interoperable projects and solutions with a relevant impact from an environmental perspective.
Below, we will delve into each of these points.
High-value data for sustainability
Directive (EU) 2019/1024 on open data and re-use of public sector information introduced for the first time the concept of high-value datasets, defined as those with exceptional potential to generate social, economic and environmental benefits. These sets should be published free of charge, in machine-readable formats, using application programming interfaces (APIs) and, where appropriate, be available for bulk download. A number of priority categories have been identified for this purpose, including environmental and Earth observation data.
This is a particularly relevant category, as it covers both data on climate, ecosystems or environmental quality, as well as those linked to the INSPIRE Directive, which refer to certainly diverse areas such as hydrography, protected sites, energy resources, land use, mineral resources or, among others, those related to areas of natural hazards, including orthoimages.
These data are particularly relevant when it comes to monitoring variables related to climate change, such as land use, biodiversity management taking into account the distribution of species, habitats and protected sites, monitoring of invasive species or the assessment of natural risks. Data on air quality and pollution are crucial for public and environmental health, so access to them allows exhaustive analyses to be carried out, which are undoubtedly relevant for the adoption of public policies aimed at improving them. The management of water resources can also be optimized through hydrography data and environmental monitoring, so that its massive and automated treatment is an inexcusable premise to face the challenge of the digitalization of water cycle management.
Combining it with other quality environmental data facilitates the development of AI solutions geared towards specific climate challenges. Specifically, they allow predictive models to be trained to anticipate extreme phenomena (heat waves, droughts, floods), optimize the management of natural resources or monitor critical environmental indicators in real time. It also makes it possible to promote high-impact economic projects, such as the use of AI algorithms to implement technological solutions in the field of precision agriculture, enabling the intelligent adjustment of irrigation systems, the early detection of pests or the optimization of the use of fertilizers.
Green algorithms and digital responsibility: towards sustainable AI
Training and deploying AI systems, particularly general-purpose models and large language models, involves significant energy consumption. According to estimates by the International Energy Agency, data centers accounted for around 1.5% of global electricity consumption in 2024. This represents a growth of around 12% per year since 2017, more than four times faster than the rate of total electricity consumption. Data center power consumption is expected to double to around 945 TWh by 2030.
Against this backdrop, green algorithms are an alternative that must necessarily be taken into account when it comes to minimising the environmental impact posed by the implementation of digital technology and, specifically, AI. In fact, both the European Data Strategy and the European Green Deal explicitly integrate digital sustainability as a strategic pillar. For its part, Spain has launched a National Green Algorithm Programme, framed in the 2026 Digital Agenda and with a specific measure in the National Artificial Intelligence Strategy.
One of the main objectives of the Programme is to promote the development of algorithms that minimise their environmental impact from conception ( green by design), so the requirement of exhaustive documentation of the datasets used to train AI models – including origin, processing, conditions of use and environmental footprint – is essential to fulfil this aspiration. In this regard, the Commission has published a template to help general-purpose AI providers summarise the data used for the training of their models, so that greater transparency can be demanded, which, for the purposes of the present case, would also facilitate traceability and responsible governance from an environmental perspective. as well as the performance of eco-audits.
The European Green Deal Data Space
It is one of the common European data spaces contemplated in the European Data Strategy that is at a more advanced stage, as demonstrated by the numerous initiatives and dissemination events that have been promoted around it. Traditionally, access to environmental information has been one of the areas with the most favourable regulation, so that with the promotion of high-value data and the firm commitment to the creation of a European area in this area, there has been a very remarkable qualitative advance that reinforces an already consolidated trend in this area.
Specifically, the data spaces model facilitates interoperability between public and private open data, reducing barriers to entry for startups and SMEs in sectors such as smart forest management, precision agriculture or, among many other examples, energy optimization. At the same time, it reinforces the quality of the data available for Public Administrations to carry out their public policies, since their own sources can be contrasted and compared with other data sets. Finally, shared access to data and AI tools can foster collaborative innovation initiatives and projects, accelerating the development of interoperable and scalable solutions.
However, the legal ecosystem of data spaces entails a complexity inherent in its own institutional configuration, since it brings together several subjects and, therefore, various interests and applicable legal regimes:
-
On the one hand, public entities, which have a particularly reinforced leadership role in this area.
-
On the other hand, private entities and citizens, who can not only contribute their own datasets, but also offer digital developments and tools that value data through innovative services.
-
And, finally, the providers of the infrastructure necessary for interaction within the space.
Consequently, advanced governance models are essential to deal with this complexity, reinforced by technological innovation and especially AI, since the traditional approaches of legislation regulating access to environmental information are certainly limited for this purpose.
Towards strategic convergence
The convergence of high-value open data, responsible green algorithms and environmental data spaces is shaping a new digital paradigm that is essential to address climate and ecological challenges in Europe that requires a robust and, at the same time, flexible legal approach. This unique ecosystem not only allows innovation and efficiency to be promoted in key sectors such as precision agriculture or energy management, but also reinforces the transparency and quality of the environmental information available for the formulation of more effective public policies.
Beyond the current regulatory framework, it is essential to design governance models that help to interpret and apply diverse legal regimes in a coherent manner, that protect data sovereignty and, ultimately, guarantee transparency and responsibility in the access and reuse of environmental information. From the perspective of sustainable public procurement, it is essential to promote procurement processes by public entities that prioritise technological solutions and interoperable services based on open data and green algorithms, encouraging the choice of suppliers committed to environmental responsibility and transparency in the carbon footprints of their digital products and services.
Only on the basis of this approach can we aspire to make digital innovation technologically advanced and environmentally sustainable, thus aligning the objectives of the Green Deal, the European Data Strategy and the European approach to AI.
Content prepared by Julián Valero, professor at the University of Murcia and coordinator of the Innovation, Law and Technology Research Group (iDerTec). The content and views expressed in this publication are the sole responsibility of the author.
Blog
Artificial intelligence (AI) has become a key technology in multiple sectors, from health and education to industry and environmental management, not to mention the number of citizens who create texts, images or videos with this technology for their own personal enjoyment. It is estimated that in Spain more than half of the adult population has ever used an AI tool.
However, this boom poses challenges in terms of sustainability, both in terms of water and energy consumption and in terms of social and ethical impact. It is therefore necessary to seek solutions that help mitigate the negative effects, promoting efficient, responsible and accessible models for all. In this article we will address this challenge, as well as possible efforts to address it.
What is the environmental impact of AI?
In a landscape where artificial intelligence is all the rage, more and more users are wondering what price we should pay for being able to create memes in a matter of seconds.
To properly calculate the total impact of artificial intelligence, it is necessary to consider the cycles of hardware and software as a whole, as the United Nations Environment Programme (UNEP)indicates. That is, it is necessary to consider everything from raw material extraction, production, transport and construction of the data centre, management, maintenance and disposal of e-waste, to data collection and preparation, modelling, training, validation, implementation, inference, maintenance and decommissioning. This generates direct, indirect and higher-order effects:
- The direct impacts include the consumption of energy, water and mineral resources, as well as the production of emissions and e-waste, which generates a considerable carbon footprint.
- The indirect effects derive from the use of AI, for example, those generated by the increased use of autonomous vehicles.
- Moreover, the widespread use of artificial intelligence also carries an ethical dimension, as it may exacerbate existing inequalities, especially affecting minorities and low-income people. Sometimes the training data used are biased or of poor quality (e.g. under-representing certain population groups). This situation can lead to responses and decisions that favour majority groups.
Some of the figures compiled in the UN document that can help us to get an idea of the impact generated by AI include:
- A single request for information to ChatGPT consumes ten times more electricity than a query on a search engine such as Google, according to data from the International Energy Agency (IEA).
- Entering a single Large Language Model ( Large Language Models or LLM) generates approximately 300.000 kg of carbon dioxide emissions, which is equivalent to 125 round-trip flights between New York and Beijing, according to the scientific paper "The carbon impact of artificial intelligence".
- Global demand for AI water will be between 4.2 and 6.6 billion cubic metres by 2,027, a figure that exceeds the total consumption of a country like Denmark, according to the "Making AI Less "Thirsty": Uncovering and Addressing the Secret Water Footprint of AI Models" study.
Solutions for sustainable AI
In view of this situation, the UN itself proposes several aspects to which attention needs to be paid, for example:
- Search for standardised methods and parameters to measure the environmental impact of AI, focusing on direct effects, which are easier to measure thanks to energy, water and resource consumption data. Knowing this information will make it easier to take action that will bring substantial benefit.
- Facilitate the awareness of society, through mechanisms that oblige companies to make this information public in a transparent and accessible manner. This could eventually promote behavioural changes towards a more sustainable use of AI.
- Prioritise research on optimising algorithms, for energy efficiency. For example, the energy required can be minimised by reducing computational complexity and data usage. Decentralised computing can also be boosted, as distributing processes over less demanding networks avoids overloading large servers.
- Encourage the use of renewable energies in data centres, such as solar and wind power. In addition, companies need to be encouraged to undertake carbon offsetting practices.
In addition to its environmental impact, and as seen above, AI must also be sustainable from a social and ethical perspective. This requires:
- Avoid algorithmic bias: ensure that the data used represent the diversity of the population, avoiding unintended discrimination.
- Transparency in models: make algorithms understandable and accessible, promoting trust and human oversight.
- Accessibility and equity: develop AI systems that are inclusive and benefit underprivileged communities.
While artificial intelligence poses challenges in terms of sustainability, it can also be a key partner in building a greener planet. Its ability to analyse large volumes of data allows optimising energy use, improving the management of natural resources and developing more efficient strategies in sectors such as agriculture, mobility and industry. From predicting climate change to designing models to reduce emissions, AI offers innovative solutions that can accelerate the transition to a more sustainable future.
National Green Algorithms Programme
In response to this reality, Spain has launched the National Programme for Green Algorithms (PNAV). This is an initiative that seeks to integrate sustainability in the design and application of AI, promoting more efficient and environmentally responsible models, while promoting its use to respond to different environmental challenges.
The main goal of the NAPAV is to encourage the development of algorithms that minimise environmental impact from their conception. This approach, known as "Green by Design", implies that sustainability is not an afterthought, but a fundamental criterion in the creation of AI models. In addition, the programme seeks to promote research in sustainable IA, improve the energy efficiency of digital infrastructures and promote the integration of technologies such as the green blockchain into the productive fabric.
This initiative is part of the Recovery, Transformation and Resilience Plan, the Spain Digital Agenda 2026 and the National Artificial Intelligence Strategy.. Objectives include the development of a best practice guide, a catalogue of efficient algorithms and a catalogue of algorithms to address environmental problems, the generation of an impact calculator for self-assessment, as well as measures to support awareness-raising and training of AI developers.
Its website functions as a knowledge space on sustainable artificial intelligence, where you can keep up to date with the main news, events, interviews, etc. related to this field. They also organise competitions, such as hackathons, to promote solutions that help solve environmental challenges.
The Future of Sustainable AI
The path towards more responsible artificial intelligence depends on the joint efforts of governments, business and the scientific community. Investment in research, the development of appropriate regulations and awareness of ethical AI will be key to ensuring that this technology drives progress without compromising the planet or society.
Sustainable AI is not only a technological challenge, but an opportunity to transform innovation into a driver of global welfare. It is up to all of us to progress as a society without destroying the planet.
Blog
Geospatial data has driven improvements in a number of sectors, and energy is no exception. This data allows us to better understand our environment in order to promote sustainability, innovation and informed decision-making.
One of the main providers of open geospatial data is Copernicus, the European Union's Earth observation programme. Through a network of satellites called Sentinel and data from ground, sea and airborne sources, Copernicus provides geospatial information freely accessible through various platforms.
Although Copernicus data is useful in many areas, such as fighting climate change, urban planning or agriculture, in this article we will focus on its role in driving sustainability and energy efficiency. The availability of high quality open data fosters innovation in this sector by promoting the development of new tools and applications that improve energy management and use. Here are some examples.
Climate prediction to improve production
Geospatial data provide detailed information on weather conditions, air quality and other factors, which are essential for understanding and predicting environmental phenomena, such as storms or droughts, that affect energy production and distribution.
One example is this project which provides high-resolution wind forecasts to serve the oil and gas, aviation, shipping and defence sectors. It uses data from satellite observations and numerical models, including information on ocean currents, waves and sea surface temperature from the "Copernicus Marine Service". Thanks to its granularity, it can provide an accurate weather forecasting system at a very local scale, allowing a higher level of accuracy in the behaviour of extreme weather and climate phenomena.
Optimisation of resources
The data provided by Copernicus also allows the identification of the best locations for the installation of energy generation centres, such as solar and wind farms, by facilitating the analysis of factors such as solar radiation and wind speed. In addition, they help monitor the efficiency of these facilities, ensuring that they are operating at maximum capacity.
In this regard, a project has been developed to find the best site for a combined floating wind and wave energy system (i.e. based on wave motion). By obtaining both energies with a single platform, this solution saves space and reduces the impact on the ground, while improving efficiency. Wind and waves arrive at different times at the platform, so capturing both elements helps reduce variability and smoothes overall electricity production. Thanks to the Copernicus data (obtained from the Atlantic Service - Biscay Iberia Ireland - Ocean Wave Reanalysis), the provider of this situation was able to obtain separate components of wind and wave waves, which allowed a more complete understanding of the directionality of both elements. This work led to the selection of Biscay Marine Energy Platform (BiMEP). for the deployment of the device.
Another example is Mon Toit Solaire, an integrated web-based decision support system for the development of rooftop photovoltaic power generation. This tool simulates and calculates the energy potential of a PV project and provides users with reliable technical and financial information. It uses solar radiation data produced by the "Copernicus Atmospheric Monitoring Service", together with three-dimensional urban topographic data and simulations of tax incentives, energy costs and prices, allowing the return on investment to be calculated.
Environmental monitoring and impact assessment.
Geospatial information allows for improved environmental monitoring and accurate impact assessments in the energy sector. This data allows energy companies to identify environmental risks associated with their operations, design strategies to mitigate their impact and optimise their processes towards greater sustainability. In addition, they support environmental compliance by providing objective data-driven reporting, encouraging more responsible and environmentally friendly energy development.
Among the challenges posed by the conservation of ocean biodiversity, man-made underwater noise is recognised as a serious threat and is regulated at European level. In order to assess the impact on marine life of wind farms along the southern coast of France, this project uses high-resolution statistical sound maps, which provide a detailed view of coastal processes, with an hourly time frequency and a high spatial resolution of up to 1.8 km. In particular, they use information from the "Mediterranean Sea Physics Analysis and Forecasting" and "World Ocean Hourly Sea Surface Wind and Stress" services.
Emergency and environmental disaster management.
In disaster situations or extreme weather events, geospatial data can help quickly assess damage and coordinate emergency responses more efficiently.
They can also predict how spills will behave. This is the aim of the Marine Research Institute of the University of Klaipeda, which has developed a system for monitoring and forecasting chemical and microbiological pollution episodes using a high-resolution 3D operational hydrodynamic model. They use the Copernicus "Physical Analysis and Forecasts of the Baltic Sea". The model provides real-time, five-day forecasts of water currents, addressing the challenges posed by shallow waters and port areas. It aims to help manage pollution incidents, particularly in pollution-prone regions such as ports and oil terminals.
These examples highlight the usefulness of geospatial data, especially those provided by programmes such as Copernicus. The fact that companies and institutions can freely access this data is revolutionising the energy sector, contributing to a more efficient, sustainable and resilient system.
Application
Tupreciodeluz.com offers daily information on the price of electricity, showing the cheapest price of the day, as well as the average price of the last 24 hours and the most expensive time slot. The aim is to allow consumers adhering to the regulated market tariff (PVPC) to modulate their consumption in order to save on their electricity bill.
The website also features an artificial intelligence assistant for energy advice, and measures to promote efficiency and responsible energy consumption.
In addition, consumers can use a solar sizer to find out the feasibility of installing solar energy in their home or business.
The website also has a blog where the most relevant news for consumers is published in a summarised and entertaining way.
Blog
The promotion of energy efficiency and sustainability is one of the priorities of the European Union and Spain, as reflected in the European Green Pact. The availability of open data related to energy production, distribution and consumption allows governments, businesses and citizens to access essential information to address the challenges of climate change and promote a more sustainable future.
In this post, we explore examples of use cases that show the impact of open data on the energy landscape, as well as sources of interest where to find quality data on the subject.
Open data use cases in the energy sector
EUR 79,600 million. This is the estimated annual savings from open data in the energy sector in the European Union, according to the report "The Economic Impact of Open Data: Opportunities for Value Creation in Europe (2020)". This is possible thanks to multiple projects and applications based on open data that affect various areas.
-
More efficient resource planning
Access to open data on available energy resources makes it possible to identify the most suitable areas to develop projects, ensuring that the use of available natural resources is maximised. For example, in the Baltic Sea, natural gas infrastructure is being expanded to meet the region's growing needs. By taking advantage of Copernicus' advanced data together with its own monitoring and forecasting services (including data on wind, waves, sea water level, currents, sea ice, etc.), the Estonian and Finnish governments were able to carry out more efficient planning for the installation of a new plant.
Likewise, the National Geographic Institute has made available to users a viewer to find out the incidence of the sun and determine the best location for solar panels. Thanks to this viewer, different locations and orientations can be analysed to identify the position that maximises solar energy collection.
-
More responsible and efficient consumption
Open data also includes information on the use and performance of different energies. The Junta de Castilla y León, for example, has a dataHub that collects information from more than 1,500 consumer centres. This dashboard allows the analysis by type of energy (electricity, gas, diesel) and by geographical location (educational centres, health centres, administrative offices, hospitals, etc.). This allows them to compare consumption between the buildings they manage and make efficiency decisions, which has resulted in savings of €2M per year since 2015 on the fixed cost of electricity alone.
The Urban3r viewer allows the visualisation of different indicators on the current state of the building, the energy demand data of residential buildings in their current state and after energy refurbishment, as well as the estimated costs of these interventions, facilitating decision making.
Commercial solutions are also available on the market for this purpose, such as Opower, a tool that uses artificial intelligence to provide personalised information to each customer, identifying and suggesting the replacement of inefficient heating and cooling systems. Another example is uplight, which performs energy efficiency analyses for commercial buildings, utilities and government entities with operational and retrofit recommendations to reduce consumption. These examples highlight the business opportunity in this niche market.
-
Possibility to choose cheaper suppliers
Open data provides detailed information on tariffs and prices of different energy suppliers. This transparency allows consumers to easily compare offers and choose the option that best suits their needs. This is the case of applications for choosing petrol stations, such as Mejorgasolinera.com or Precioil.es, which offer detailed information on the country's petrol stations and allow filtering by brand, location or road and sorted by price and distance. We also find similar solutions for the electricity market, such as Tarifaluzhora.
The National Commission for Markets and Competition (CNMC in Spanish) also has a Energy Offers Comparator (CNMC), which allows you to consult gas and electricity offers.
-
Transparency, accountability and harm minimisation
The publication of open data not only allows citizens and organisations to access detailed information on energy production, distribution and consumption. It also increases transparency in resource management and promotes accountability of energy companies and governments.
To this end, OpenOil was born, which aims to reduce the opacity of the oil industry and thereby increase the accountability of oil companies. It provides an open data framework for natural resource management at the supranational level, as well as consultancy and training services for the creation of natural resource management mechanisms and processes.
In order to minimise the impact of oil spills in the oceans, the Spanish National Research Council (CSIC), in collaboration with Digital Earth Solutions (DES), has developed a unique software, capable of predicting in a few minutes and with great precision the geographic evolution of any oil slick, forecasting its future trajectory in the ocean or studying its movement backwards in time to find its origin.
Where can I find energy data?
If you are thinking of developing such a solution, you are in luck, because there is a wealth of open energy data available on the web.
If you are looking for data from Spain, in addition to datos.gob.es, you can visit the following websites:
- Institute for Energy Diversification and Saving (IDAE). IDAE provides sectorised statistics and energy balances for both primary and final energy, in thousands of tonnes of oil equivalent (ktoe). In total, 69 energy types and 128 energy flows and/or sectors are detailed. The data currently available cover the historical series from 1990 to 2022.
- Red Eléctrica de España. REData is the website of Red eléctrica where we can find national statistical series related to the Spanish electricity system, updated month by month. In this space you can also access information on demand, generation, balancing, exchange, transmission and electricity markets, whose data are available through a REST API. Depending on the nature of the dataset, we can find data that are updated annually, quarterly or even daily. Another useful tool of Red Eléctrica is ESIOS, with updated data on generation, consumption, market, prices, etc.
- National Commission for Markets and Competition (CNMC): The CNMC Data open data portal provides direct access to data and indicators relating to the energy markets overseen by the CNMC: electricity, natural gas and oil products. We can find statistics on market prices, the number of users benefiting from the social bonus or the percentage of renewable energy in the total amount, among other values. Data are updated regularly, on a monthly, quarterly or annual basis.
A wealth of information is also available worldwide:
- European Union. On the EU's energy policy website, we find various data and analyses ranging from oil price developments in individual member states to possible energy market scenarios for 2030 and 2050, among many others. In addition, the European Commission's Directorate-General for Energy produces energy statistical fact sheets every two years, based on data from Eurostat and EU greenhouse gas monitoring. The data is broken down by country, which allows for easy comparisons. Also available is the ENSPRESO database, which focuses on the wind, solar and biomass sectors.
- International Energy Agency (IEA). IEA is an international organisation created in 1974 by the Organisation for Economic Co-operation and Development (OECD) to secure energy supplies. Although some of the datasets offered are paid for, open data can also be found on the website and can be downloaded upon registration.
- Other countries: At the international level, we can find detailed portals by country, such as the US Open Energy Data Initiative (OEDI) or the UK.
These are just a few examples of solutions and data sources that highlight the impact that opening up energy data can have on our environment, both in terms of cost savings and efficiency gains. We invite you to share other open data solutions and portals in comments.
Blog
The carbon footprint is a key indicator for understanding the environmental impact of our actions. It measures the amount of greenhouse gas emissions released into the atmosphere as a result of human activities, most notably the burning of fossil fuels such as oil, natural gas and coal. These gases, which include carbon dioxide (CO2), methane (CH4) and nitrous oxide (N2O), contribute to global warming by trapping heat in the earth's atmosphere.
Many actions are being carried out by different organisations to try to reduce the carbon footprint. These include those included in the European Green Pact or the Sustainable Development Goals. But this is an area where every small action counts and, as citizens, we can also contribute to this goal through small changes in our lifestyles.
Moreover, this is an area where open data can have a major impact. In particular, the report "The economic impact of open data: opportunities for value creation in Europe (2020)" highlights how open data has saved the equivalent of 5.8 million tonnes of oil every year in the European Union by promoting greener energy sources. This include 79.6 billion in cost savings on energy bills.
This article reviews some solutions that help us measure our carbon footprint to raise awareness of the situation, as well as useful open data sources .
Calculators to know your carbon footprint
The European Union has a web application where everyone can analyse the life cycle of products and energy consumed in five specific areas (food, mobility, housing, household appliances and household goods), based on 16 environmental impact indicators. The user enters certain data, such as his energy expenditure or the details of his vehicle, and the solution calculates the level of impact. The website also offers recommendations for improving consumption patterns. It was compiled using data from Ecoinvent y Agrifoot-print, as well as different public reports detailed in its methodology.
The UN also launched a similar solution, but with a focus on consumer goods. It allows the creation of product value chains by mapping the materials, processes and transports that have been used for their manufacture and distribution, using a combination of company-specific activity data and secondary data. The emission factors and datasets for materials and processes come from a combination of data sources such as Ecoinvent, the Swedish Environment Institute, DEFRA (UK Department for Environment, Food and Rural Affairs), academic papers, etc. The calculator is also linked to the the Platform for carbon footprint offsetting of the United Nations. This allows users of the application to take immediate climate action by contributing to UN green projects.
Looking at Spain, the Ministry for Ecological Transition and the Demographic Challenge has several tools to facilitate the calculation of the carbon footprint aimed at different audiences: organisations, municipalities and farms. They take into account both direct emissions and indirect emissions from electricity consumption. Among other data sources, it uses information from National Greenhouse Gas Inventory. It also provides an estimate of the carbon dioxide removals generated by an emission reduction project.
Another tool linked to this ministry is ComidaAPrueba, launched by the Fundación Vida Sostenible and aimed at finding out the sustainability of citizens' diets. The mobile application, available for both iOs and Android, allows us to calculate the environmental footprint of our meals to make us aware of the impact of our actions. It also proposes healthy recipes that help us to reduce food waste.
But not all actions of this kind are driven by public bodies or non-profit associations. The fight against the deterioration of our environment is also a niche market offering business opportunities. Private companies also offer solutions for calculating the carbon footprint, such as climate Hero, which is based on multiple data sources.
Data sources to feed carbon footprint calculators
As we have seen, in order to make these calculations, these solutions need to be based on data that allow them to calculate the relationship between certain consumption habits and the emissions generated. To do this, they draw on a variety of data sources, many of which are open. In Spain, for example, we find:
- National Statistics Institute (INE). The INE provides data on atmospheric emissions by branch of activity, as well as for households. It can be filtered by gas type and its equivalence in thousands of tonnes of CO2. It also provides data on the historical evolution of the achievement of carbon footprint reduction targets, which are based on the National Inventories of Emissions to the Atmosphere, prepared by the Ministry for Ecological Transition and the Demographic Challenge.
- Autonomous Communities. Several regional governments carry out inventories of pollutant emissions into the atmosphere. This is the case of the Basque Country and the Community of Madrid. Some regions also publish open forecast data, such as the Canary Islands, which provides projections of climate change in tourism or drought situations.
Other international data services to consider are:
- EarthData. This service provides full and open access to NASA' s collection of Earth science data to understand and protect our planet. This web provides links to commonly used data on greenhouse gases, including carbon dioxide, methane, nitrous oxide, ozone, chlorofluorocarbons and water vapour, as well as information on their environmental impact.
- Eurostat. The Statistical Office of the European Commission regularly publishes estimates of quarterly greenhouse gas emissions in the European Union, broken down by economic activity. The estimates cover all quarters from 2010 to the present.
- Life Cycle Assessment (LCA). This platform is the EU's knowledge base on sustainable production and consumption. It provides a product life cycle inventory for supply chain analysis. Data from business associations and other sources related to energy carriers, transport and waste management are used.
- Our World in Data. One of the most widely used datasets of this portal contains information on CO2 and greenhouse gas emissions through key metrics. Various primary data sources such as the US Energy Information Agency and The Global Carbon Project have been used for its elaboration. All raw data and scripts are available in their GitHub repository.
These repositories are just a sample, but there are many more sources whit valuable data to help us become more aware of the climate situation we live in and the impact our small day-to-day actions have on our planet. Reducing our carbon footprint is crucial to preserving our environment and ensuring a sustainable future. And only together will we be able to achieve our goals.
Documentación
The Sustainable Development Goals (SDGs) are a set of targets adopted by the international community aimed at addressing the most pressing challenges of our time. These goals were born simultaneously with the Global Partnership for Sustainable Development Data and the International Open Data Charter, which provided a coalition of experts willing to harness the benefits of open data for the new development agenda.
In this regard, open data plays a very relevant role within the development agenda as indicators of progress towards the SDGs, as they allow measuring and evaluating their progress, as well as improving accountability through sharing that data with the rest of the community, providing great value in multiple ways:
- Facilitating decision-making when designing policies and strategies to help meet the objectives;
- Identifying inequalities and specific challenges among different regions or population groups;
- Improving efficiency in policy and program implementation;
- As an engine of innovation through research and development.
Today, there are large global databases, both generalist and thematic, that we can use for these purposes, in addition to all the national data sources available in our own country. However, there is still a long way to go in this regard: the proportion of SDG indicators that are conceptually clear and have good national coverage is still 66%, according to the latest SDG progress report published in 2023. This leads us to continue facing data gaps in vital areas such as poverty, hunger, education, equality, sustainability, climate, seas, and justice, among others. Additionally, there is also a fairly general and significant lack of data disaggregated by age and/or sex, making it very difficult to properly monitor the potential progress of the objectives regarding the most vulnerable population groups.
This report takes a journey through the dual role that open data plays in supporting national and global progress in achieving the SDGs. The first part of the report focuses on the better-known role of open data as mere indicators when measuring progress towards the objectives, while the second part addresses its role as a key tool and fundamental raw material for the development of society in general and for the achievement of the objectives themselves in particular. To this end, it explores which datasets could have the greatest potential in each case, showing some practical examples, both national and at the European level, in various specific development objectives.
If you want to learn more about the content of this report, you can watch the interview with its author.
Blog
Open data is a valuable tool for making informed decisions that encourage the success of a process and enhance its effectiveness. From a sectorial perspective, open data provides relevant information about the legal, educational, or health sectors. All of these, along with many other areas, utilize open sources to measure improvement compliance or develop tools that streamline work for professionals.
The benefits of using open data are extensive, and their variety goes hand in hand with technological innovation: every day, more opportunities arise to employ open data in the development of innovative solutions. An example of this can be seen in urban development aligned with the sustainability values advocated by the United Nations (UN).
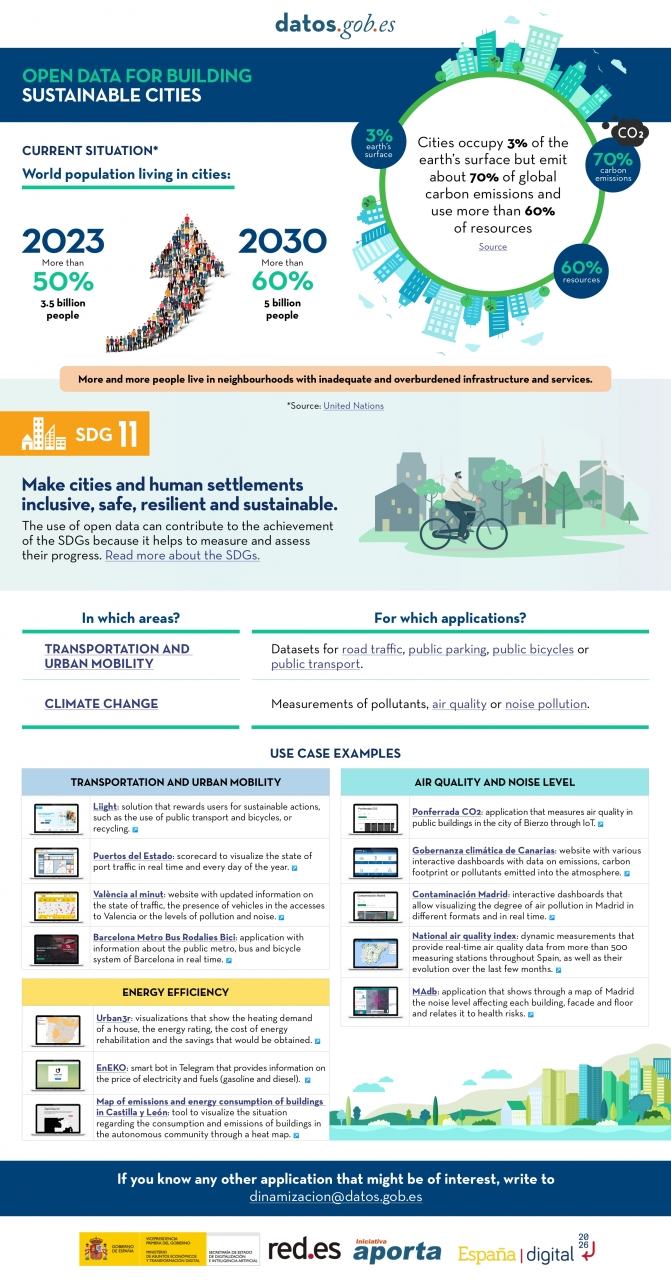
Cities cover only 3% of the Earth's surface; however, they emit 70% of carbon emissions and consume over 60% of the world's resources, according to the UN. In 2023, more than half of the global population lives in cities, and this figure is projected to keep growing. By 2030, it is estimated that over 5 billion people would live in cities, meaning more than 60% of the world's population.
Despite this trend, infrastructures and neighborhoods do not meet the appropriate conditions for sustainable development, and the goal is to "Make cities and human settlements inclusive, safe, resilient, and sustainable," as recognized in Sustainable Development Goal (SDG) number 11. Proper planning and management of urban resources are significant factors in creating and maintaining sustainability-based communities. In this context, open data plays a crucial role in measuring compliance with this SDG and thus achieving the goal of sustainable cities.
In conclusion, open data stands as a fundamental tool for the strengthening and progress of sustainable city development.
In this infographic, we have gathered use cases that utilize sets of open data to monitor and/or enhance energy efficiency, transportation and urban mobility, air quality, and noise levels. Issues that contribute to the proper functioning of urban centers.
Click on the infographic to view it in full size.
Blog
Open mobility data plays a key role in transforming current transport networks and systems, promoting their digitization and improving their sustainability and efficiency. The European Union is aware of this situation, and for this reason it has not only included mobility data among the categories considered of high value in the directive (EU) 2019/1024, but also highlighted its importance in the new "Sustainable and smart mobility strategy", including lines of action related to its impulse, how we approach previously.
In this new article we are going to focus on the situation in Spain, where measures related to open data have also been included in the national mobility strategy.
The Secure, Sustainable, Connected Mobility Strategy 2030
The Secure, Sustainable, Connected Mobility Strategy 2030 (es.movilidad) published by the Ministry of Transport, Mobility and Urban Agenda (MITMA) in September 2020 recognizes the importance of open data in the process of digitization and automation of transport, as well as the regulatory challenges posed by collection conditions, transfer and access to the data generated in the different parts of the value chain. For this reason, the strategy proposes that a future Law on Sustainable Mobility and Transport Financing addresses these issues, offering solutions that eliminate barriers to the opening of data andwhat guarantee the privacy of users and the protection of different business strategies.
Although they are present in other measures, in axis 5 (Intelligent Mobility) of the Strategy there are four measures, three of them within the line of action for the Facilitation of Mobility as a Service, Open Data and New Technologies for Analysis and Optimization of Mobility, in which open data explicitly plays a prominent role:
- To the extent designed to promote the publication of open mobility data from MITMA in coordination with the data.gob.es platform aims to adopt a proactive role in making open data available (both planned and in real operation) that are relevant to society.
- The implementation of the National Data Access Point for multimodal travel aims to create a single repository of open transport data (schedules, fares, routes, geographical coordinates of stops, etc.) provided by transport authorities, operators, providers of shared mobility services or transport services on demand, infrastructure managers, etc. anyway at the national level. In this sense, it should be noted that MITMA intends to go beyond the mandatory minimum and create three other national access points (real-time traffic, safety information in relation to traffic and safe parking for freight transport).
- To promote the development of mobility applications, guaranteeing the availability of quality and real-time data, MITMA will analyze the convenience of promoting complementary regulation so that all transport operators, infrastructure managers, and transport service providers on demand. provide dynamic, reliable and real-time data of their transport services to be made available to third parties.
- Finally the design and implementation of the SIMPLE technology platform, also foresees the reuse of information throughout the logistics and transport chain, based on the principle of providing unique data only once. This platform will allow to know the traceability of goods in the different means of transport and, on the other hand, will allow the interconnection between the Public Administration and the different agents of the private logistics sector to facilitate trade and transport, nationally and internationally.
These measures are summarized in the following image:

On the other hand, a request for expressions of interest to identify proposals for the integration of artificial intelligence in the value chains of the economy in order to promote the digital transformation of the economic fabric, within the framework of Recovery Plan. And one of the five axes on which one's own National Artificial Intelligence Strategy (ENIA) recognizes the impact of AI and data is of course, sustainable and smart mobility. It should be noted that it is an invitation aimed at projects in the phases closest to the market of the innovation process based on medium to high maturity technologies (TRL 6 onwards) as a complement to R&D support actions.
Now that the pandemic period is coming to an end, the economic recovery effort opens up fascinating opportunities for innovation and digital transformation in sectors where the penetration of artificial intelligence and the use of data so far has been much lower than the sector of the information technologies, something that not only happens in mobility and transport but also in the farming, energy or health and education.
We are therefore faced with a unique opportunity that we cannot afford to miss; which is also accompanied by a significant boost in the form of public financing and in which transport and mobility stand out due to their impact not only on the economy, but also on the environment and on the quality of life of citizens.
Content written by Jose Luis Marín, Senior Consultant in Data, Strategy, Innovation & Digitalization.
The contents and points of view reflected in this publication are the sole responsibility of its author.
Blog
More than two years ago we started 2019 very hopeful about the progress that was being made in Spain regarding the openness of data related to transport and mobility, after a few years in which there had not been much progress. Although there is still room for improvement, especially in the availability of open data in real time, the fact that applications in the transport category already represent 20% of the total published on the datos.gob.es portal serves as an indicator of progress in this period.
In these two years, the pace of innovation in everything related to the use of data and artificial intelligence has been accelerated not only by technological progress, but also by a significant legislative impulse, both at European and national level. For example, the new Directive (EU) 2019/1024 considers data related to mobility and transport to be among the six groups declared to be of high value for their considerable benefits to society, the environment and the economy. Therefore, their momentum has been considered in the new mobility strategy.
European framework for mobility data
The European data strategy published in 2020 has among its objectives to create a single data market that ensures Europe's global competitiveness and data sovereignty through the creation of common European data spaces in nine strategic sectors, capable of ensuring that more data are available for use in the economy and society. Actions leading to the development of these data spaces are being channelled through the different strategies that the European Commission is developing to deliver on the priorities set for the period 2019-2024. Some examples already under development are the common manufacturing data space or the common agricultural data space.
As regards transport, in December 2020 the European Commission presented its "Sustainable and Smart Mobility Strategy" accompanied by an action plan of 82 initiatives for the next 4 years that will contribute to achieving the objectives of the European Green Pact. This strategy lays the groundwork for how the EU transport system must achieve its green and digital transformation to become more resilient to future crises.
Although the role of data is present in most of the points, among the ten key actions there is one that focuses exclusively on the role of data. In Action 7: "Innovation, data and artificial intelligence for smarter mobility", in addition to the objectives related to fostering innovation in general and building adequate digital infrastructures, the following points related to data and artificial intelligence stand out:

- The Commission stresses the need to step up efforts related to data availability, access and exchange in order to make the digital transformation of the transport and mobility sector a reality.
- It recognises that the availability of data and statistics is also essential, especially real-time data, as it enables better services to citizens or transparency of supply chains in freight transport.
- The need to remove barriers such as unclear regulatory conditions, the absence of an EU market for data provision, the lack of an obligation to collect and share data or misgivings about data sovereignty, among others, is highlighted.
- The commitment to propose further actions to build a common European data space for mobility data, set out in the Data Strategy, is developed. This sets the objective of collecting, connecting and making data available to achieve the objectives of sustainability and multimodality.
- Of particular relevance is the commitment that the mobility data space should work in synergy with other key systems such as energy, satellite navigation and telecommunications.
- It deals in a very differentiated way with access to vehicle data where the Commission is committed to present a new initiative on access to vehicle data, through which it will propose a balanced framework to ensure fair and efficient access to vehicle data for mobility service providers.
- The Commission plans to fund research, innovation and deployment of transport solutions based on artificial intelligence through the Horizon Europe and Digital Europe programmes, recognising that artificial intelligence is central to the automation of transport in all its modes. In this context, the Commission will support test and experimentation centres dedicated to AI for smart mobility.
This is certainly a very ambitious set of commitments that must also be compatible with EU data protection rules and ensure a level playing field for data in the value chain, so that innovation can flourish and new business models emerge. Otherwise operators would perceive that the common mobility data space is not secure and reliable for sharing their data and it would be very difficult to meet the ambitious targets that already by 2030 aim for automated mobility to be deployed on a large scale and for multimodal passenger transport to be a reality supported by integrated e-ticketing.
Contenido elaborado por Jose Luis Marín, Senior Consultant in Data, Strategy, Innovation & Digitalization.
The contents and views expressed in this publication are the sole responsibility of the author.