
Description
Music is a sensory expression of mathematics. Mathematics and technology are our main tools for data analysis so: music for my data.
(The image on the right belongs to a score by John Andrew Buchanan (lyrics) and Henry Bernard Murtagh, (music) - Oregon Blue Book, Public Domain, https://commons.wikimedia.org/w/index.php?curid = 8893618)
We could say that the theme of music and data is not the most popular today. At the present time, where it seems that everything that sounds like data is important and interesting, it is not common to touch the issue of the relationship between music and data. However, this can be a very interesting matter to explore from many points of view. Thus, when we perform a simple search on the Internet about the relationship between music and data, we find some interesting categories. In this post we will highlight two of those categories:
- Musical classifications.
- Sonification of the data.
Musical classifications
On the Internet, articles and posts abound in which musical tastes and preferences are analysed in a very visual way according to different dimensions such as gender, location, activity, etc. Let's look at some examples:
Music, to each his own
For example, on the website towardsdatascience we find an interesting post where the songs of several playlists (data) are analyzed. The goal is to find an objective explanation as to why a person thinks (subjectively) that another person's song list is somewhat boring. Most music databases and music information repositories provide data that help classify songs into genres (Pop, Rock, Indi, etc.) and / or features such as melodic, energetic, danceable, instrumental, etc. Using the APIs of the services or repositories, some basic programming and our ingenuity we can compare the playlists of several people, thus analysing the number of songs of each type. Also, in this post they dare with a fun mathematical formula to define how boring a song is. And this is where more data comes into play again. Apart from the genre and type of music of a song, there are other important parameters, such as the duration, tempo, volume, etc. In this post your definition of boredom in regards to a song is built with:
song_ boredom = volume + tempo + (100 * energy) + (100 * danceability)
With all these data we can calculate a boredom index for each song. If we apply this to all the songs included in the playlists of several users, we can analyse the musical boredom index by user, which is still fun.
But why stop here? We have created a musical boredom index, but why we do not try to build a system that is able to predict to whom (to which user) a song corresponds according to their musical tastes and also according to the boredom index of the song? For this, we already need the help of our machine learning tools. Using a very simple and usual algorithm known as Logistic Regression, the author of the post has been able to train a model with to classify a certain song and decide who corresponds.
Sonification of the data.
If building a musical boredom index seemed daring and fun, wait to see what can be done with some data, a little imagination and some open-source tools. There may not be a clearly practical goal to convert data sets into music, but the experiment is well worth it. We will explain slightly what we are going to do. First of all, we are going to use a very common and well-organized open data set such as those from the Spanish Meteorological Agency (AEMET). In its open data portal we can find different data catalogues. In our particular case we will download the daily weather from January 1, 2019 until November 16, 2019 for two provinces, very different climatologically speaking, such as Asturias and Seville.
An example of the type of data we obtain is the following:
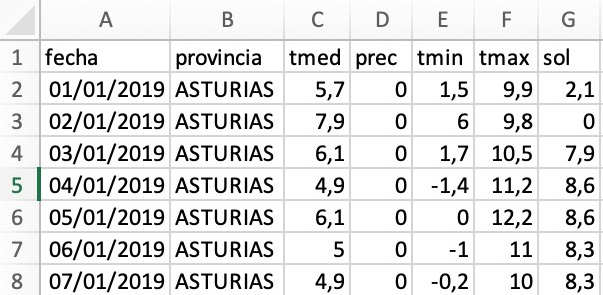
What we do next is to use the website of the application https://app.twotone.io/ to build the soundtrack of the amount of sun that both provinces receive during the year and compare them with each other. Full documentation about this open source application can be found in this Github repository https://github.com/datavized/twotone/
The result when the melody is built looks like this:
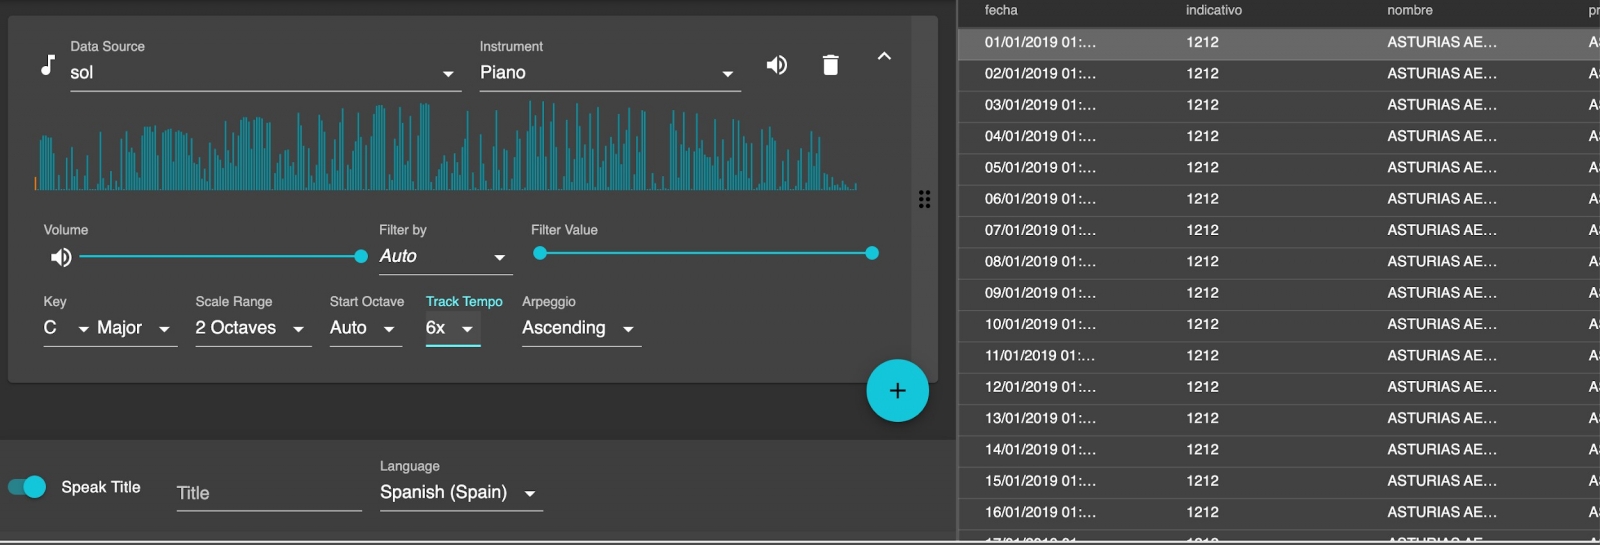
Being able to choose the instrument with which we want to play the soundtrack, the tempo, the key, the scale, etc., the application also allows us to export the melodies for later comparison. The result is surprising and fun:
| Sunshine Hours in Asturias | Sunshine Hours in Sevilla |
|---|---|
Finally, data are the result of the mathematical characterization we make of our environment. Thus, typically, we describe the weather of a region based on its characteristic variables. In this post, we have gone one step further. We have encoded that data in the form of musical notes. Data and music are connected and here we have described a practical application of this relationship. We hope you enjoy the soundtrack that accompanies this post.
Content prepared by Alejandro Alija, expert in Digital Transformation and innovation.
Contents and points of view expressed in this publication are the exclusive responsibility of its author.
Comments