3 posts found
Summer Open Data: Featured Apps and Resources
Between ice cream and longer days, summer is here. At this time of year, open information can become our best ally to plan getaways, know schedules of the bathing areas in our community or even know the state of traffic on roads that take us to our next destination.
Whether you're on the move or at…
The most popular network analysis tools
Two decades ago they did not exist, but in recent years, social networks have become an important part of our lives. 29 million Spaniards actively use these services, according to data compiled by EPData. On average, users spend almost 2 hours a day connected to them.
This data makes social networks…
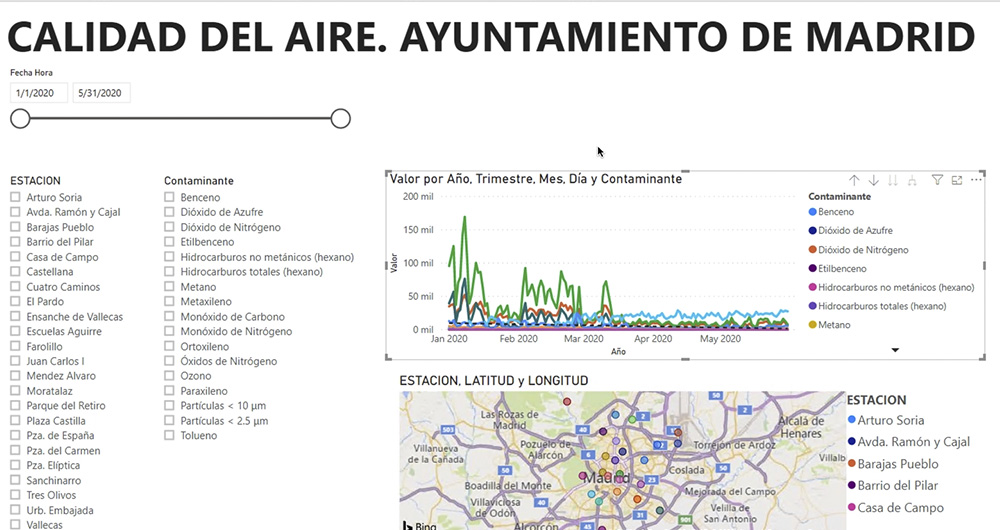
What is an interactive display? Here is an example
The visual representation of data helps our brain to digest large amounts of information quickly and easily. Interactive visualizations make it easier for non-experts to analyze complex situations represented as data.
As we introduced in our last post on this topic, graphical data visualization is a…


