
Description
Talking about GPT-3 these days is not the most original topic in the world, we know it. The entire technology community is publishing examples, holding events and predicting the end of the world of language and content generation as we know it today. In this post, we ask ChatGPT to help us in programming an example of data visualisation with R from an open dataset available at datos.gob.es.
Introduction
Our previous post talked about Dall-e and GPT-3's ability to generate synthetic images from a description of what we want to generate in natural language. In this new post, we have done a completely practical exercise in which we ask artificial intelligence to help us make a simple program in R that loads an open dataset and generates some graphical representations.
We have chosen an open dataset from the platform datos.gob.es. Specifically, a simple dataset of usage data from madrid.es portals. The description of the repository explains that it includes information related to users, sessions and number of page views of the following portals of the Madrid City Council: Municipal Web Portal, Sede Electrónica, Transparency Portal, Open Data Portal, Libraries and Decide Madrid.
The file can be downloaded in .csv or .xslx format and if we preview it, it looks as follows:

OK, let's start co-programming with ChatGPT!
First we access the website and log in with our username and password. You need to be registered on the openai.com website to be able to access GPT-3 capabilities, including ChatGPT.
We start our conversation:

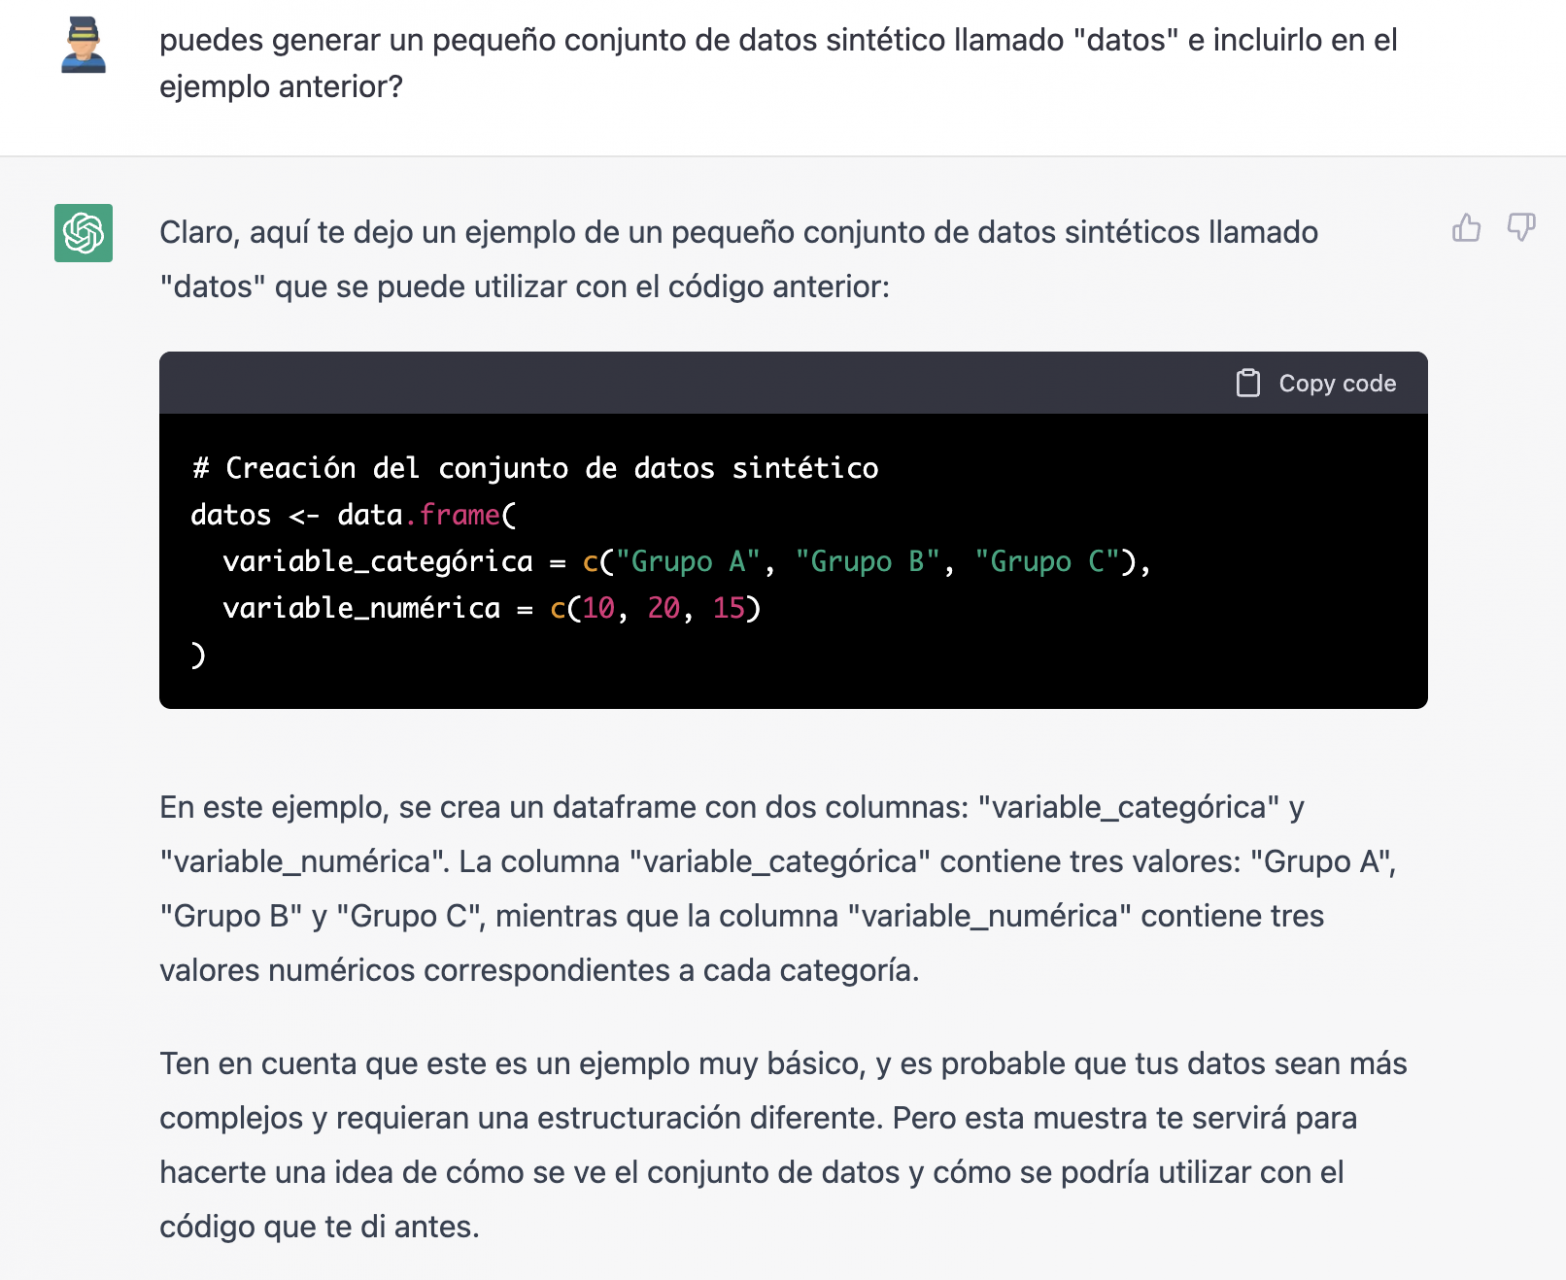
During this exercise we have tried to have a conversation in the same way as we would have with a programming partner. So the first step we do is to say ‘hello’ and mention the problem we have. When we ask the AI to help us create a small program in R that graphically represents some data, it gives us some examples and helps us with the explanation of the program:

Since we have no data, we cannot do anything practical at the moment, so we ask it to help us generate some synthetic data.
As we say, we behave with the AI as we would with a person (it looks good).

Once the AI seems to easily answer our questions, we go to the next step, we are going to give it the data. And here the magic begins... We have opened the data file that we have downloaded from datos.gob.es and we have copied and pasted a sample.
| Note: ChatGPT has no internet connection and therefore cannot access external data, so all we can do is give it an example of the actual data we want to work with. |
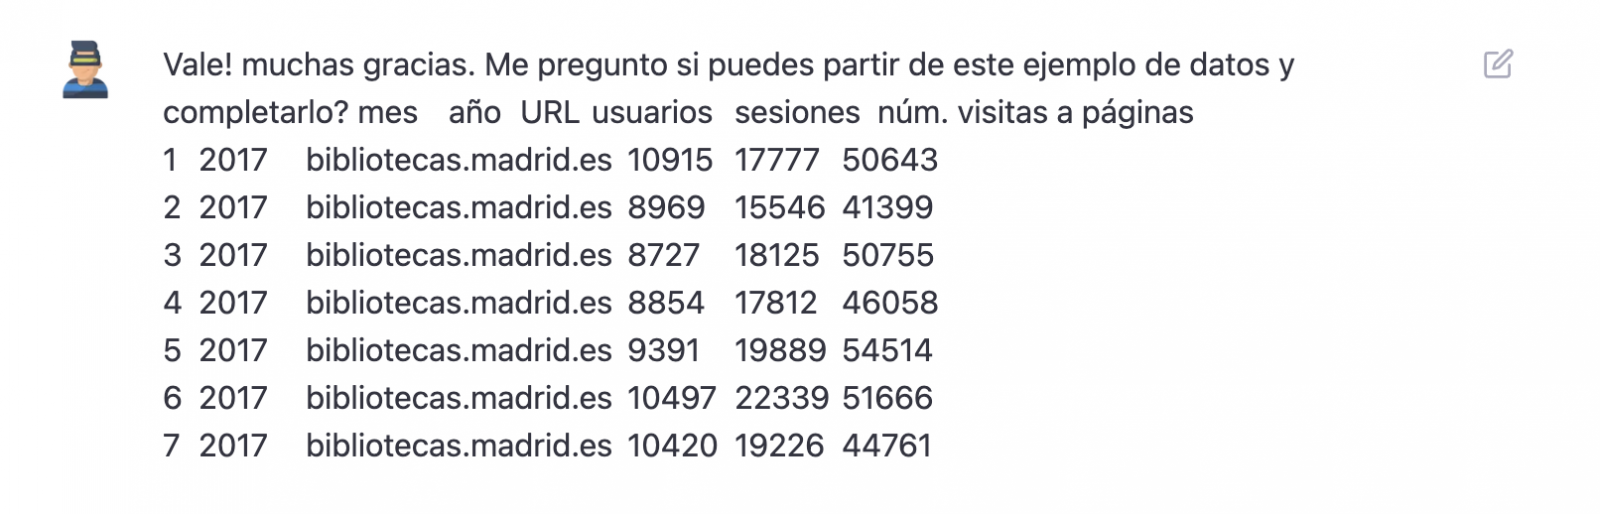

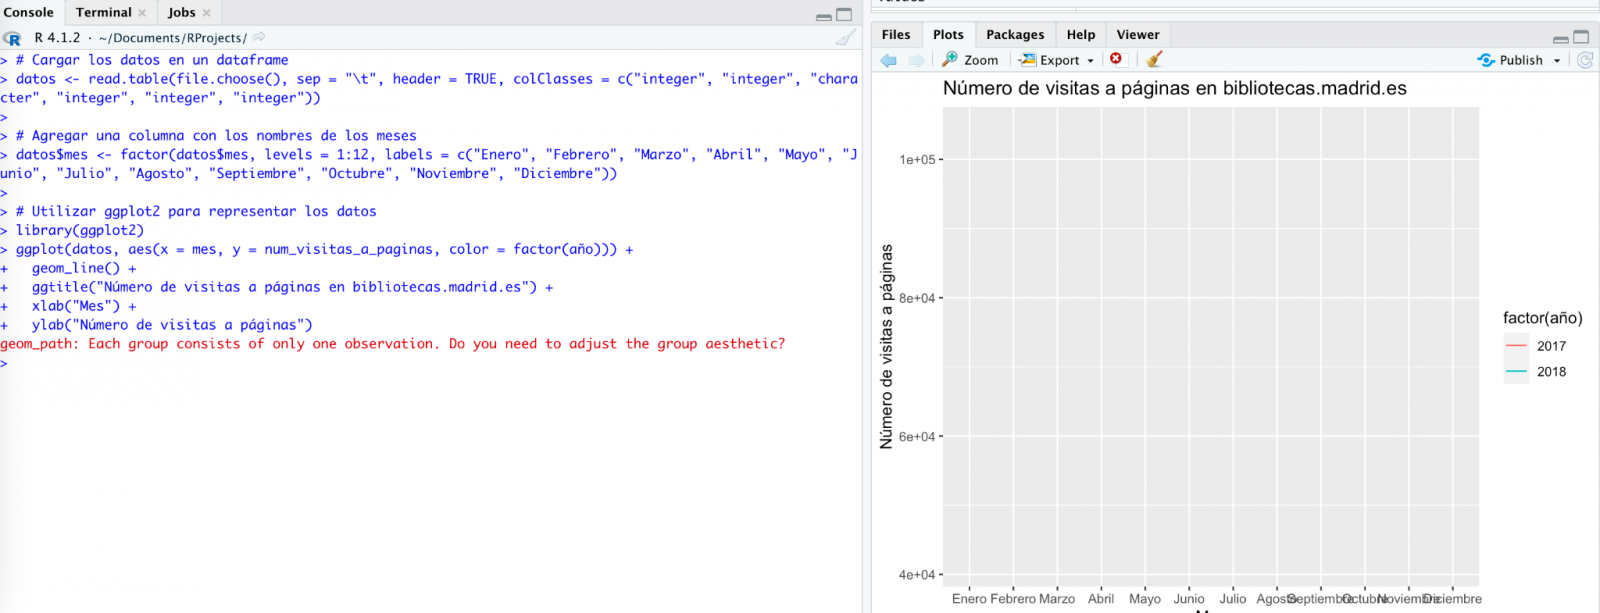
With the data copied and pasted as we have given it to it, the AI writes the code in R to load it manually into a dataframe called \"data\". It then gives us the code for ggplot2 (the most popular graphics library in R) to plot the data along with an explanation of how the code works.

Great! This is a spectacular result with a totally natural language and not at all adapted to talk to a machine. Let's see what happens next:
But it turns out that when we copy and paste the code into an RStudio environment it is no running.

So, we tell to it what's going on and ask it to help us to solve it.

We tried again and, in this case, it works!
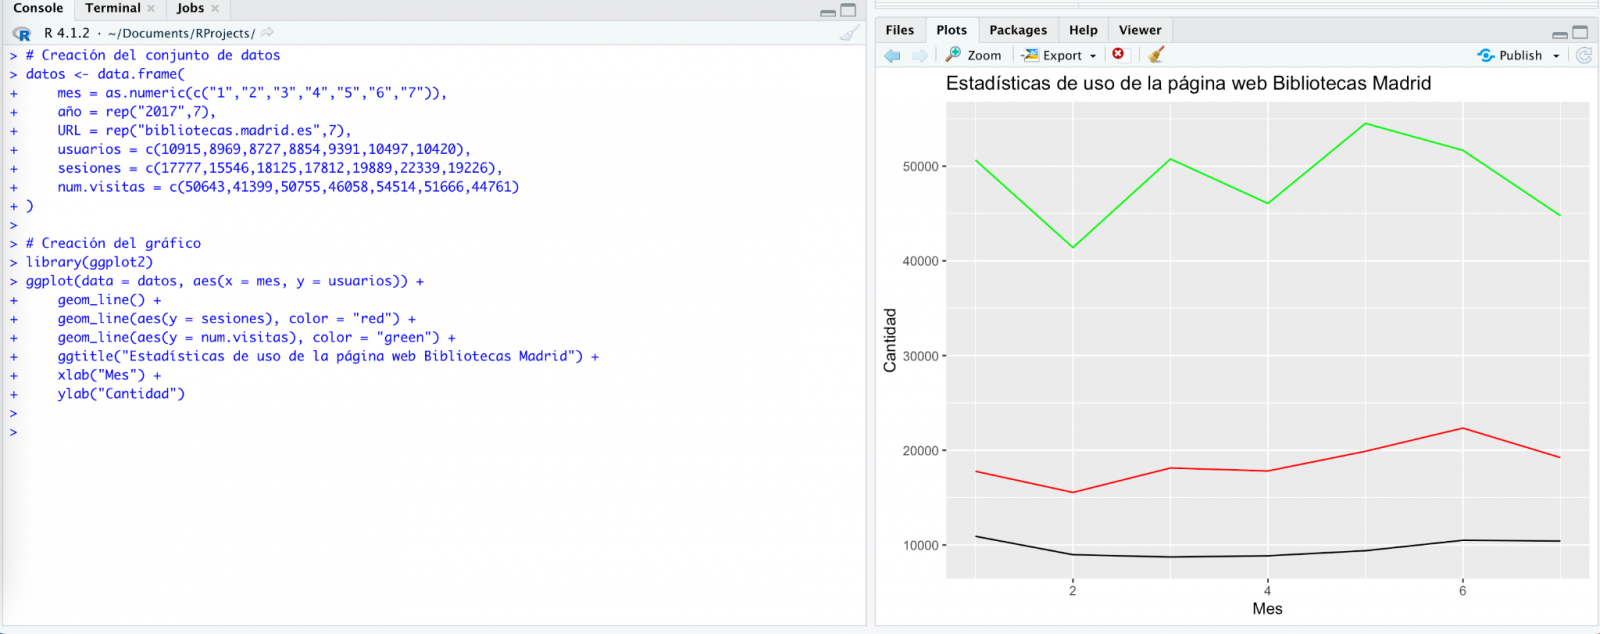
However, the result is a bit clumsy. So, we tell it.

From here (and after several attempts to copy and paste more and more rows of data) the AI changes the approach slightly and provides me with instructions and code to load my own data file from my computer instead of manually entering the data into the code.

We take its opinion into account and copy a couple of years of data into a text file on our computer. Watch what happens next:

We try again:
As you can see, it works, but the result is not quite right.
And let's see what happens.

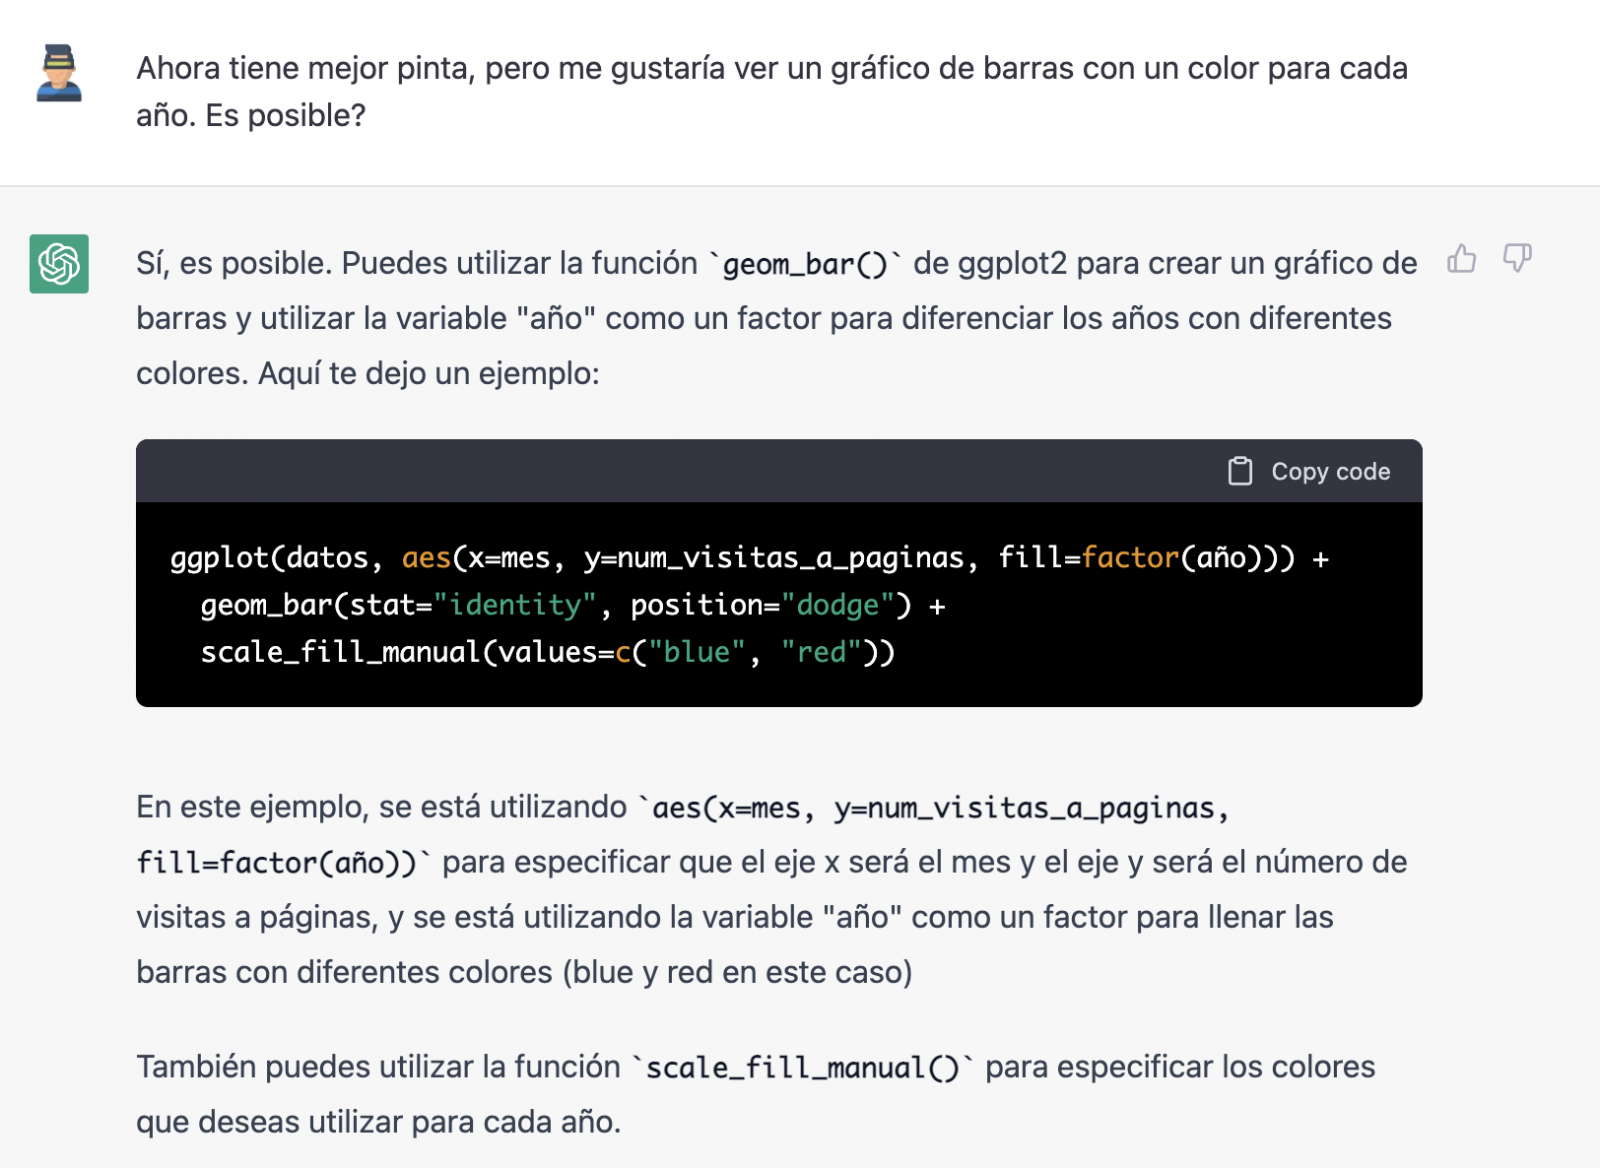
Finally, it looks like it has understood us! That is, we have a bar chart with the visits to the website per month, for the years 2017 (blue) and 2018 (red). However, I am not convinced by the format of the axis title and the numbering of the axis itself.

Let's look at the result now.

It looks much better, doesn't it? But what if we give it one more twist?
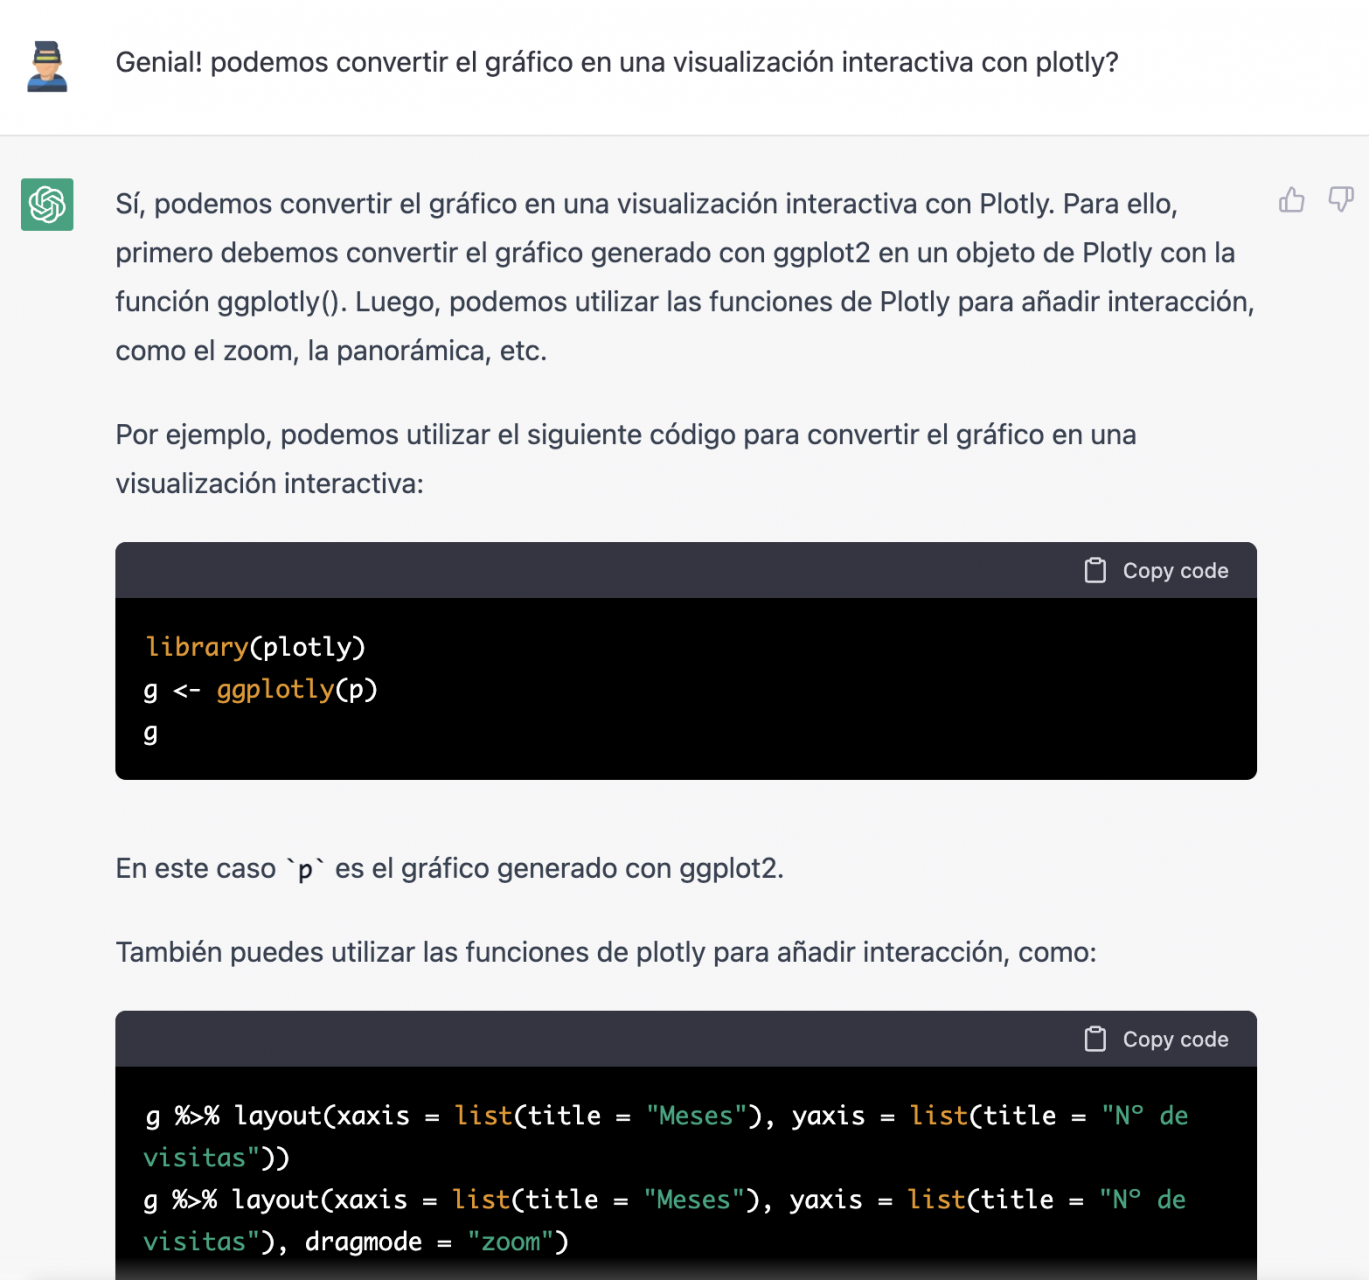
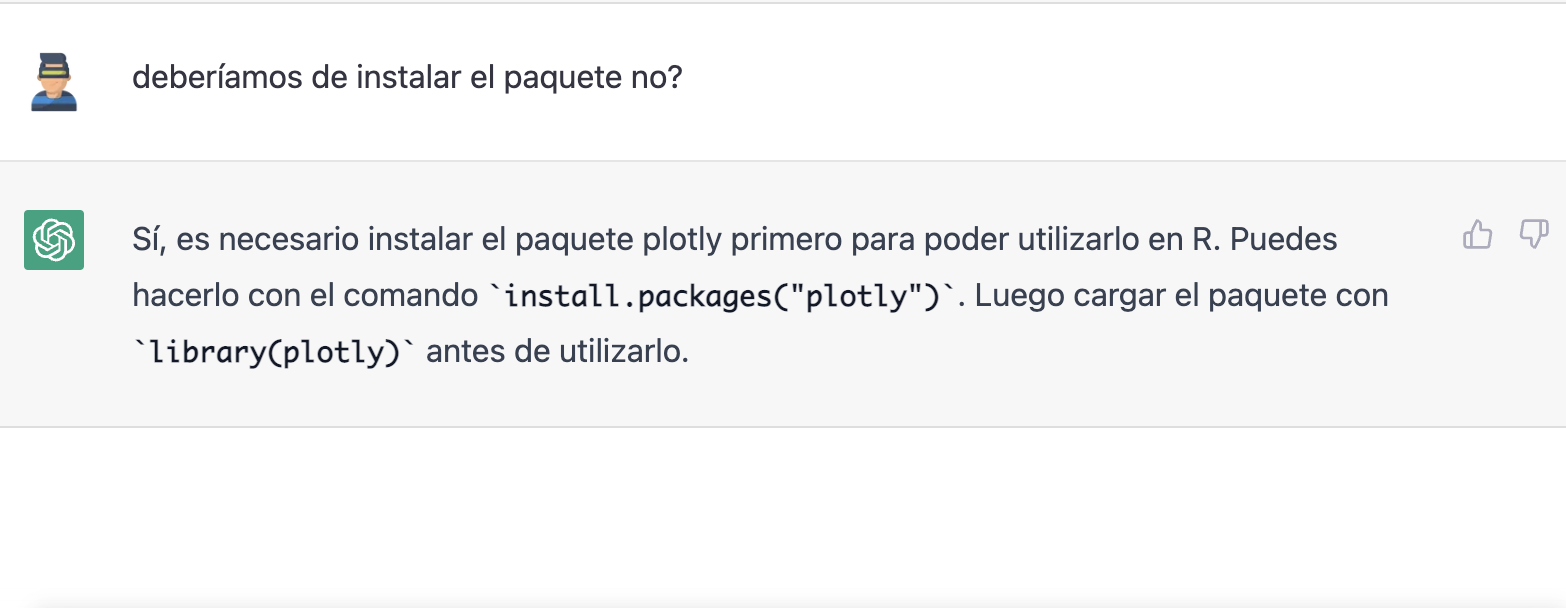
However, it forgot to tell us that we must install the plotly package or library in R. So, we remind it.
Let's have a look at the result:

As you can see, we have now the interactive chart controls, so that we can select a particular year from the legend, zoom in and out, and so on.
Conclusion
You may be one of those sceptics, conservatives or cautious people who think that the capabilities demonstrated by GPT-3 so far (ChatGPT, Dall-E2, etc) are still very infantile and impractical in real life. All considerations in this respect are legitimate and, many of them, probably well-founded.
However, some of us have spent a good part of our lives writing programs, looking for documentation and code examples that we could adapt or take inspiration from; debugging bugs, etc. For all of us (programmers, analysts, scientists, etc.) to be able to experience this level of interlocution with an artificial intelligence in beta mode, made freely available to the public and being able to demonstrate this capacity for assistance in co-programming, is undoubtedly a qualitative and quantitative leap in the discipline of programming.
We don't know what is going to happen, but we are probably on the verge of a major paradigm shift in computer science, to the point that perhaps the way we program has changed forever and we haven't even realised it yet.
Content prepared by Alejandro Alija, Digital Transformation expert.
The contents and points of view reflected in this publication are the sole responsibility of the author.
Realmente es impresionante, pero todavía me ha dejado más sorprendido la capacidad que tiene para interpretar los resultados. Por ejemplo, se le proporciona la salida de un modelo de regresión (summary) y se le pide que lo resuma y comente. Se puede añadir el "nivel" de los comentarios, señalando que se quieren para un artículo científico o que sean accesibles al público no especializado. Integrar esa capacidad en el flujo de un trabajo de análisis de datos tipo "reporting" abre la puerta a nuevas y excitantes posibilidades.
Gracias por su comentario, Juan Carlos. Nos alegra saber que le ha resultado interesante, seguiremos compartiendo ejercicios prácticos elaborados por expertos. Un saludo.
Alex, gracias por el post; es una magnífica reflexión que, sin duda, anticipa lo que está por venir. Abz.
Gracias por su comentario, Óscar. Le hacemos llegar su valoración positiva al autor del artículo. Un saludo.