11 documents found
How to use OGC APIs to enhance geospatial data interoperability
In a world where geospatial information is crucial to address global challenges such as climate change and natural resource management, interoperability and the creation of standards are essential. Interoperability facilitates collaboration between organisations, drives innovation and ensures that…
- Guides

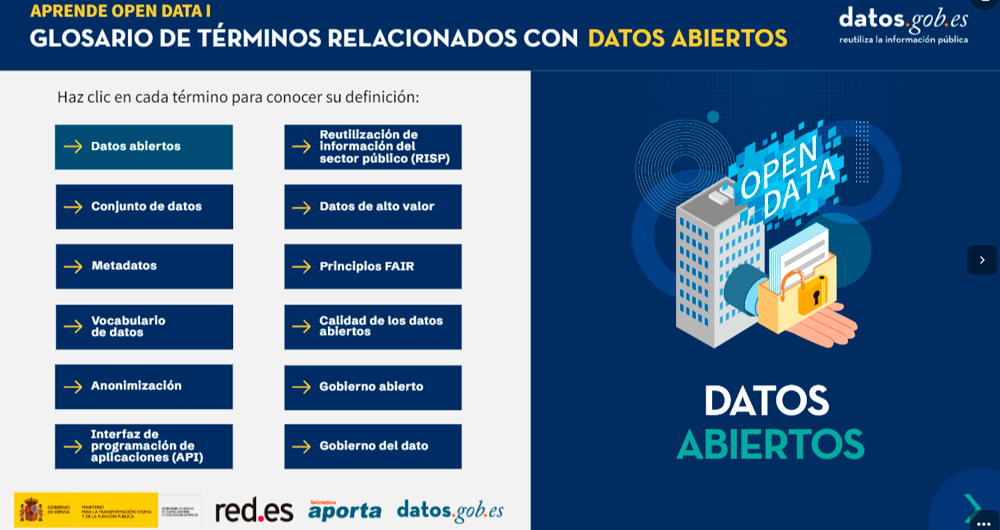
Glossary of data-related terms
The following is a definition of various terms regarding data and related technologies.
1. Glossary of terms related to open data.
(You can download the accessible version here)
2. Glossary of terms related to new technologies and data
(You can download the accessible version…
- Guides
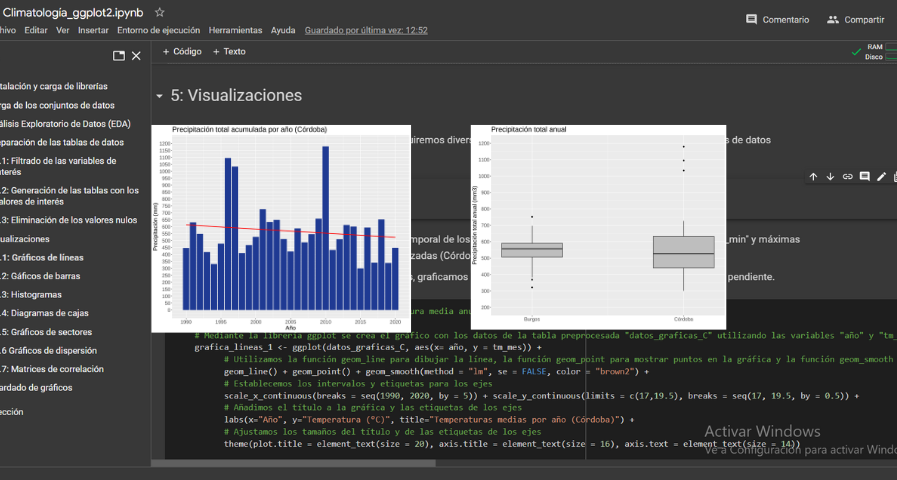
Analysis of meteorological data using the "ggplot2" library
1. Introduction
Visualizations are graphical representations of data that allow the information linked to them to be communicated in a simple and effective way. The visualization possibilities are very wide, from basic representations, such as a line chart, bars or sectors, to visualizations…
- Data exercises
Characteristics of the Spanish University students and most demanded degrees
1. Introduction
Visualizations are graphical representations of data that allow to transmit in a simple and effective way the information linked to them. The visualization potential is very wide, from basic representations, such as a graph of lines, bars or sectors, to visualizations configured on…
- Data exercises

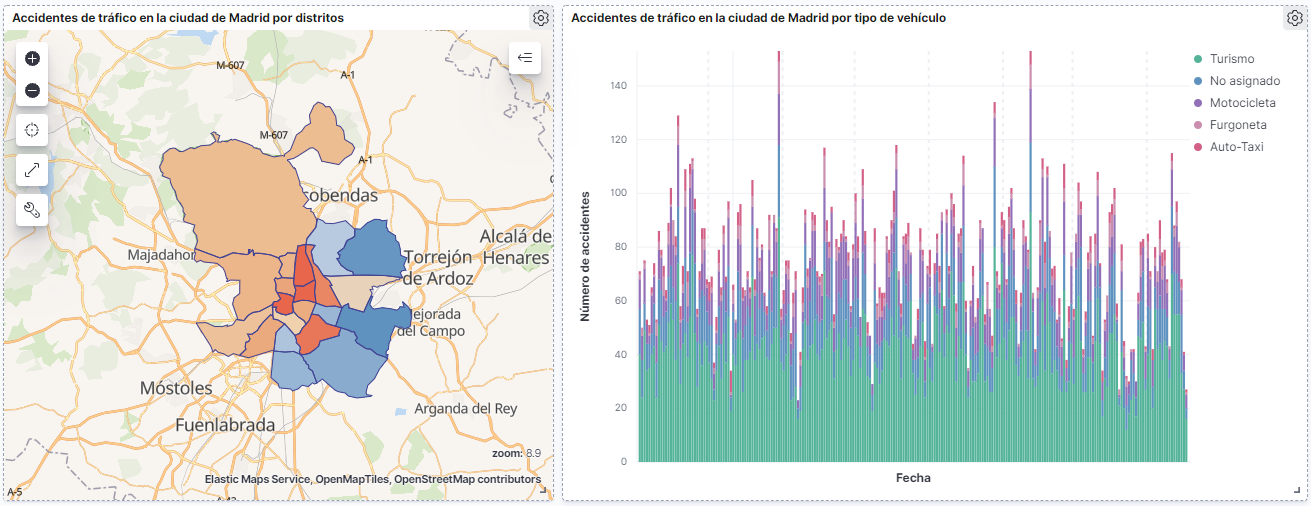
How many accidents occur in the city of Madrid?
1. Introduction
Data visualization is a task linked to data analysis that aims to graphically represent underlying data information. Visualizations play a fundamental role in the communication function that data possess, since they allow to drawn conclusions in a visual and understandable way,…
- Data exercises
Help videos for data reusers in datos.gob.es
In a platform such as datos.gob.es, where the frequency of dataset updates is constant, it is necessary to have mechanisms that facilitate massive and automatic queries.
In datos.gob.es we have an API and a SPARQL point to facilitate this task. Both tools allow querying the metadata associated with…
- Guides

Infographics: Aporta Challenges
The Aporta Challenges are awards for new ideas and prototypes that, making use of open data, lead to efficiency improvements in a specific sector of activity. In this section you will find infographics with information about the different editions carried out.
I Aporta challenge: The value of the…
- Infographics

Characterization of the employment demand and registered contracting in Spain
1. Introduction
Data visualization is a task linked to data analysis that aims to represent graphically the underlying information. Visualizations play a fundamental role in data communication, since they allow to draw conclusions in a visual and understandable way, also allowing detection of…
- Data exercises

A practical guide to publishing Open Data using APIs
An application programming interface or API is a mechanism that allows communication and information exchange between systems. Open data platforms, such as datos.gob.es, have this type of tool to interact with the information system and consult the data without the need for knowledge of the…
- Guides

How to generate value from data: formats, techniques and tools to analyse open data
In the digital world, data becomes a fundamental asset for companies. Thanks to them, they can better understand their environment, business and competition, and make convenient decisions at the right time.
In this context, it is not surprising that an increasing number of companies are looking for…
- Reports and studies
