19 documents found
Design and visualize road accident rates using D3.js
Introduction
Every year there are tens of thousands of accidents in Spain, in which thousands of people are injured of varying degrees, and which occur in very different circumstances, both in terms of the type of road and the type of accident.
Many of the statistics related to these parameters are…
- Data exercises

Conversational Agent on an MCP Server at datos.gob.es
IA agents (such as Google ADK, Langchain and so) are so-called "brains". But these brains without "hands" cannot operate on the real world performing API requests or database queries. These "hands" are the tools.
The challenge is the following: how do you connect brain with hands in an…
- Data exercises

Chatting with Public Data: A Practical Application of Artificial Intelligence
Open data portals are an invaluable source of public information. However, extracting meaningful insights from this data can be challenging for users without advanced technical knowledge.
In this practical exercise, we will explore the development of a web application that democratizes access to…
- Data exercises

Word Embeddings - Practical Exercise on Tag Processing
Open data portals play a fundamental role in accessing and reusing public information. A key aspect in these environments is the tagging of datasets, which facilitates their organization and retrieval.
Word embeddings represent a transformative technology in the field of natural language…
- Data exercises

Tourism in Spain: Analyzing National Tourist Flows Using Interactive Visualizations
1. Introduction
Visualizations are graphical representations of data that allow for the simple and effective communication of information linked to them. The possibilities for visualization are very broad, from basic representations such as line graphs, bar charts or relevant metrics, to…
- Data exercises

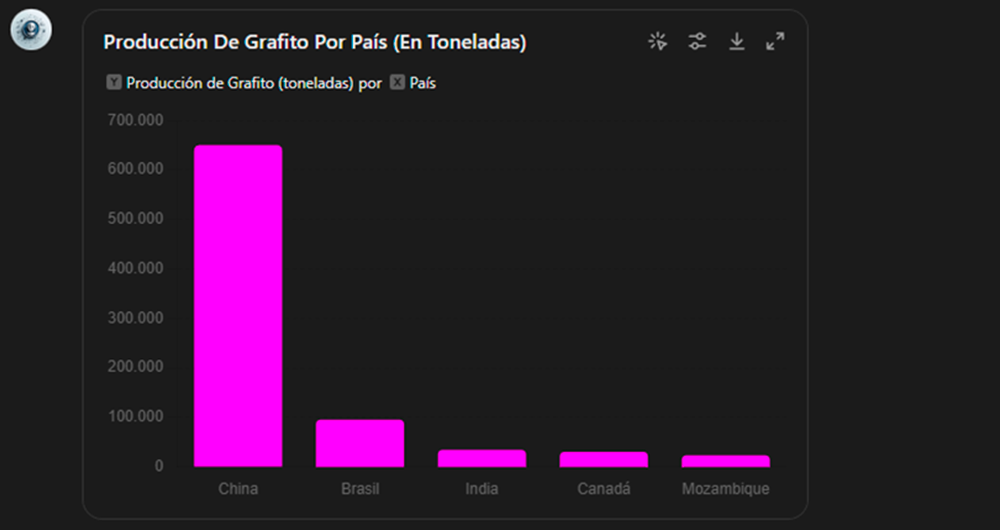
How to Create an Expert Assistant with Open Data: Building GPT to Answer the Critical Minerals Challenge
1. Introduction
In the information age, artificial intelligence has proven to be an invaluable tool for a variety of applications. One of the most incredible manifestations of this technology is GPT (Generative Pre-trained Transformer), developed by OpenAI. GPT is a natural language model…
- Data exercises
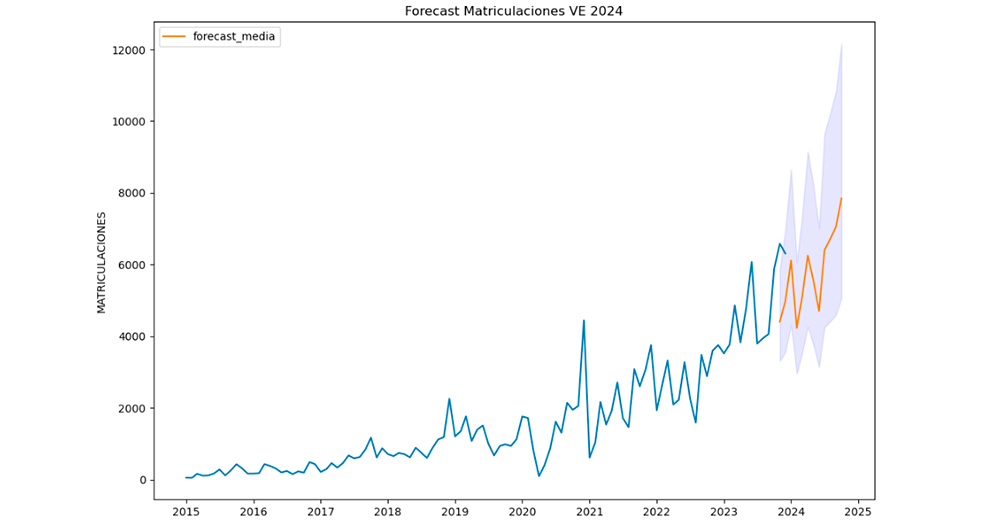
Road to electrification: Deciphering electric vehicle growth in Spain through data analytics
1. Introduction
Visualisations are graphical representations of data that allow to communicate, in a simple and effective way, the information linked to the data. The visualisation possibilities are very wide ranging, from basic representations such as line graphs, bar charts or relevant metrics,…
- Data exercises
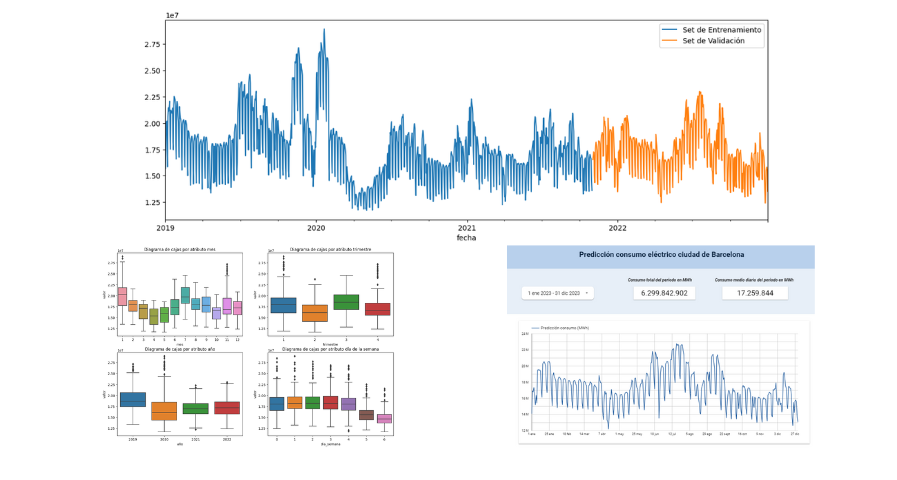
Predictive analisys of electric consuption in the city of Barcelona
1. Introduction
Visualizations are graphical representations of data that allow you to communicate, in a simple and effective way, the information linked to it. The visualization possibilities are very extensive, from basic representations such as line graphs, bar graphs or relevant metrics, to…
- Data exercises
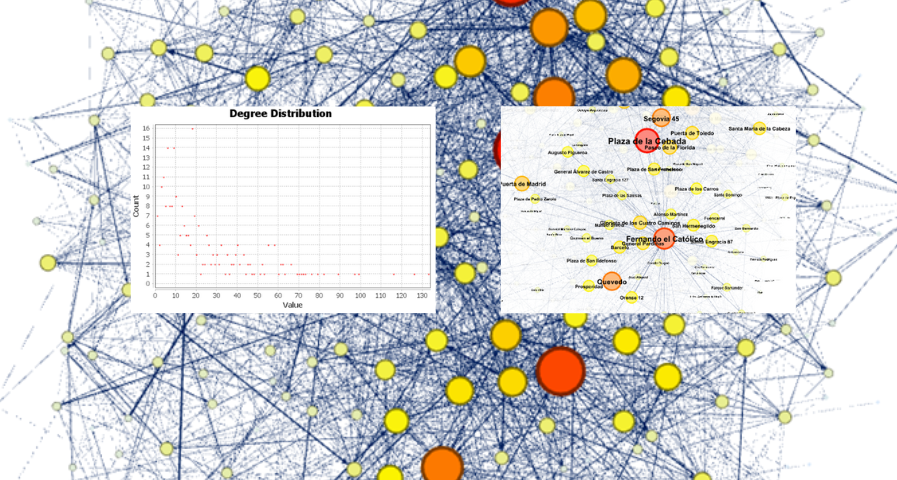
Analysis of travel networks in BICIMAD
1. Introduction
Visualizations are graphical representations of data that allow the information linked to them to be communicated in a simple and effective way. The visualization possibilities are very wide, from basic representations, such as line, bar or sector graphs, to visualizations…
- Data exercises
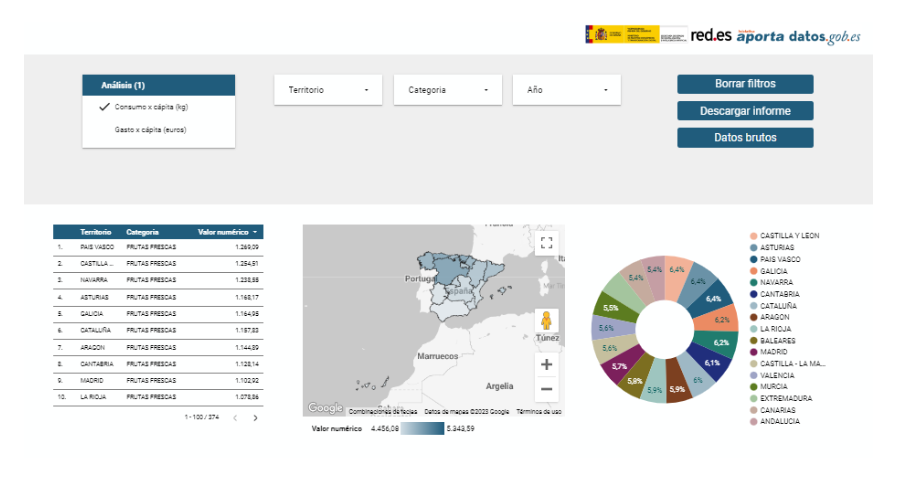
Study on nutrition in spanish homes
1. Introduction
Visualizations are graphical representations of data that allow the information linked to them to be communicated in a simple and effective way. The visualization possibilities are very wide, from basic representations, such as line, bar or sector graphs, to visualizations…
- Data exercises