Publication date
18/05/2026
Type
Data exercises
Description
When we talk about generative AI applied to data, we often stop at isolated examples: a graph, a query, a model. But, in practice, the job of an analyst is much broader: collecting data, cleaning it, understanding it, creating metric variables, and drawing useful conclusions.
Today, AI and data science can optimize data analytics. In this exercise, we are going to show how to do it through a real and reproducible case: a complete analysis of fuel prices in Spain, supported by generative AI in each phase of the workflow.
In this educational exercise, which is reproducible on Google Cola , we analysed more than 11,000 Spanish petrol stations using public data from the Ministry for Ecological Transition and Demographic Challenge to answer business questions such as:
- Which province has the most expensive fuels?
- Does geographic location affect price?
- Are there significant differences between brands?
- Can we predict future fuel prices?
Each step explains how GenAI accelerated the analysis, documenting real problems encountered and proposing reusable solutions.
Access the data lab repository on GitHub
Accesses the GoogleColab notebook
Fast execution
Google Colab (Recommended)
Click on the "Open In Colab" badge above. The notebook runs directly in the browser without the need to install anything.
Total Time: ~4 minutes
Local (Python 3.9+)
git clone <repo-url>
cd exercise-data-ia-copilot
pip install -r requirements.txt
jupyter notebook notebook/Analisis_Carburantes_v0_1.ipynb
Structure
exercise-data-ia-copilot/
├── notebook/
│ └── Analisis_Carburantes_v0_1.ipynb # 19 cells, 100% executable
│
├── prompts/ # Real problems + solutions
│ ├── ingestion/
│ │ ├── descargar_dataset.md # Robust APIs with fallbacks
│ │ └── explorar_estructura.md
│ ├── cleanup/
│ │ ├── validar_precios.md
│ │ └�─ normalizar_marcas.md
│ ├── visualization/
│ │ ├── precio_por_provincia.md # Interactive mapbox scatter
│ │ ├── distribucion_por_marca.md # Box plot top 10 brands
│ │ ├── ubicacion_vs_precio.md # Scatter mapbox 11k stations
│ │ ├── analisis_impacto_features.md # Correlation + trends
│ │ └── mejoras_visualizaciones_interactivas.md
│ └── features/
│ ├── crear_fin_semana.md
│ ├── distancia_punto_referencia.md
│ └── region_geografica.md
│
├── posts/
│ └── Reflexion_GenAI_Analisis_Carburantes.md # Reflection on the process
│
├── specs/ # Technical documentation
│ └── 001-fuels-ia/
│ ├── spec.md # Functional specification
│ ├── plan.md # Technical plan + lessons learned
│ └── checklists/
│
├── tests/ # Validation scripts
│ ├── test_descarga_local.py
│ └── test_notebook_completo.py
│
├── requirements.txt # pandas, matplotlib, scikit-learn├
── LICENSE # MIT
└── README.md # This file
Phases of the analysis
PHASE 0: Preparation
- Environment setup, imports, and metadata
- Notebook version and iteration counter
STEP 1: Robust Ingesta (T009-T010)
- Download from the API of the Ministry for the Ecological Transition and Demographic Challenge
- Triple fallback: requests → curl → datos demo
- Handles SSL, timeouts, and IP blocks
PHASE 2: Cleaning and validation (T014-T017)
- Price validation (realistic range)
- Brand Normalization (Non-Standardized Variants)
- Coordinate filtering (Spain bounding box)
- Null Value Detection
PHASE 3: Exploratory Analysis (T020-T023)
4 visualizations with answers to business questions:
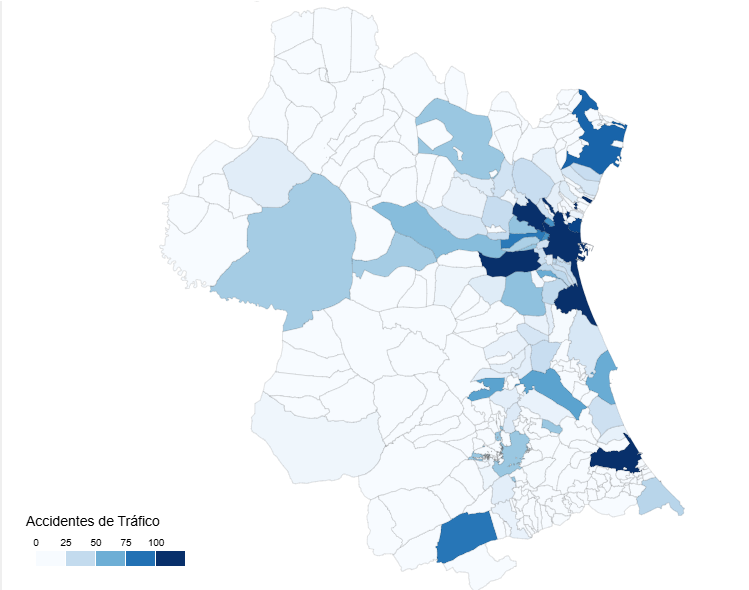
- Bar chart: average price by province (top 12)
- Scatter map: location vs price (peninsula ● / islands ▲)
- Histogram: price distribution (mean + median)
- Bar chart: top 8 brands (normalized, with counts)
PHASE 4: Variable Engineering (T028-T030)
- es_fin_semana: Binary (0=week, 1=weekend)
- distancia_a_madrid: Approach to an economic hub
- Region: North/Central/South (based on latitude)
PHASE 5: Features Impact Analysis (T034-T037)
3 additional visualizations showing the impact of each feature:
- Scatter plot: price vs distance to Madrid (geographical correlation)
- Comparative bar chart: weekend vs weekday price (time impact)
- Regional box plot: price distribution by north/central/south region
Documented Technical Lessons
Every real problem finds a documented solution:
|
# |
Problem |
Solution |
Reusable |
|---|---|---|---|
| 1 | SSL/IP blocking in API | Triple fallback (requests→curl→demo) | Public spanish API |
| 2 | Coordinates outside Spain | Bounding box [lat:27.5-43.8, lon:-18.2-4.4] | Geographic analysis |
| 3 | Brand variants not standardised | .str.upper().str.strip() before grouping | Any aggregation |
| 4 | Similar non-visual figures | ax.set_xlim(min*0.95, max*1.05) | Tight ranges |
| 5 | ValueError: y contains NaN | Validate before train_test_split | ML pipelines |
Figure 1. Summary table of the solutions proposed for each problem in the development of the exercise. Source: own elaboration – datos.gob.es
Each solution is documented in prompts/ with:
- Original Prompt: What We Ask GenAI to Ask
- Result obtained: Code that worked
- Reflection: What we learned + reusable pattern
Conclusion
The interesting thing about this exercise has not been so much the final result of the analysis, but the path to get there. Working with real data is almost never an obvious and linear process. In this case, the process has been full of small frictions that also define the actual work of any data analyst.
From the beginning, various problems appear: APIs that do not always respond stably, occasional crashes when trying to download information, or the need to design fallback mechanisms so as not to depend on a single data source.
On all these points, GenAI has helped to propose approaches and generate alternatives, but always within a process of constant validation by the analyst.
In summary, the most relevant thing we can extract from the realization of this exercise is the idea that the value is in how the obstacles of the process are overcome, not in avoiding them.
The entire exercise, including the executable notebook in Colab, the code and prompts used in each phase, is available on GitHub to be able to reproduce it step by step.
Content created by Alejandro Alija, an expert in digital transformation and innovation. The content and views expressed in this publication are the sole responsibility of the author.