Creating word clouds from the text data with NLP techniques


Fecha del documento: 14-12-2021
1. Introduction
Visualizations are a graphic representation that allow us to comprehend in a simple way the information that the data contains. Thanks to visual elements, such as graphs, maps or word clouds, visualizations also help to explain trends, patterns, or outliers that data may present.
Visualizations can be generated from the data of a different nature, such as words that compose a news, a book or a song. To make visualizations out of this kind of data, it is required that the machines, through software programs, are able to understand, interpret and recognize the words that form human speech (both written or spoken) in multiple languages. The field of studies focused on such data treatment is called Natural Language Processing (NLP). It is an interdisciplinary field that combines the powers of artificial intelligence, computational linguistics, and computer science. NLP-based systems have allowed great innovations such as Google's search engine, Amazon's voice assistant, automatic translators, sentiment analysis of different social networks or even spam detection in an email account.
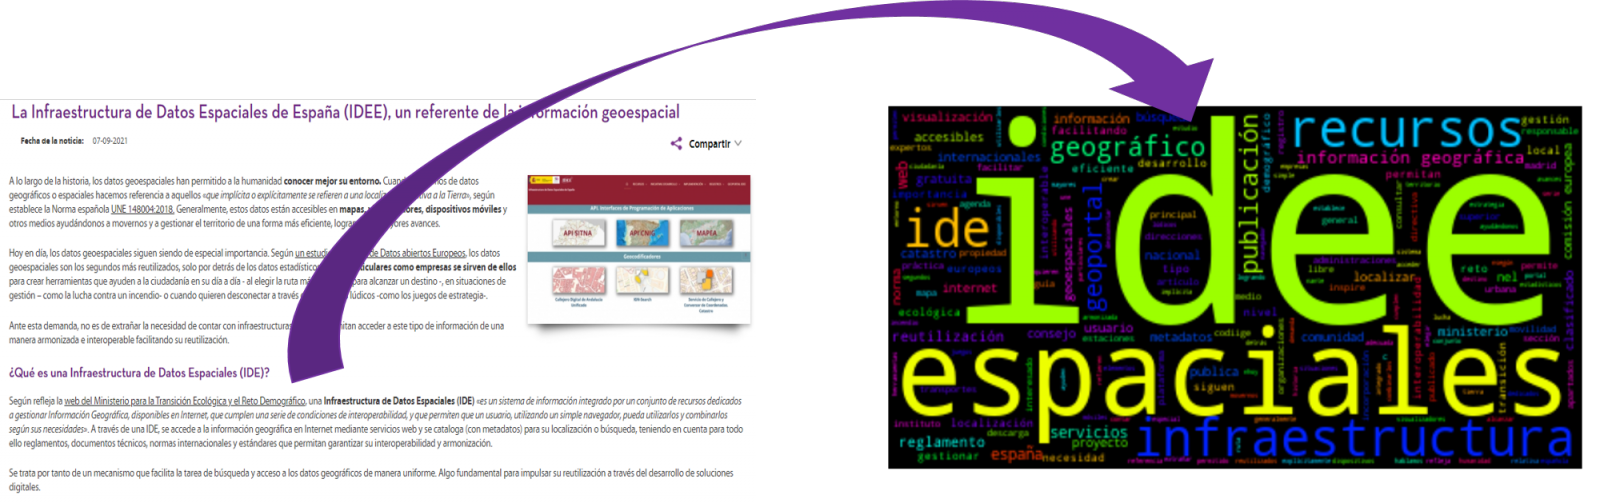
In this practical exercise, we will apply a graphical visualization for a keywords summary representing various texts extracted with NLP techniques. Especially, we are going to create a word cloud that summarizes which are the most reoccurring terms in several posts of the portal.
This visualization is included within a series of practical exercises, in which open data available on the datos.gob.es portal is used. These address and describe in a simple way the steps necessary to obtain the data, perform transformations and analysis that are relevant to the creation of the visualization, with the maximum information extracted. In each of the practical exercises, simple code developments are used that will be conveniently documented, as well as free and open use tools. All the generated material will be available in the Data Lab repository on GitHub.
2. Objetives
The main objective of this post is to learn how to create a visualization that includes images, generated from sets of words representative of various texts, popularly known as "word clouds". For this practical exercise we have chosen 6 posts published in the blog section of the datos.gob.es portal. From these texts using NLP techniques we will generate a word cloud for each text that will allow us to detect in a simple and visual way the frequency and importance of each word, facilitating the identification of the keywords and the main theme of each of the posts.
From a text we build a cloud of words applying Natural Language Processing (NLP) techniques
3. Resources
3.1. Tools
To perform the pre-treatment of the data (work environment, programming and the very edition), such as the visualization itself, Python (versión 3.7) and Jupyter Notebook (versión 6.1) are used, tools that you will find integrated in, along with many others in Anaconda, one of the most popular platforms to install, update and manage software to work in data science. To tackle tasks related to Natural Language Processing, we use two libraries, Scikit-Learn (sklearn) and wordcloud. All these tools are open source and available for free..
Scikit-Learn is a very popular vast library, designed in the first place to carry out machine learning tasks on data in textual form. Among others, it has algorithms to perform classification, regression, clustering, and dimensionality reduction tasks. In addition, it is designed for deep learning on textual data, being useful for handling textual feature sets in the form of matrices, performing tasks such as calculating similarities, classifying text and clustering. In Python, to perform this type of tasks, it is also possible to work with other equally popular libraries such as NLTK or spacy, among others.
wordcloud eis a library specialized in creating word clouds using a simple algorithm that can be easily modified.
To facilitate understanding for readers not specialized in programming, the Python code included below, accessible by clicking on the "Code" button in each section, is not designed to maximize its efficiency, but to facilitate its comprehension, therefore it is likely that readers more advanced in this language may consider more efficient, alternative ways to code some functionalities. The reader will be able to reproduce this analysis if desired, as the source code is available on datos.gob.es's GitHub account. The way the code is provided is through a Jupyter Notebook, which once loaded into the development environment can be easily executed or modified if desired.
3.2. Datasets
For this analysis, 6 posts recently published on the open data portal datos.gob.es, in its blog section, have been selected. These posts are related to different topics related to open data:
- The latest news in natural language processing: summaries of classic works in just a few hundred words.
- The importance of anonymization and data privacy.
- The value of real-time data through a practical example.
- New initiatives to open and harness data for health research.
- Kaggle and other alternative platforms for learning data science.
- The Spatial Data Infrastructure of Spain (IDEE), a benchmark for geospatial information.
4. Data processing
Before advancing to creation of an effective visualization, we must perform a preliminary data treatment or pre-processing of the data, paying attention to obtaining them, ensuring that they do not contain errors and are in a suitable format for processing. Data pre-processing is essential for build any effective and consistent visual representation.
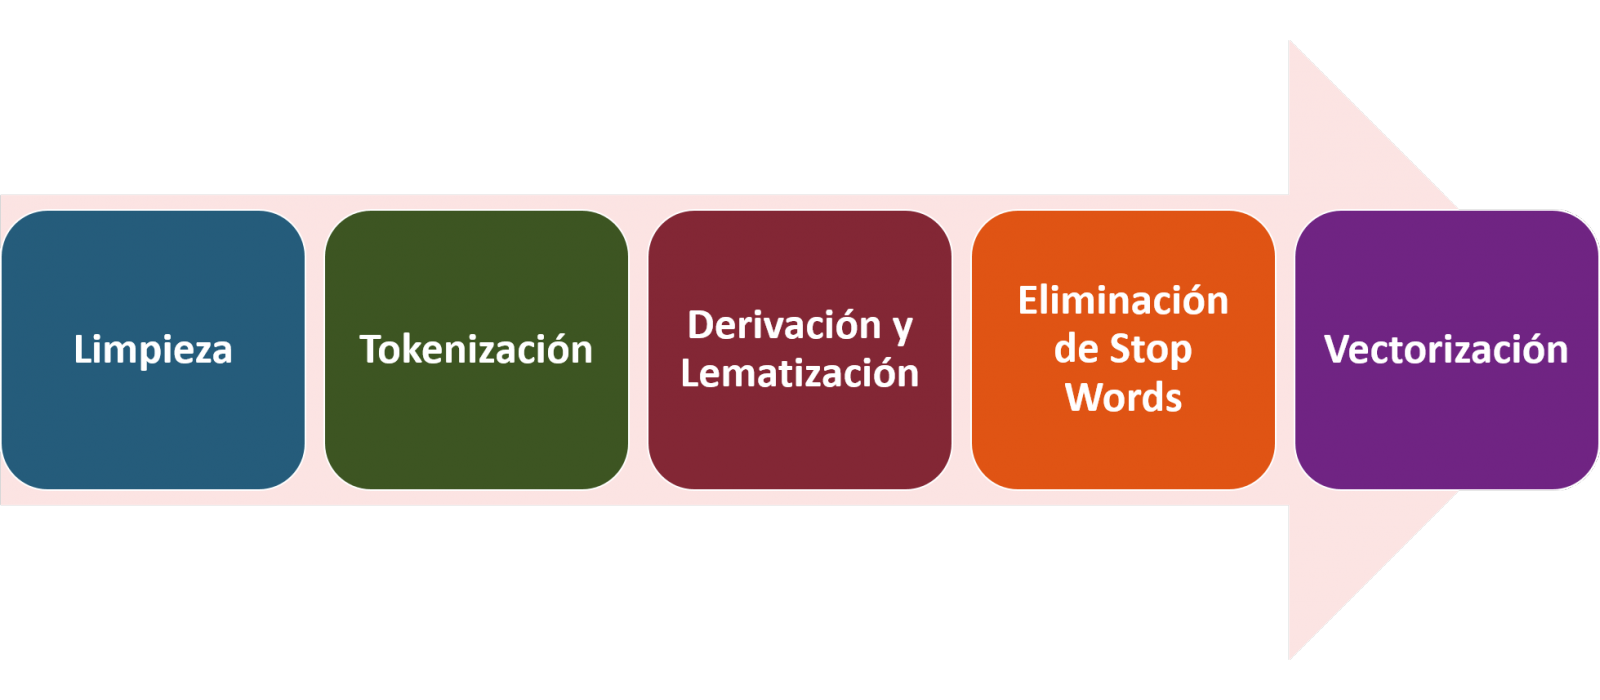
In NLP, the pre-processing of the data consists mainly of a series of transformations that are carried out on the input data, in our case several posts in TXT format, with the aim of obtaining standardized data and without elements that may affect the quality of the results, in order to facilitate its subsequent processing to perform tasks such as, generate a word cloud, perform opinion/sentiment mining or generate automated summaries from input texts. In general, the flowchart to be followed to perform word preprocessing includes the following steps:
- Cleaning: Removal of special characters and symbols that inflict results distortion, such as punctuation marks.
- Tokenize: Tokenization is the process of separating a text into smaller units, tokens. Tokens can be sentences, words, or even characters.
- Derivation and Lemmatisation: this process consists of transforming words to their basic form, that is, to their canonical form or lemma, eliminating plurals, verb tenses or genders. This action is sometimes redundant since it is not always required for further processing to know the semantic similarity between the different words of the text.
- Elimination of stop words: stop words or empty words are those words of common use that do not contribute in a significant way to the text. These words should be removed before text processing as they do not provide any unique information that can be used for the classification or grouping of the text, for example, determining articles such as 'a', 'an', 'the' etc.
- Vectorization: in this step we transform each of the tokens obtained in the previous step to a vector of real numbers that is generated based on the frequency of the appearance of each word in the text. Vectorization allows machines to be able to process text and apply, among others, machine learning techniques.
4.1. Installation and loading of libraries
Before starting with data pre-processing, we need to import the libraries to work with. Python provides a vast number of libraries that allow to implement functionalities for many tasks, such as data visualization, Machine Learning, Deep Learning or Natural Language Processing, among many others. The libraries that we will use for this analysis and visualization are the following:
- os, which allows access to operating system-dependent functionality, such as manipulating the directory structure.
- re, provides functions for processing regular expressions.
- pandas, is a very popular and essential library for processing data tables.
- string, provides a series of very useful functions for handling strings.
- matplotlib.pyplot, contains a collection of functions that will allow us to generate the graphical representations of the word clouds.
- sklearn.feature_extraction.text (Scikit-Learn library), converts a collection of text documents into a vector array. From this library we will use some commands that we will discuss later.
- wordcloud, library with which we can generate the word cloud.
4.2. Data loading
Once the libraries are loaded, we prepare the data with which we are going to work. Before starting to load the data, in the working directory we need: (a) a folder called "post" that will contain all the files in TXT format with which we are going to work and that are available in the repository of this project of the GitHub of datos.gob.es; (b) a file called "stop_words_spanish.txt" that contains the list of stop words in Spanish, which is also available in said repository and (c) a folder called "images" where we will save the images of the word clouds in PNG format, which we will create below.
Next, we will proceed to load the data. The input data, as we have already mentioned, are in TXT files and each file contains a post. As we want to perform the analysis and visualization of several posts at the same time, we will load in our development environment all the texts that interest us, to later insert them in a single table or dataframe.
4.3. Data pre-processing
In order to obtain our objective: generate word clouds for each post, we will perform the following pre-processing tasks.
a) Data cleansing
Once a table containing the texts with which we are going to work has been generated, we must eliminate the noise beyond the text that interests us: special characters, punctuation marks and carriage returns.
First, we put all characters in lowercase to avoid any errors in case-sensitive processes, by using the lower() command.
Then we eliminate punctuation marks, such as periods, commas, exclamations, questions, among many others. For the elimination of these we will resort to the preinitialized string.punctuacion of the string library, which returns a set of symbols considered punctuation marks. In addition, we must eliminate tabs, cart jumps and extra spaces, which do not provide information in this analysis, using regular expressions.
It is essential to apply all these steps in a single function so that they are processed sequentially, because all processes are highly related.
b) Tokenize
Once we have eliminated the noise in the texts with which we are going to work, we will tokenize each of the texts in words. For this we will use the split() function, using space as a separator between words. This will allow separating the words independently (tokens) for future analysis.
c) Removal of "stop words"
After removing punctuation marks and other elements that can distort the target display, we will remove "stop words". To carry out this step we use a list of Spanish stop words since each language has its own list. This list consists of a total of 608 words, which include articles, prepositions, linking verbs, adverbs, among others and is recently updated. This list can be downloaded from the datos.gob.es GitHub account in TXT format and must be located in the working directory.
In this list of words, we will include new words that do not contribute relevant information to our texts or appear recurrently due to their own context. In this case, there is a bunch of words, which we should eliminate since they are present in all posts repetitively since they all deal with the subject of open data and there is a high probability that these are the most significant words. Some of these words are, "item", "data", "open", "case", among others. This will allow to obtain a more representative graphic representation of the content of each post.
On the other hand, a visual inspection of the results obtained allows to detect words or characters derived from errors included in the texts, which obviously have no meaning and that have not been eliminated in the previous steps. These should be removed from the analysis so that they do not distort the subsequent results. These are words like, "nen", "nun" or "nla"
d) Vectorization
Machines are not capable of understanding words and sentences therefore, they must be transformed to some numerical structure. The method consists of generating vectors from each token. In this post we use a simple technique known as bag-of-words (BoW). It consists of assigning a weight to each token proportional to the frequency of appearance of that token in the text. To do this, we work on an array in which each row represents a text and each column a token. To perform the vectorization we will resort to the CountVectorizer() and TfidTransformer() commands of the scikit-learn library.
The CountVectorizer() function allows you to transform text into a vector of frequencies or word counts. In this case we will obtain 6 vectors with as many dimensions as there are tokens in each text, one for each post, which we will integrate into a single matrix, where the columns will be the tokens or words and the rows will be the posts.
Once the word frequency matrix is generated, it is necessary to convert it into a normalized vector form in order to reduce the impact of tokens that occur very frequently in the text. To do this we will use the TfidfTransformer() function.
If you want to know more about the importance of applying this technique, you will find numerous articles on the Internet that talk about it and how relevant it is, among other issues, for SEO optimization.
5. Creation of the word cloud
Once we have concluded the pre-processing of the text, as we indicated at the beginning of the post, it is possible to perform NLP tasks. In this exercise we will create a word cloud or "WordCloud" for each of the analyzed texts.
A word cloud is a visual representation of the words with the highest rate of occurrence in the text. It allows to detect in a simple way the frequency and importance of each of the words, facilitating the identification of the keywords and discovering with a single glance the main theme treated in the text.
For this we are going to use the "wordcloud" library that incorporates the necessary functions to build each representation. First, we have to indicate the characteristics that each word cloud should present, such as the background color (background_color function), the color map that the words will take (colormap function), the maximum font size (max_font_size function) or set a seed so that the word cloud generated is always the same (function random_state) in future implementations. We can apply these and many other functions to customize each word cloud.
Once we have indicated the characteristics that we want each word cloud to present, we proceed to create it and save it as an image in PNG format. To generate the word cloud, we will use a loop in which we will indicate different functions of the matplotlib library (represented by the plt prefix) necessary to graphically generate the word cloud according to the specification defined in the previous step. We have to specify that a world cloud needs to be created for each row of the table, that is, for each text, with the function plt.subplot(). With the command plt.imshow() we indicate that the result is a 2D image. If we want the axes not to be displayed, we must indicate it with the plt.axis() function. Finally, with the function plt.savefig() we will save the generated visualization.
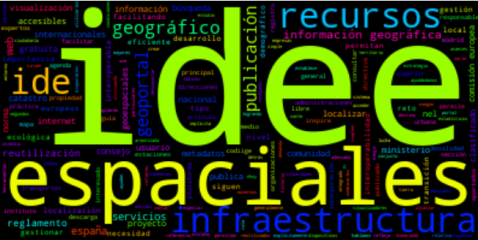
The visualization obtained is:
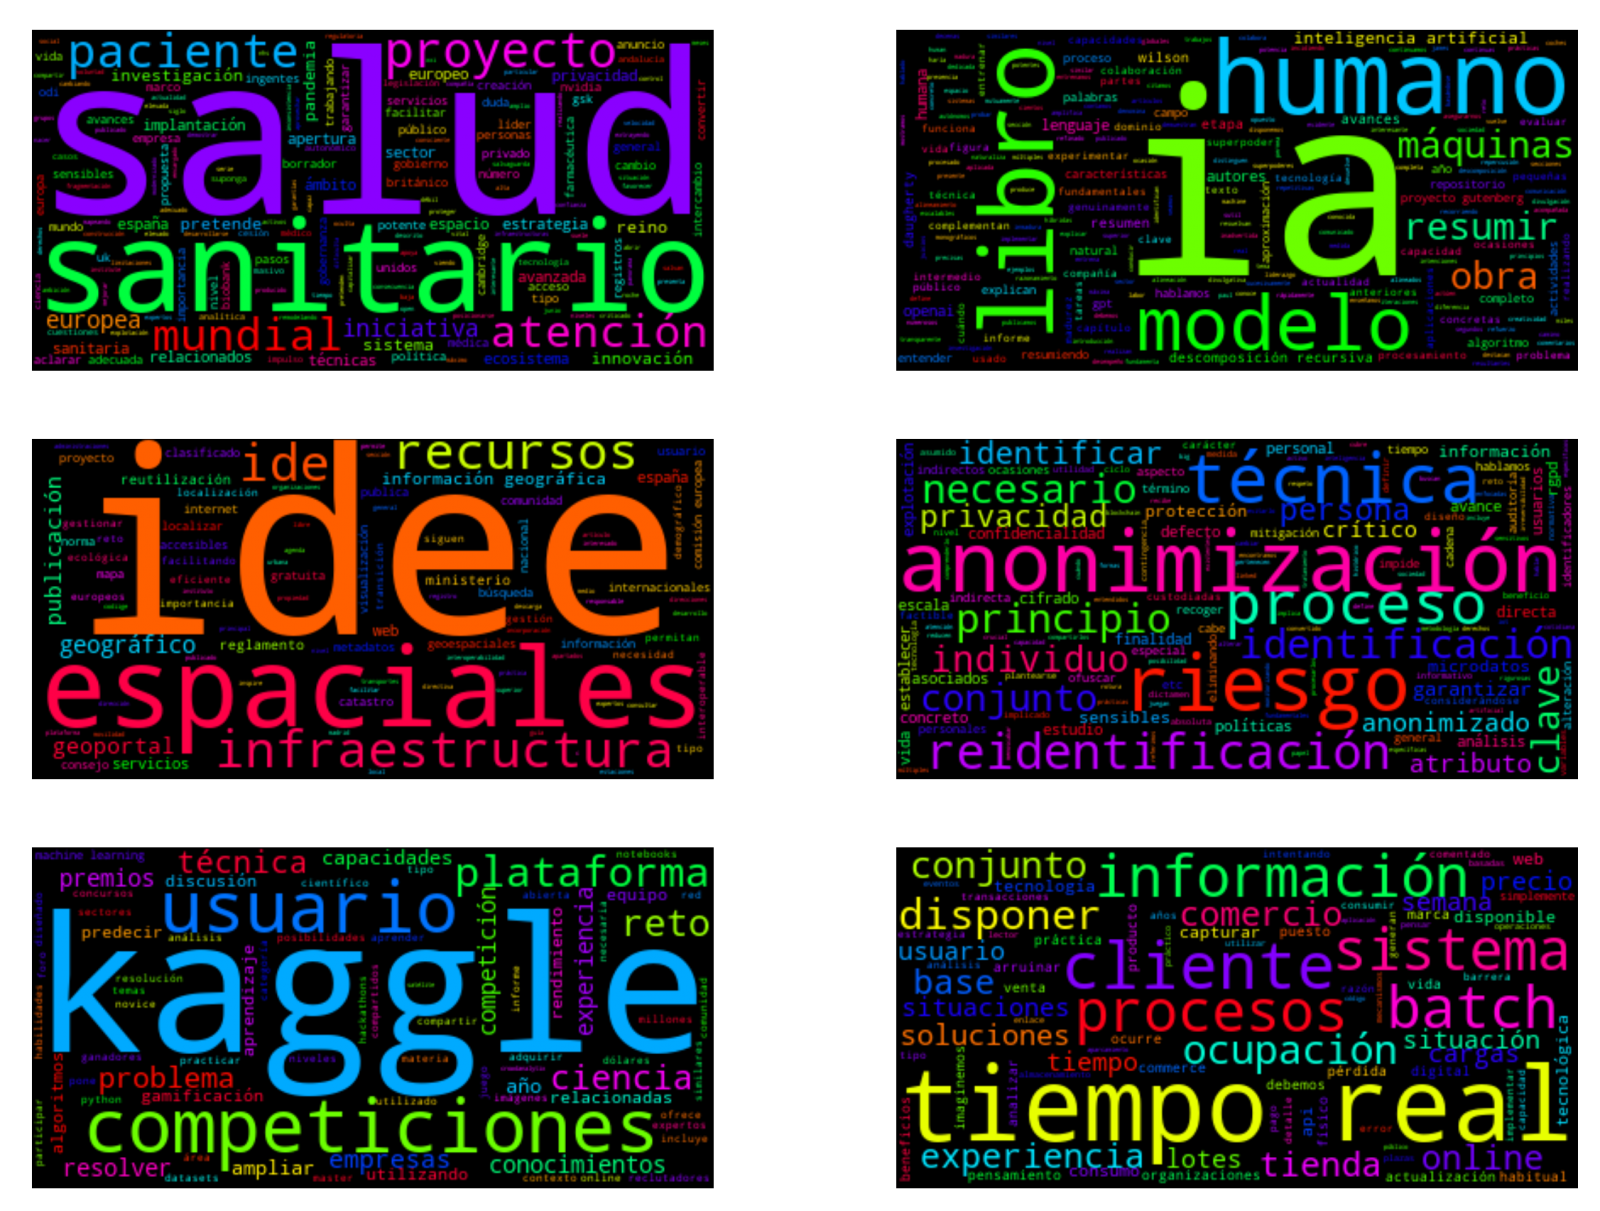
Visualization of the word clouds obtained from the texts of different posts of the blog section of datos.gob.es
5. Conclusions
Data visualization is one of the most powerful mechanisms for exploiting and analyzing the implicit meaning of data, regardless of the data type and the degree of technological knowledge of the user. Visualizations allow us to extract meaning out of the data and create narratives based on graphical representation.
Word clouds are a tool that allows us to speed up the analysis of textual data, since through them we can quickly and easily identify and interpret the words with the greatest relevance in the analyzed text, which gives us an idea of the subject.
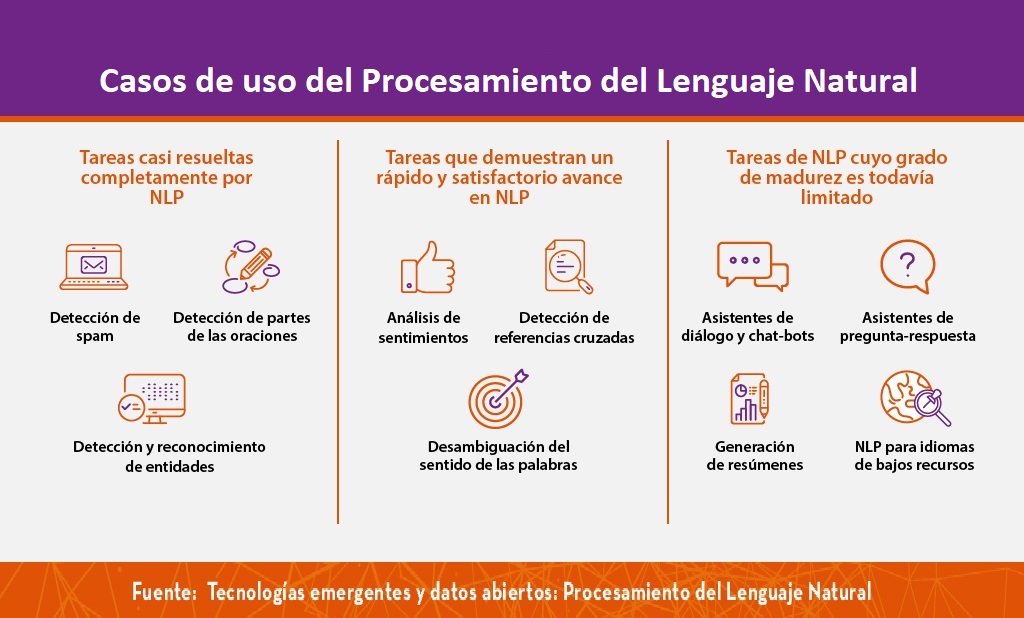
If you want to learn more about Natural Language Processing, you can consult the guide "Emerging Technologies and Open Data: Natural Language Processing" and the posts "Natural Language Processing" and " The latest news in natural language processing: summaries of classic works in just a few hundred words".
Hopefully this step-by-step visualization has taught you a few things about the ins and outs of Natural Language Processing and word cloud creation. We will return to show you new data reuses. See you soon!