Evento
On November 9, Valencia will host the DataBeersVLC no29 event, jointly organized by the DataBeersVLC collective and the Open Government area of the Valencia City Council, which can also be followed live on the Internet. The program includes four talks on data, three of which will focus on open data.
DataBeers is a non-profit initiative that is present all over the world. This organization aims to create a worldwide community of data lovers and for this purpose organizes events open to the general public, where they share the most advanced results and methods in Data Science in an understandable way in an informal environment. DataBeers was born in Madrid in 2014 but has already spread around the world and is currently present in 25 cities in different countries.
In Spain it has presence in Madrid, Barcelona, Málaga o Valencia, among other locations. In the latter, the DataBeersVLC community that was born in 2016, organizes the fourth edition of AI & Dataviz on November 9 at 19:00h at the Centro de Cultura Contemporánea Octubre. In line with its goal of bringing data closer to all types of audiences, the meeting will be streamed live through its Youtube channel. In addition, all talks will be recorded and can be viewed later through the same medium.
Open data in the fight against climate change, the improvement of tourism and agriculture
The day's program includes four talks. As usual in DataBeers events, the talks will be short, around ten minutes, in a language that can be understood by all kinds of audiences. The relaxed atmosphere created and the didactic tone of the speakers make it possible to bring the world of data closer to the attendees.
On this occasion, the first talk will deal with 'Air quality in Valencia' and will be given by Inmaculada Coma, professor of the Department of Computer Science at the University of Valencia and director of the Chair of Artificial Intelligence and Information Visualization of this academic institution.
This talk will present the data from the different monitoring network stations of the city of Valencia that are available in tne open data portal of the City Council and will review the evolution of pollution in the city thanks to the analysis and visualization of this information. This is an example of how open data can help to raise public awareness in a context of climate change and energy transition.
Another of the topics to be addressed at this meeting is tourism, where open data is playing a key role in the sector's transition towards sustainability and digitalization. Laya Targa, data scientist, will present a 'Visualization and optimization of tourist routes in the city of Valencia'. Targa is a member of the Data Interaction and Augmentation Research Group (DINA) and a technician in the ClioViz project at the Institute of Robotics and Information and Communication Technologies (IRTIC) at the University of Valencia. The talk will address some of the innovative data-driven strategies that serve to improve the planning and enjoyment of routes through different monuments in the city. It will explore visualization techniques and demonstrate how routes can be optimized thanks to data and achieve a better experience for tourists that is at the same time respectful of the city and its inhabitants.
Ferran Fernandez will address a talk on data farming, specifically on 'Saving water with predictive irrigation models'. Fernandez, a specialist in AgTech, will start from the fact that agriculture consumes the largest amount of fresh water in the world, with emphasis on the increasingly frequent episodes of extreme droughts. Thus, he will delve into the need to establish strategies that enable more efficient, sustainable and profitable agriculture.
In this area, we cannot forget that the digital transformation is enabling the agricultural sector to modernize and move towards what is known as precision agriculture. In this process, data is a fundamental tool for farmers to know exactly what is happening in their crops and to be able to make more efficient decisions in terms of production and more environmentally sustainable. Water resource management is a key part of this process and this talk will explore in depth the new possibilities that open data offers in this area.
In addition to the applications of open data in different sectors, during the conference Ricard Martínez, director of the Microsoft Chair of Privacy and Digital Transformation at the University of Valencia, will talk about data protection, a topic that usually arouses great interest among citizens. In the era of artificial intelligence that we are beginning, privacy is one of the main concerns and for this, it is necessary to maintain the balance between open access to information and the protection of personal data to ensure the privacy of individuals. The talk will discuss how to protect them from the design and traceability, fleeing from radical solutions such as prohibiting the processing of data.
In short, the program of the fourth edition of AI & Dataviz organized by DataBeersVLC will show the use of open data in areas with a direct and very visible impact on society. The dissemination of the use of open data is essential to promote trust in data and digital infrastructures, as well as to raise public awareness of some of the challenges we face today, such as climate change.
To attend the event in person, all you need to do is register here. It is also possible to follow the live webcast by connecting to the DataBeersVLC channel on YouTube.
Blog
As in other industries, digital transformation is helping to change the way the agriculture and forestry sector operates. Combining technologies such as geolocation or artificial intelligence and using open datasets to develop new precision tools is transforming agriculture into an increasingly technological and analytical activity.
Along these lines, the administrations are also making progress to improve management and decision-making in the face of the challenges we are facing. Thus, the Ministry of Agriculture, Fisheries and Food and the Ministry for Ecological Transition and the Demographic Challenge have designed two digital tools that use open data: Fruktia (crop forecasting related to fruit trees) and Arbaria (fire management), respectively.
Predicting harvests to better manage crises
Fruktia is a predictive tool developed by the Ministry of Agriculture to foresee oversupply situations in the stone fruit and citrus fruit sector before the traditional systems of knowledge of forecasts or gauges. After the price crises suffered in 2017 in stone fruit and in 2019 in citrus fruit due to a supervening oversupply, it became clear that decision-making to manage these crises based on traditional forecasting systems came too late and that it was necessary to anticipate in order to adopt more effective measures by the administration and even by the sector itself that would prevent prices from falling.
In response to this critical situation, the Ministry of Agriculture decided to develop a tool capable of predicting harvests based on weather and production data from previous years. This tool would be used internally by the Ministry and its analysis would be seen at the working tables with the sector, but would not be public under any circumstances, thus avoiding its possible influence on the markets in a way that could not be controlled.
Fruktia exists thanks to the fact that the Ministry has managed to combine information from two main sources: open data and the knowledge of sector experts. These data sources are collected by Artificial Intelligence which, using Machine Learning and Deep Learning technology, analyses the information to make specific forecasts.
The open datasets used come from:
- Information from weather stations of the Spanish Meteorological Agency (AEMET).
- Information from agro-climatic stations.
With the above data and statistical data from crop estimates of past campaigns (Production Advances and Yearbooks of the Ministry of Agriculture, Fisheries and Food) together with sector-specific information, Fruktia makes two types of crop predictions: at regional level (province model) and at farm level (enclosure model).
The provincial model is used to make predictions at provincial level (as its name suggests) and to analyse the results of previous harvests in order to:
- Anticipate excess production.
- Anticipate crises in the sector, improving decision-making to manage them.
- Study the evolution of each product by province.
This model, although already developed, continues to be improved to achieve the best adaptation to reality regardless of the weather conditions.
On the other hand, the model of enclosures (still under development) aims to:
- Production forecasts with a greater level of detail and for more products (for example, it will be possible to know production forecasts for stone fruit crops such as paraguayo or platerina for which we currently do not have information from statistical sources yet).
- Knowing how crops are affected by specific weather phenomena in different regions.
The model of enclosures is still being designed, and when it is fully operational it will also contribute to:
- Improve marketing planning.
- Anticipate excess production at a more local level or for a specific type of product.
- Predict crises before they occur in order to anticipate their effects and avoid a situation of falling prices.
- Locate areas or precincts with problems in specific campaigns.
In other words, the ultimate aim of Fruktia is to achieve the simulation of different types of scenarios that serve to anticipate the problems of each harvest long before they occur in order to adopt the appropriate decisions from the administrations.
Arbaria: data science to prevent forest fires
A year before the birth of Fruktia, in 2019, the Ministry of Agriculture, Fisheries and Food designed a digital tool for the prediction of forest fires which, in turn, is coordinated from the forestry point of view by the Ministry for Ecological Transition and the Demographic Challenge.
Under the name of Arbaria, this initiative of the Executive seeks to analyse and predict the risk of fires occurring in specific temporal and territorial areas of the Spanish territory. In particular, thanks to the analysis of the data used, it is able to analyse the socio-economic influence on the occurrence of forest fires at the municipal level and anticipate the risk of fire in the summer season at the provincial level, thus improving access to the resources needed to tackle it.
The tool uses historical data from open information sources such as the AEMET or the INE, and the records of the General Forest Fire Statistics (EGIF). To do so, Artificial Intelligence techniques related to Deep and Machine Learning are used, as well as Amazon Web Services cloud technology.
However, the level of precision offered by a tool such as Arbaria is not only due to the technology with which it has been designed, but also to the quality of the open data selected.
Considering the demographic reality of each municipality as another variable to be taken into account is important when determining fire risk. In other words, knowing the number of companies based in a locality, the economic activity carried out there, the number of inhabitants registered or the number of agricultural or livestock farms present is relevant to be able to anticipate the risk and create preventive campaigns aimed at specific sectors.
In addition, the historical data on forest fires gathered in the General Forest Fire Statistics is one of the most complete in the world. There is a general register of fires since 1968 and another particularly exhaustive one from the 1990s to the present day, which includes data such as the location and characteristics of the surface of the fire, means used to extinguish it, extinguishing time, causes of the fire or damage to the area, among others.
Initiatives such as Fruktia or Arbaria serve to demonstrate the economic and social potential that can be extracted from open datasets. Being able to predict, for example, the amount of peaches that fruit trees in a municipality in Almeria will yield helps not only to plan job creation in an area, but also to ensure that sales and consumption in an area remain stable.
Likewise, being able to predict the risk of fires provides the tools for better fire prevention and extinction planning.
Content written by the datos.gob.es team
Noticia
We are currently in a context of digital transformation in which all sectors are in a process of adaptation with the aim of responding to the needs for improvement, agility and efficiency that society demands. One of the fields in which this change is most evident is the rural environment.
In the specific case of Spain, the change of paradigm is more than necessary due to aspects such as climate change or the depopulation of rural areas. The digital transformation of primary activities such as agriculture or livestock farming can contribute to solving these challenges, by attracting new professional profiles to areas with lower population density, and contribute to more efficient and sustainable crops.
Open data play an important role in solving these challenges through digital transformation, as the raw material for technological solutions that help to make better, more sustainable decisions. For this reason, we would like to tell you about the main rural environment datasets that you can find in our catalogue and reuse to implement applications and services that promote improvements in this sector.
What types of data related to the rural environment can I find in datos.gob.es?
In datos.gob.es we have a wide catalogue of data related to different sectors such as Tourism, Environment, Culture and Leisure, Economy, Transport, Health or Industry. The Rural Environment category includes different data catalogues related to Agriculture, Livestock, Fisheries and Forestry.
Currently, this category has more than 1,000 outstanding datasets. Among these datasets we can find national, as well as local and regional information. In this article, we have already talked about the datasets that the Ministry of Agriculture, Fisheries and Food made available to citizens, but there are many more in this category. Along with the ministries, the institutions that most publish this type of dataset are the Autonomous Community of the Basque Country, the Government of Catalonia and the National Institute of Statistics (INE).
Of these datasets, the following are the most important, together with the format in which they are offered:
-
At state level
- CIS. Spanish rural youth. XML, CSV, Json.
- Official INSPIRE Data and Services Catalog. Beach guide. MDB, KMZ, SHP, ASCII, XHTML.
- INE. Distribution of certified organic farming area qualified and or in conversion period. CSV, XLSx, XLS, Html, Json, PC-axis.
-
At Autonomous Community level
- Government of Catalonia. Agro-food industries in Catalonia. CSV, JSON, XML-APP, RDF-XML.
- Castilla y León Government. Agricultural statistics (Castilla y León). CSV.
- Government of Aragon. Agricultural regions of Aragon. CSV, XML-APP, JSON.
- Basque Government. Rural women in the Basque Autonomous Community by professional situation according to age group (%). CSV, XLS.
- Autonomous Community of Castilla-La Mancha. Agricultural training courses. XLSX, PDF.
-
A the local level
- Island Council of La Palma. Zoning and uses of the island of La Palma. HTML, CSV, JSON, GeoJSON, KML, SHP.
- Barcelona Provincial Council. Decline of the forest mass of the Maresme forests. PDF, ZIP, HTML.
- Vitoria-Gasteiz City Council. Risk of forest fires.PDF, OCTET-STREAM.
- Zaragoza City Council. Zaragoza City Hall Clean Points. GeoRSS.
The re-use of data from the agri-food, forestry and rural sectors
The reusable power of all these data sets is very valuable. They can be used to create valuable tools and services. Take the example of the Agricultural Plot Geographic Information System, SIGPAC, which "makes it possible to identify geographically the plots declared by farmers and stockbreeders, in any aid scheme related to the area cultivated or used by the livestock". This viewer was created to make it easier for farmers to submit aid applications and to monitor them. However, it should be noted that SIGPAC has also been used to develop applications and services that improve crop efficiency, such as Campogest or Cropti. Many of these applications also incorporate the data from the Register of Fertiliser Products, such as cultivAPP, which allows farmers to control the phytosanitary treatments applied in an easier way, from their own mobile device.
We can also find applications related to the forestry field, such as förecast, a tool that provides real-time data on forest stocks and allows for spatial-temporal analysis based on remote sensors and artificial intelligence. Or with a marked social character such as Plan Repuebla, a project that seeks to reactivate the rural areas of Castile and Leon.
You can see more examples of the reuse of agricultural data in the finalists of the 2019 Challenge, in our applications section or in this report.
From datos.gob.es we invite you to visit our data catalogue and discover all the datasets we have collected in the different sections.
Noticia
Last December the European Data Portal published a new report entitled Analytical Report 14: Enabling Smart Rural: The Open Data Gap, which examines the collection, availability and use of open data in rural areas.
27% of the citizens of the European Union live in rural areas where it is not easy to implement the same processes, technologies and activities that are driving the cities transformation. In a European context where smart cities are being promoting, the report focuses on the differences and synergies between rural and urban areas in terms of opening and reusing open data. To this end, the available resources have been analysed and 6 respondents have been interviewed: 3 experts from national portals in rural countries (Ireland, Romania and Slovenia) and 3 experts in agriculture, fisheries and the forestry sector.
Availability and reuse of rural data
The first part of the report focuses on knowing the availability of rural data, focusing on two categories of data:
- Rural population data: data relating to people living and working in rural areas, such as the availability of housing, connectivity, access to transport, demographic profile, employment levels or public services access, among others.
- Rural sectors data: Data related to the main sectors of the rural economy, that is, agriculture, fisheries and the forestry sector.
The conclusion reached by the report is that there is more open data from the second category (rural sectors), than from the first (rural population). Specifically, almost 14% (13.75%) of all EDP data sets are agricultural data.
Many of the challenges that public agencies face when opening data in rural areas are the same challenges they face in cities, such as lack of awareness or standardization. However, other aspects such as the digital gap or technological capabilities gaps (worse broadband connection, fewer devices ...) also influence
With regard to reuse, the report highlights the great potential of rural open data to generate economic and social benefits through several examples and success stories, such as increasing transparency in the agricultural products market. As before, the reuse of data related to rural sectors is higher than the reuse of data related to the rural population.
The report also highlights that the majority of rural data reuser and companies are located in urban areas, where awareness of the benefits of this type of data and its possible uses is higher.
Recommendations to boost the opening and reuse of rural data
The report ends with a series of recommendations for member state governments to promote the publication and use of data at the rural level. These recommendations are structured around 3 areas:
- Data collection
- It is necessary to establish and institutionalize open data processes and practices in rural administrations, with close relationships to urban open data groups
- The report recommends paying attention to high-value agricultural datasets, because there is currently a a gap between their agricultural percentage of GDP and their open agricultural datasets.
- Data opening
- Collaboration links must be established with complementary data owners, such as non-profit organizations, researchers or private organizations, that allow data to be opened and made available together.
- The report highlights the term Smart regions, covering both smart cities and nearby rural areas, to generate synergies, and recommends investing in understanding the key factors of smart regions that mean they are more fit for purpose.
- Data reuse
- It is necessary to establish links with urban areas, through instruments such as study centres or universities.
- Finally, the report recommends to identify the rural-specific challenges, such as out-migration, health solutions that address distance, and food provenance.
The report concludes by highlighting the need to institutionalize the commitment to open data and foster the skills necessary for the publication and use of open data on both the population and the rural sectors, so that they are not involuntarily excluded from the benefits of data economy.
Noticia
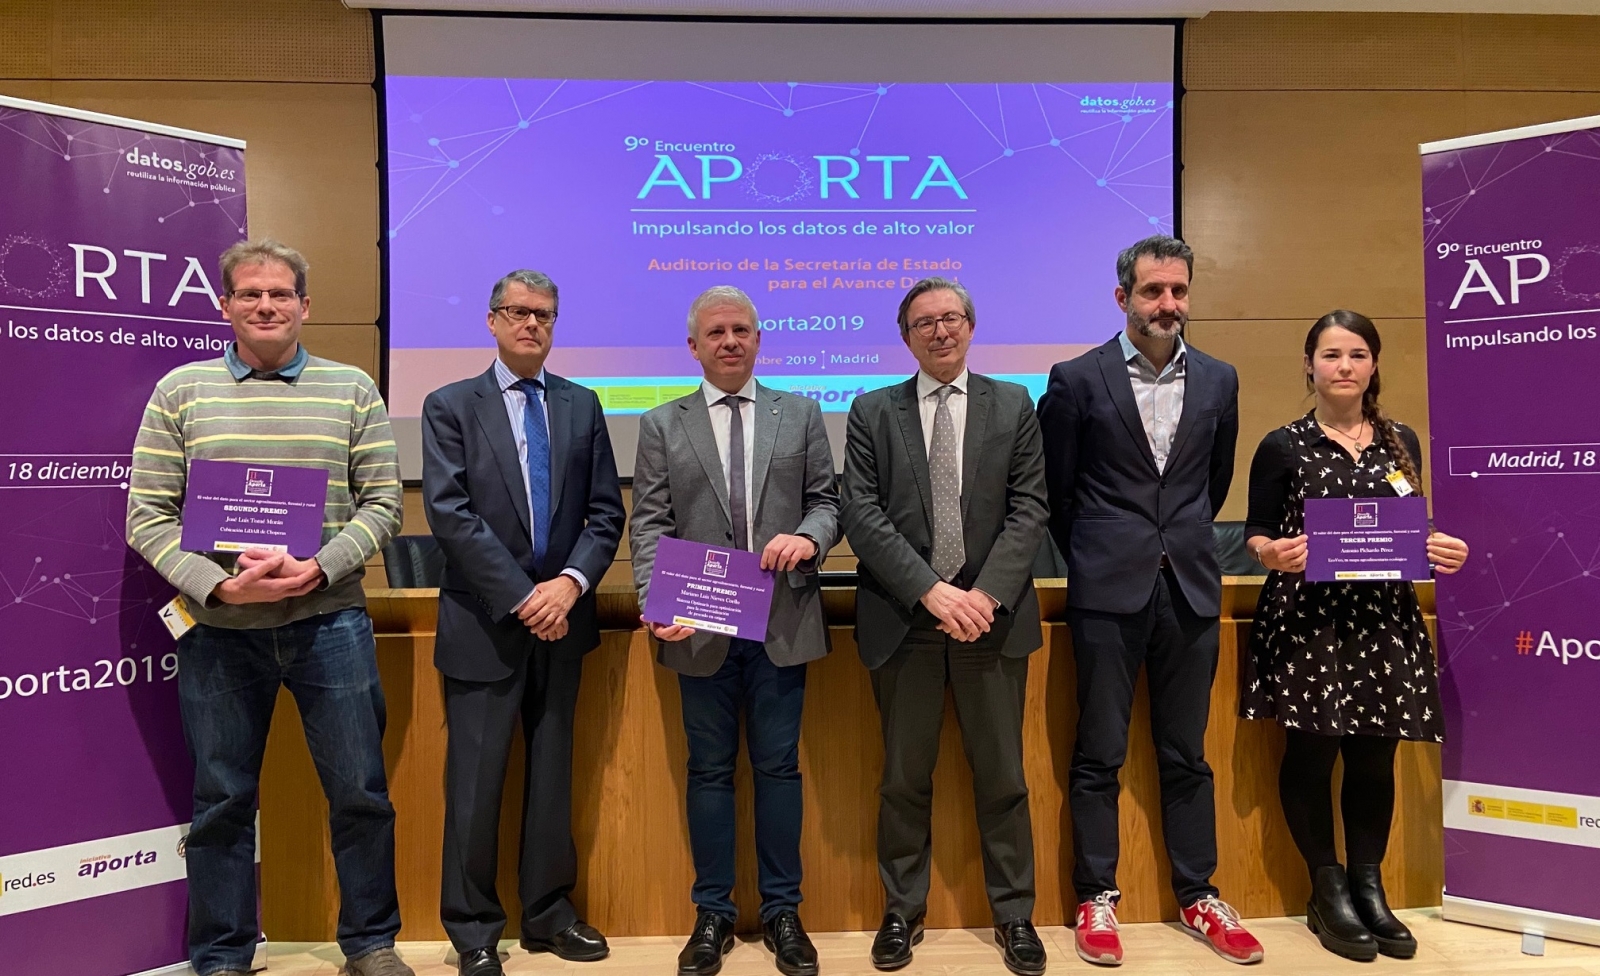
The Aporta Challenge 2019 has come to an end. On December 17, the 10 finalists, chosen among the 40 ideas submitted in May, showed the jury the prototypes they have been preparing for the last months.
After a difficult deliberation, due to the high quality of the works presented, the jury selected the three winners based on three criteria: ease of use, technical quality of the prototype and viability of the solution.
First place went to Optimacis, a solution that offers an objective assessment of the prices of the fish caught. Through machine learning technologies, Optimacis predicts the demand for fish in each fish market. In this way, fishermen can make real-time decisions about the species to be captured, rationalizing the fishing grounds and improving their sustainability. This information is also useful to fishermen for redirecting their sale to the most profitable markets based on auction prices for the species they have just caught.
Optimacis adds currently dispersed raw data, which comes mainly from 3 sources: the characteristics of the fleet which operates in the fishing grounds, the meteorological factor in the geographical area of the fishing grounds and other socio-demographic factors associated with consumers. The service has been devised by Mariano Luis Nieves, who presented the project to the jury.

Mariano Luis Nieves, presenting Optimacis
The second place went to ChoperApp, a web platform to estimate the volume of poplars at a local scale in La Rioja, but which can be exported to other regions of the Ebro and the Duero Basin.
Choperas have a fundamental economic role in rural areas of Spain. Specifically, in La Rioja, they represent more than 50% of the value of the wood that is sold every year, despite representing 1.5% of the forest area. Using data from the LIDARA PNOA of the National Geographic Institute and Copernicus, Chopperapp quantifies forest resources in real time. It is an idea of Agresta Coop that was explained by Jose Luis Tomé.
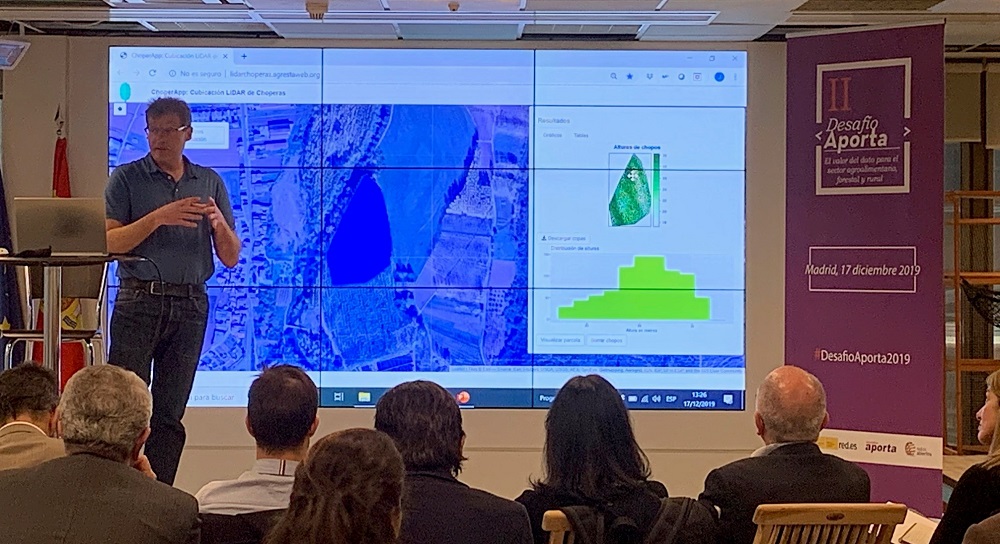
Jose Luis Tomé, showing the functionalities of Chopperapp
The third place went to Ecoveo, an open license website that shows on a map more than 36,000 ecological agri-food operators. Its objective is to standardize the available data of said producers to promote transparency in the sector and facilitate contact between consumers, producers and companies, facilitating the purchase of proximity products.
Ecoveo uses information from the certifiers themselves authorized by each Autonomous Community, and datasets such as the Registry of organic food producers in Castilla La Mancha, or different datasets from the Ministry of Agriculture, Fisheries, Food and Environment. Ana María Bello defended the idea, developed in collaboration with Antonio Pichardo.
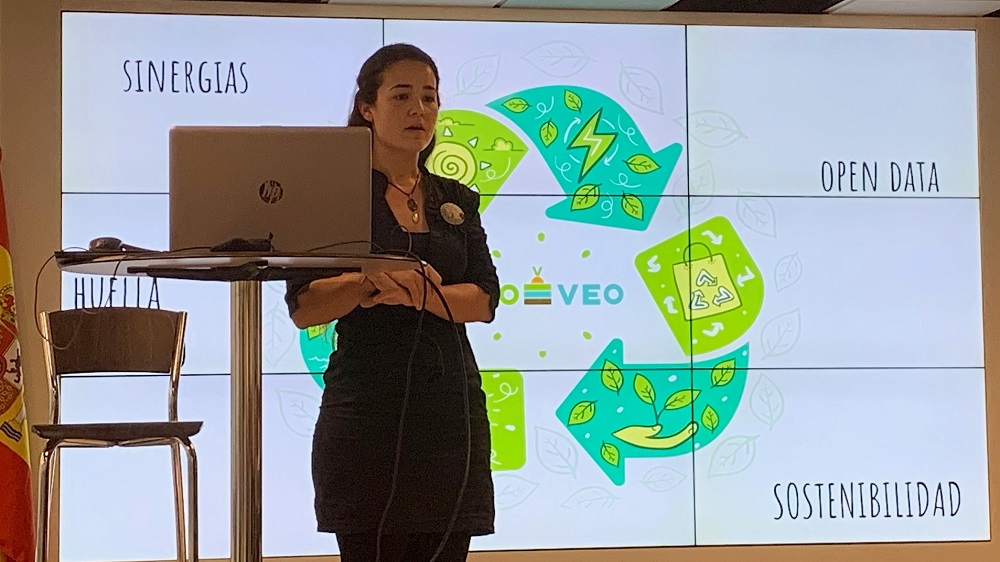
Ana María Bello, explaining what Ecoveo is
The three winners will receive 4,000, 3,000 and 2,000 euros respectively. You can learn more about these 3 projects in social media by following the hashtag #optimacis, #Chopperapp and #MapaEcoveo; and discover the rest of the finalist projects in this link.
Congratulations to the 3 winners and all the participants for the great work done during the whole Aporta Challenge 2019!
Blog
The data generated by the agroclimatic stations maintained by the different public administrations and integrated into the Agroclimatic Information System for Irrigation (SiAR) generate valuable open data sets for the agricultural sector. These data, combined with other open data sets, such as weather forecasts, or private data sets, such as the amount of plots irrigation, have important applications in the sector: from the calculation of crop irrigation needs to the choice of the appropriate moment to applicate phytosanitary products.
What is the Agroclimatic Information System for Irrigation (SiAR)?
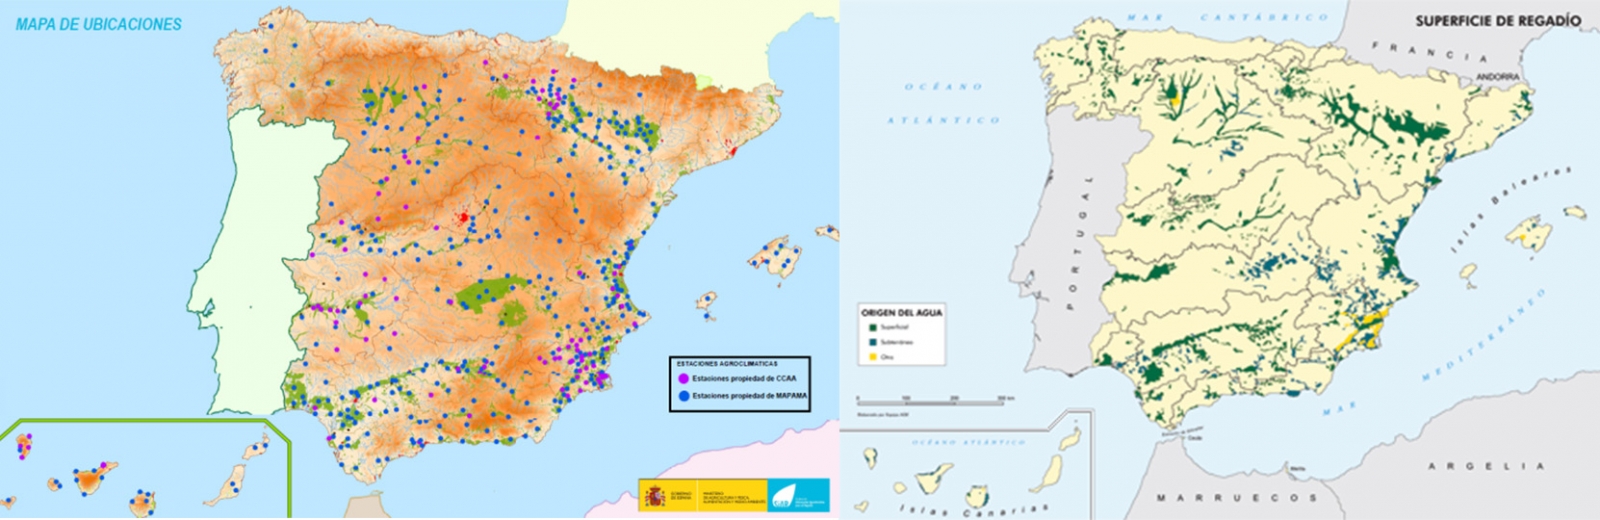
The SiAR network was founded in 1998 with the initial objective of promoting energy and water savings. It has more than 460 stations (Ministry`s stations plus CCAA´s stations), located on irrigated areas of 12 autonomous communities. It is a collaborative network that combines stations of the Ministry and autonomous communities, which also provide direct contact with the irrigator, the end user of the system information.
The Ministry of Agriculture, Fisheries and Food, through the Subdirectorate General for Irrigation and Rural Infrastructure, makes available all the information collected through the entire Network of agro-climatic stations of the SiAR to users for free. All data on the SiAR network is available through the website www.siar.es.
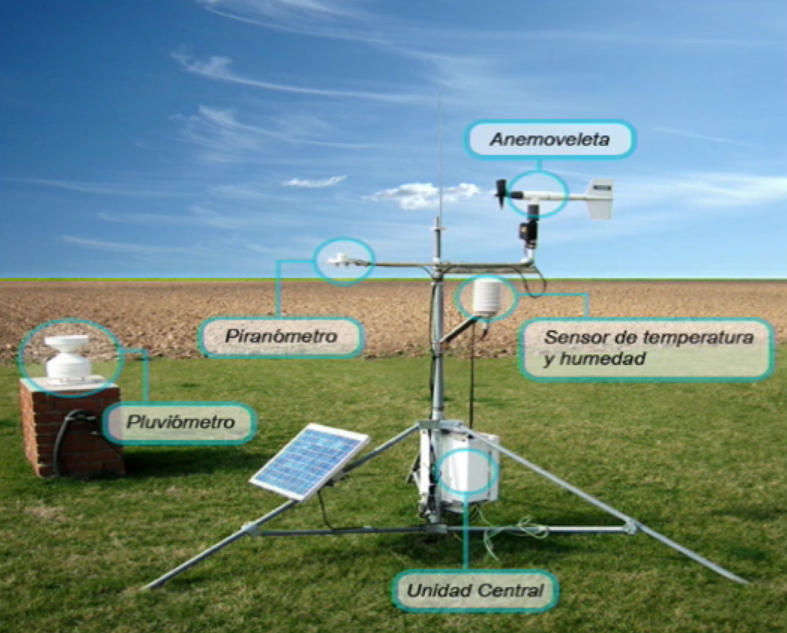
Agroclimatic stations are installed in the irrigable areas, with one station for every 5,000 - 10,000 Ha of irrigation, which implies a coverage of 90% of the irrigable area of Spain.
Each station consists of an anemoveleta to measure wind speed and direction, a pyranometer to measure global solar radiation values, a rain gauge that measures rainfall and a temperature and humidity sensor. The station is completed with a central unit that contains the storage and communications devices, necessary to send the data to the central information system automatically with a periodicity of half an hour.
How are the data provided by SiAR?
The data collected by the stations has a high quality, largely due to the exhaustive preventive and corrective maintenance performed on the stations. In addition, all station sensors are periodically taken to the laboratory for calibration.
The stations record temperature and humidity values every 10 minutes and radiation, precipitation and wind speed and direction every 10 seconds, generating average hourly and daily records. The data are provided to users in the form of daily, weekly and monthly records for unregistered and registered users, in addition to the hourly average records.
Can you download the data?
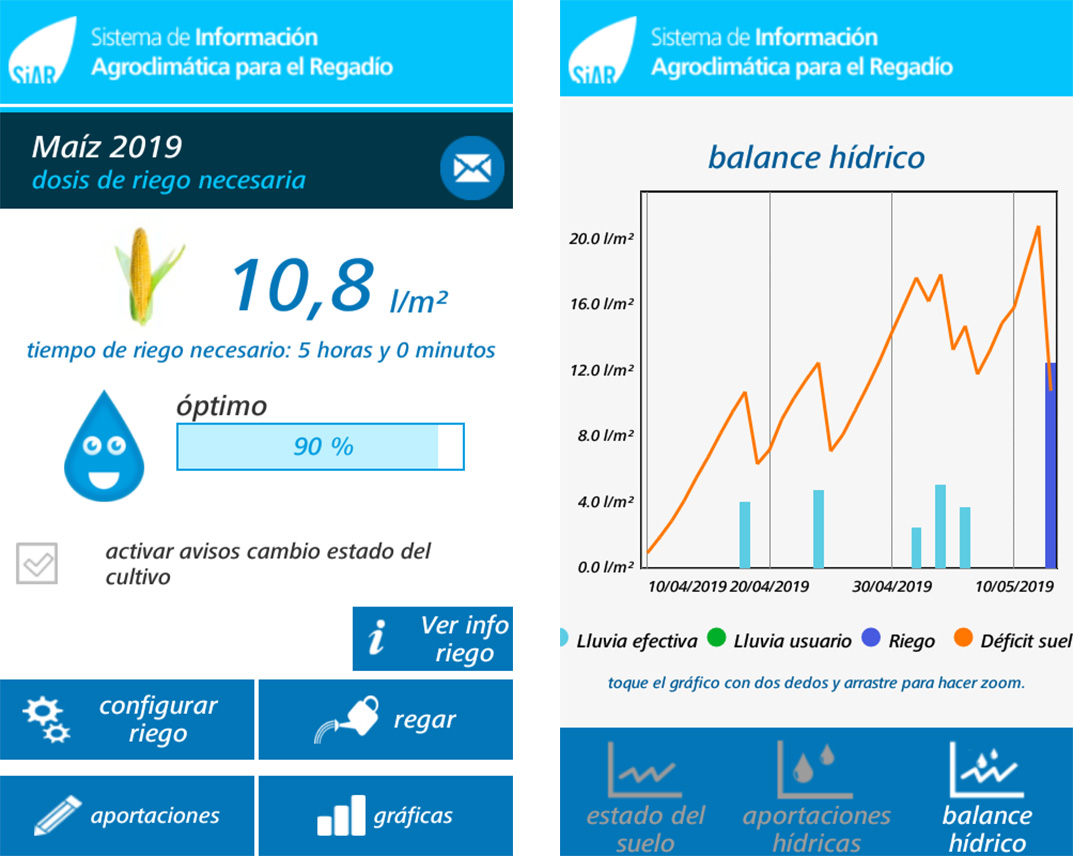
The SiAR website allows the consultation and download of meteorological data with an hourly, daily, weekly or monthly average frequency from one or several stations. In addition to the data query, the user can obtain an estimation of the net needs of the crops, taking into account only the climatic conditions and the type of crop, calculated from the data of the selected station.
The website also allows registered users to create, save and manage data queries and downloads that they can receive automatically, Users can customize them within their private space “My SiAR”.
The data can have multiple purposes of use and are not only used by agricultural professionals. As an example, this video of the Department of Rural and Agrifood Engineering of the Polytechnic University of Valencia shows how SiAR data are used to prove how the calculation of a crop net needs is performed within the design of an irrigation system for a farm.
In addition to these uses, the data can be used by companies that create new products and services from the SiAR data.
The SiAR app
In addition to the website, the Ministry has the application for mobile devices SiAR app, which allows the management of irrigation programming by calculating the water needs of 104 different crops. The application uses as reference evapotranspiration values those calculated from the data supplied by the closest SiAR station.
SiAR app aims to become a useful tool at the service of the farmer, which helps to optimize the use of water in irrigation, thus promoting its economic, social and environmental sustainability.
Content prepared by Jose Luis Marín, Head of Corporate Technology Strategy en MADISON MK and Euroalert CEO.
Contents and points of view expressed in this publication are the exclusive responsibility of its author.
Blog
Geospatial data is one of the data categories most demanded by organizations, companies and citizens. The new European regulation on open data and reuse of public sector information considers them as high-value data, due to its ability to boost innovative services and generate socio-economic benefits in multiple sectors of activity.
When we talk about geospatial data, one of the main sources of data that comes to mind is COPERNICUS, the Earth observation program of the European Union.This program is led by the European Commission, with the collaboration of member states and various European agencies and organizations, such as the European Space Agency (ESA) and the European Environment Agency (EEA).
What is the Copernicus program?
Under the slogan “Europe's eye on Earth for the ultimate benefit of European citizens”, Copernicus collects, stores, combines and analyzes data obtained through two sources:
- Data obtained from satellite observation, through the constellations of Sentinel satellites and other third-party satellites.
- Data obtained by land, air and maritime in-siue sensor systems.
These data are organized through 6 servicesthat facilitate access to data and information: emergency, security, marine, land, climate change and atmosphere.

Based on these services, Copernicus has become the largest geospatial data provider in the world, with a current production of twelve terabytes per day. Most of these data - with the exception of those that may compromise citizen security - are provided free of charge and full through the DIAS services (cloud platforms that provide centralized access to Copernicus data and information) or through conventional data platforms.
This information is essential for decision-making in the new electronic government and digital economy systems, covering areas such as management and monitoring of sustainability, climate change and environment, transport, urban agenda and smart cities, security, emergency and catastrophe management, agriculture, energy and natural resources or blue economy, among many others. These data can also be combined with the data obtained through the GALILEO program,the European radionavigation and satellite positioning system. In this way, new opportunities for the public and private sector can be generated, while working towards the achievement of sustainable development goals.
The role of the Ministry of Development in the Copernicus Program
The Ministry of Development participates in the European Earth Observation Program COPERNICUS,as a national representative in various committees and forums, in addition to actively contributing to the provision of free and open data and services. Among others, it collaborates with the territory and marine services, through the D.G. of the National Geographic Institute (IGN) and State Ports.
Specifically, the IGN Territory Observation Unit exercises national representation, together with the Ministry for Ecological Transition (MITECO), in the Copernicus User Forum, for the monitoring and evolution of the program according to user requirements. The User Forum is the working group created to assist the Copernicus Committee to determine user requirements, verify service compliance and coordinate users in public sector. In turn, the Copernicus Committee in Spain is constituted by the Ministry of Industry, Commerce and Tourism and the Centre for Technological and Industrial Development (CDTI).
The IGN is also responsible for the national coordination of the Copernicus (Land) Service and the In Situ; Component; leads the European group of experts Copernicus In Situ EIONET Expert Group; and participates in the Copernicus Coordination Action Framework Program as a National Land Use Reference Center for the 2017-2021 period and the Copernicus User uPtake Framework Program (FP-CUP): 2018/2020.
In addition, it collaborates in the dissemination activities of the Copernicus Program in our country, such as Copernicus Relay and Academy.
Copernicus Relay y Academy
One of the purposes of the Copernicus program is to boost the economic opportunities of geospatial data. Through awards, hackathons, accelerators, e incubators, Copernicus want to help companies develop innovative ideas based on the reuse of the data they provide.
In addition, a set of networks called Copernicus Relay and Academy. were created in the first quarter of 2017to ensure some of the needs that the Copernicus program requires.
- Copernicus Relay
The Copernicus Relay are a group of organizations that coordinate and promote activities around the Copernicus program for local users and administrations in the field of Territory Observation. Its objective is to make known in Europe and outside Europe that Copernicus is a sustainable source of full, free and open information that meets the needs of national, regional and local public services, and that can function as a reinforcement for the development of services.
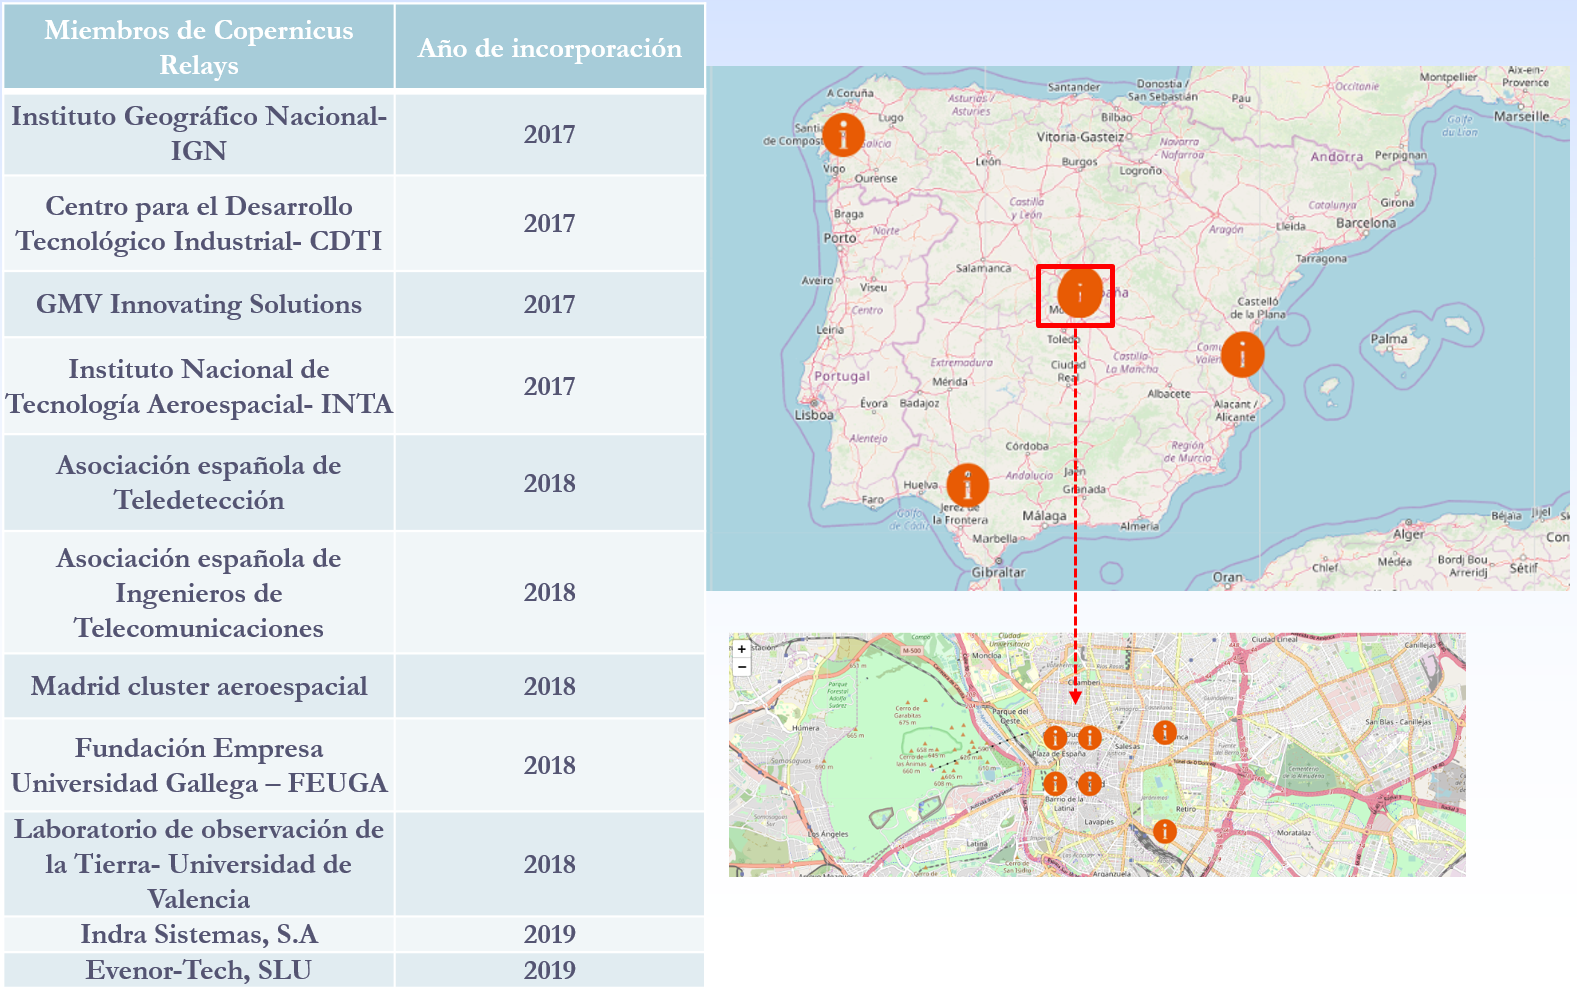
There are currently a total of 85 European Relay members of which 11 are Spanish. The IGN has been a member of Copernicus Relay since 2017.
The possible actions that can be developed by Copernicus Relay members are, among others:
- Coordinate activities at the local level
- Distribute Copernicus dissemination material.
- Inform about what Copernicus is and answer user questions.
- Perform and promote events to publicize Copernicus.
- Organize courses
Any organization that is well connected with user communities, such as private companies, research centers, universities and end users of the public or private sector, can participate. To be a member of Copernicus Relay it is necessary to make a request on this website.
- Copernicus Academy
The Copernicus Academy connect European universities, research institutions, business schools and private organizations of the countries participating in the program and beyond. The objective of the network is to link academic and research institutions with authorities and service providers, facilitating collaborative research and the development of conferences, training sessions and internships. It also provides educational and training material for researchers, scientists and entrepreneurs.
Copernicus Academy also works to increase ideas and good practices sharing across borders and disciplines, while contributing to the development of the use of Earth Observation data in general and Copernicus data and information in particular, in various organizations or industries of public or private users.
There are currently a total of 17 Academy members in Spain.
In short, through these and other initiatives it is expected that an increasing number of users will know the Copernicus program and boost the economic and social opportunities that it entails. Thanks to the accurate, up-to-date and easy-to-access information of the Copernicus program, we will be able to know our environment better, and make decisions that guarantee the future of all European and other regions citizens.
Content prepared based on information by Nuria Valcárcel, Deputy Assistant Director, D.G. National Geographic Institute. Ministry of development.
Blog
In many areas, there is a false belief that the primary sector is a technologically backward sector that is not involved in digitization. Perhaps because throughout history, as economic development indicators progressed, their weight in GDP and employment rates has been decreasing in favor of other sectors.
However, the agricultural sector is once again gaining prominence, as it currently faces a set of challenges that are closely related to the future of humanity. Climate change, food security and population growth are just some of the most challenging. The European Commission itself, through the Horizon 2020 program, is allocating important research resources to the social challenge of food security, sustainable agriculture, marine and maritime research, and bioeconomy.
As in other industries, digital transformation is helping to change the operating bases of the agricultural sector, giving rise to what is already known as smart agriculture or precision agriculture, which is also a very important part of the solution to the mentioned challenges.
The agricultural sector is increasingly combining technologies, such as geolocation, soil and environmental conditions monitoring, artificial intelligence, cloud computing and Internet of Things (IoT), to accurately measure the variations of numerous variables in the crop fields and thus improve the quantity and quality of agricultural products.
As in many other industries, the base of digital transformation is data: open, private or enriched with each other, with data science in a leading role. Data science helps farmers see and understand what is happening in their fields with unprecedented precision, allowing them to make much more sustainable decisions to get an efficient production.
From seeds genetics to environmental conditions -and not only weather, but also any issue that affects agricultural production- can be measured and analyzed in order to make sustainable decisions.
Since we know that small variations in the quantities of materials selectively used at specific times and places can generate huge differences in crop yields, farmers can use data science to decide the right amount of seeds that should be planted in a field or the amount of water, fertilizers or pesticides needed to maximize the seeds yield and minimize environmental damage.
To be real, these applications need to combine open data with internal data coming from the sensorization of the crop fields or aerial images from drones or satellites.
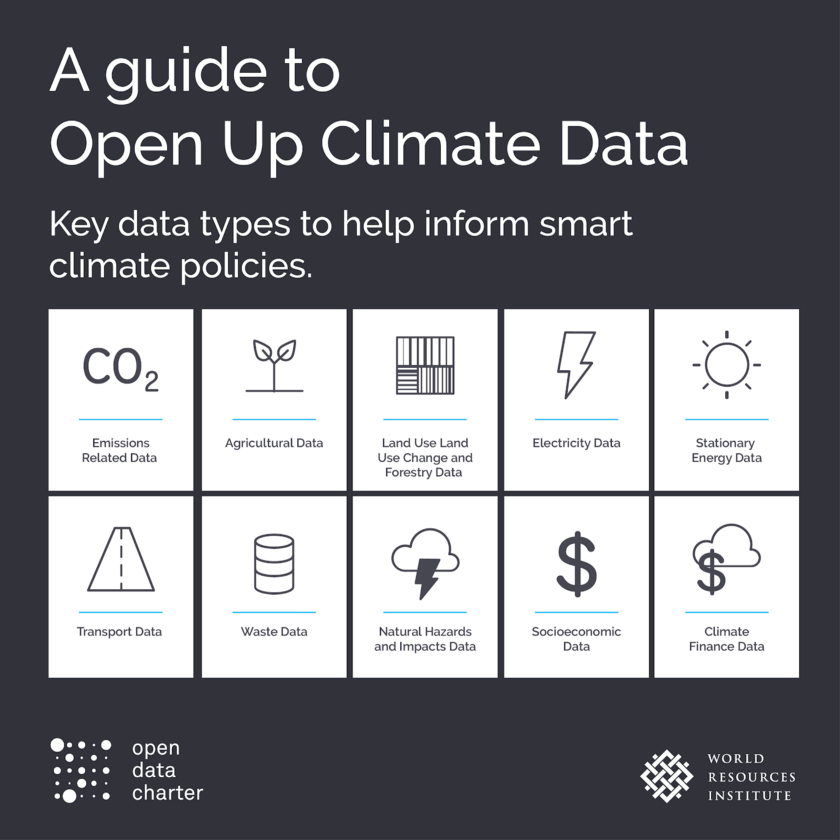
Given the importance of the topic, the Open Data Charter, through the Global Open Data for Agriculture and Nutrition (GODAN) initiative, and as part of the Agriculture Open Data Package (AgPack), has classified the key datasets that public administrations handle and whose opening would have an important impact for the agricultural sector into 14 categories, which are explained in the following figure.
In the figure we find from evident data sets, such as those that contain meteorological, hydrological or geographical data, to others that are useful for multiple sectors besides agriculture, such as imports, exports, prices or quality standards of agricultural products. And of course, data on allowed pesticides, inspections or legislative texts related to one of the most regulated sectors of our economy. GODAN has produced important informative material like this or this webinar about Agpack.
| Main group | Category | Description | Example |
|---|---|---|---|
|
Administration and legislation
data
|
Government, agricultural law and regulations
|
Policy and legislation texts relevantfor the agricultural sector
|
Subsidy schemes; animal health and welfare regulations; import/export regulations; environmental regulations; (phyto) sanitary regulations
|
| Official records |
Lists of organisations, people or products officially registered,permitted or restricted as a resultof legislation
|
Permitted pesticides; (import/export) tariffs; (safety) inspectionresults; approved permits; licensed organisations(corporations, businesses, NGOs); land registration
|
|
|
Government finance data
|
Data on the financial management of the government, budgets, spending
|
Penalties given to agricultural actors; agriculture-related tax income; agricultural subsidy expenditure
|
|
|
Rural development project data
|
Data describing rural development (RD) projects funded by a government. This may be the local government or a donor government (aid)
|
Rural development project documents; rural development project baseline and survey data; rural development project output, outcome and impact; general information on a rural development project
|
|
|
Socio-economic data
|
Land use data and productivity data
|
Data describing the land use, crop types and production of an area or region
|
Biomass; crop yield; cultivated crops and livestock; land use data
|
| Value chain data |
Data describing the value chain and its activities
|
(Food) product data; company profiles of groups of value chain actors or organisations; (food safety) inspection results
|
|
| Infrastructure data |
Data describing national networks for roads, water, ICT, including their condition and maintenance
|
Internet coverage; waterways; road management
schedules; mobile telephone coverage; road network |
|
| Market data |
Data on the location of markets, market prices, market standards
|
Import/export volume; lists of markets and auctions; market prices; global food prices; location of markets; standards, grades, labelling; market management and rules
|
|
|
Natural resources, earth and
environment data
|
Meteorological data
|
Quantitative data on weather and climate
|
Climate change predictions; climate zones; observations
archives; real-time observations; short-term weather forecast |
| Elevation data |
Data describing the elevation of the
terrain and its derivates |
Digital elevation model; height points; slope data;
aspect data
|
|
|
Hydrological data
|
Data describing the state and dynamics of ground and surface water
|
Water management; water tables; water quality; real-time water levels; historical records on flooding; flood zones; water balance; location of water sources
|
|
| Soil data | Data describing soil properties | Soil classes; soil samples; soil maps | |
|
Agronomic data, agricultural technologies
|
Production advice
|
Data related to crop selection, crop and land management
|
Fertilizer recommendations; intercropping, relay cropping and rotations; agronomic practice recommendations; crop calendars; data on cultivars, land races and farmer varieties including new releases
|
|
Pest and disease management data
|
Data on the distribution of pests and diseases and their treatment
|
Occurrences and distribution of plant diseases; treatment of plant diseases; recommended pesticides
|
To interpret this table to design appropriate policies, it is necessary to bear in mind that we are faced with very diverse data sets. In some countries, these data sets are managed by public administrations, while in others they could be in the hands of private initiatives, because agricultural data are not exclusive to public or private organizations.
Like the big companies that operate in different parts of the sector''s value chain, such as John Dere or Monsanto (now Bayer), which have been working for years to create tools to collect and analyze data on farmland and resources, Public administrations also have a possible roadmap to plan their data opening policies in the agricultural sector.
Undoubtedly, the combination of public and private efforts to advance the collection, opening and enrichment of data with impact on the agricultural sector activities will contribute to the development of a greater number of applications that can be used to improve the productivity of the sector, the food security and the environmental sustainability.
Content prepared by Jose Luis Marín, Head of Corporate Technology Startegy en MADISON MK and Euroalert CEO.
Contents and points of view expressed in this publication are the exclusive responsibility of its author.
Blog
The forest industry, as defined by FAO, include all economic activities that mostly depend on the production of goods and services from forests. This is an industry that, in many cases, has been seen as destructive to the environment due to its relationship with the tree felling. However, in almost every country in the world with significant forest resources, it plays an essential role in socio-economic development.
According to the "Diagnosis of the Spanish Forestry Sector", published by the former Ministry of Agriculture, Food and Environment in 2014, Spain is the second EU country in forest area, only behind Sweden. However, the forest industry has a modest weight in Spain GDP (0.63% in 2009). That is, more than half a point below the European average, and below countries with equivalent forest resources. There are interesting studies such as "Characterization of forest industry" published by the BBVA Foundation in 2008 that seek to delve into the analysis of why the forestry industry has not had a higher development rate in Spain despite the size of the forestry ecosystems.
As we all know, we are living a stage of digital transformation in which technology is revolutionizing industries all over the world, from logistics to manufacturing, healthcare or financial sector. Even agriculture is living a great transformation due to a combination of technologies, including artificial intelligence and the enrichment of private and ultralocal data with open data. However, the forestry industry seems to be left behind most of the other industries in this transformation.
Inspired by successes in agriculture, some forest operators have begun to pioneer the use of advanced technologies to improve the results of forest management. This approach is known as precision forestry, clearly connected with the most advanced precision agriculture or smart agriculture.
The precision forestry industry starts to benefit from the application of a series of emerging technologies, such as the laser scanner (LIDAR) or unmanned aerial vehicles (UAV) or drones. We are going to review some of this technologies that, according to some studies, are already beginning to produce productivity improvements of 5 - 25% per year.
- LIDARs, for example, are increasingly used to produce digital land models that allow, through data science techniques, to make estimates of available wood inventories (trees per hectare, tree height or log diameters). A more precise knowledge of the land, the water flows or the forest inventories contributes not only to better management of wood inventory but also to better plan a harvest. For example, analyzing very precise data to make better decisions about the type of machinery needed and its optimal placement to harvest a forest unit. Open data published by public administrations, for example related to the land cartography or the location of water resources, are fundamental to enrich the data captured by these techniques. For example, in Spain, the National Geographic Institute has published LiDAR data related to the entire territory. Some regions such as Castilla y León and Catalonia also provide data in this format. In the same way there are ambitious projects to add LIDAR-format data all around the world, such as Open Topography and Lidar online, although their coverage is still limited.
- Unmanned aerial vehicles are increasingly used in the forestry industry to perform surveillance and mapping tasks when they are equipped with the aforementioned LIDAR systems. In other cases, they can also be equipped with thermal cameras or other devices to detect outbreaks of pests and diseases or improve early warnings in case of fire. There are even experimental projects to use drones in simple forestry operations, such as planting seeds, fertilizing new plantations or fumigating weeds in areas that are not easily accessible.
There are, of course, other very interesting technologies, such as those to make possible the genetic selection and improvement of tree seeds to better adapt to the land and their use, or the robotization of felling, sowing or fertilization tasks. However, all have in common the need to manage high amounts of data and the possibility of enriching the information with open data to improve the analytical possibilities that allow to make better decisions. From the meteorological data published by the AEMET or the current Ministry of Agriculture, Food and Fisheries to the cartographic maps from the IGN, including forest inventories data from the Department of Rural Development, Innovation and Forestry Policy or the water resources from the Hydrographic Confederations. All of them are an important base to combine with the data captured by private means to improve innovation in the sector.
The pioneers of this revolution are obtaining advantages such as costs saving and higher production per forest unit. This second advantage is especially valuable in Western Europe where there is not many additional forest land available for new crops.
The digital transformation that forestry industry is living may represent a new opportunity for the development of this sector in Spain where there is an interesting combination of natural resources, capacities to adopt the technologies that enable this transformation and the availability of open data.
Content prepared by Jose Luis Marín, Head of Corporate Technology Startegy en MADISON MK and Euroalert CEO.
Contents and points of view expressed in this publication are the exclusive responsibility of its author.
Blog
Humans have been interested in weather prediction for several millennia. This interest goes back at least until the Babylonian civilization, when meteorological predictions were already made based on astrology and the clouds patterns. However, it was in the early twentieth century when decisive progress was made thanks to the understanding of physical laws that govern climate and predictions based on numerical models. From that moment on, mathematical models constructed from data collected by weather stations are still the basis of current weather prediction forms.
In the last decade, important advances have been made in the accuracy of short-term predictions of weather conditions in increasingly local environments. These improvements come largely from the ability to collect and process more and better data in real time with autonomous weather stations, to the important advances in data processing capacity thanks to cloud computing and the advances in data science and big data techniques. And, as we know, artificial intelligence and predictive models are better when higher is data quality.
The opening of climatic data
From the second half of the nineteenth century, states began to establish national meteorological services, in charge of the collection, generation, verification, interpretation and application of climate data. The first one was in United Kingdom in 1854 (now Met Office) and the Spanish Meteorological Agency (AEMET) is heiress of the service founded in 1887.
According to the Open Data Charter, nowadays almost all countries have a network of weather stations to collect local weather data, but there are important differences in their capabilities. For example, in some countries there is a network of high-density automated weather stations and measurement files that include long time series and local weather models. In other countries, however, a limited number of weather stations that are, in general, manually managed, with irregularly stored data, are available.
In any case, the value of the data collected and the models developed by these agencies is enormous for critical decision making in many industries. Therefore, its consideration as public sector information and its release as open data has been limited by important economic interests. The open data community is playing a very important role in making these data available to the public in the least restrictive conditions possible.
In general, meteorological data are usually available for reuse under license, with some data sets available with free access and other data sets only available for commercial use. Meteorological data sharing depends to a large extent on local policies for access and data sharing. The Open Data Charter still recognizes that there are difficulties for data sharing, because in many countries local meteorological observations are considered a commercial or strategic asset.
In Spain, the Aemet OpenData service allows two types of access: general access consisting of a graphical access for general public and Aemet OpenData API, designed for periodic or scheduled interactions with applications that require the available data sets. Both allow access to the same data catalog in reusable formats.
The reuse of climate data
Weather forecasts are of high importance in many industries, but are also useful for the general public. Therefore, the communication of these predictions also has a long tradition in formats that are not only data and models. Already in 1861 the first daily weather predictions were published in the British newspaper “The Times” and in 1936 the BBC experimentally broadcast the world's first televised weather predictions, including the use of weather maps. While these ways of communicating the predictions to the general public continue today, if there is an application that we could find in almost all smartphones in the world, it is the weather forecast app.
Pew Research, in its report “Americans’ Views on Open Government Data” 2015, already showed the widespread use of weather information apps, publishing that at least 84% of Americans with a smartphone had used them to consult the local weather forecast. Since these applications use data from the national meteorological service of the United States Government, the report concludes that, although unaware, 84% of Americans with a smartphone use regularly open public data.
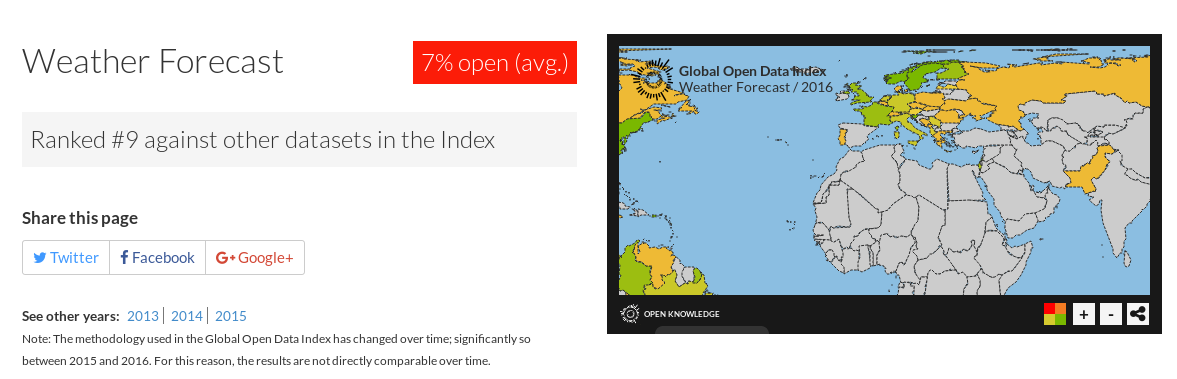
The importance of climate-related data sets prepared by national meteorological services is reflected in the fact that they tend to be one of the data sets that international open data indices consider key in their different measurement methodologies. For example, the Global Open Data Index (GODI) prepared by the Open Knowledge Foundation considers meteorological predictions as one of the 15 data sets that it includes in its measurement, at the same level as national statistics or commercial register data. In the 2016 edition, this data set was the ninth with the best score, 35% in the average opening metric.
The OURData Index, prepared by the OECD, uses 9 data sets to analyse the situation of open data in the 28 OECD countries and one of them is meteorological information.
The value generated by the reuse of meteorological data is extraordinary in areas as diverse as air traffic control, the precision agricultural and forestry industry or maritime navigation. One of the most obvious demonstrations is in the purchase of the company The Climate Corporation by Monsanto in 2009, which amounted to more than 900 million dollars the value created from open data mainly related to geology and meteorology.
Meteorological data is also one of the key data sets in initiatives to combat climate change and the design of sustainable environmental policies. Therefore, they are present as fundamental assets in initiatives such as the “Open Up Climate Data: Using Open Data to Advance Climate Action” by the World Resources Institute and the Open Data Charter, the challenge “Data for climate action” by Nations United or the Copernicus Climate Change Service (C3S) by the European Commission.
But, the high transversality of the meteorological data means that the most surprising uses are still beginning to develop, from forensic meteorology to help the resolution of crimes, to the prevention of asthma attacks or the improvement of marketing actions from the relationship between the weather and consumer behaviours. The development of open data policies as restrictive as possible that put meteorological data in the hands of innovators and researchers is essential so that these and many other applications can see the light.
Content prepared by Jose Luis Marín, Head of Corporate Technology Startegy en MADISON MK and Euroalert CEO.
Contents and points of view expressed in this publication are the exclusive responsibility of its author.