Blog
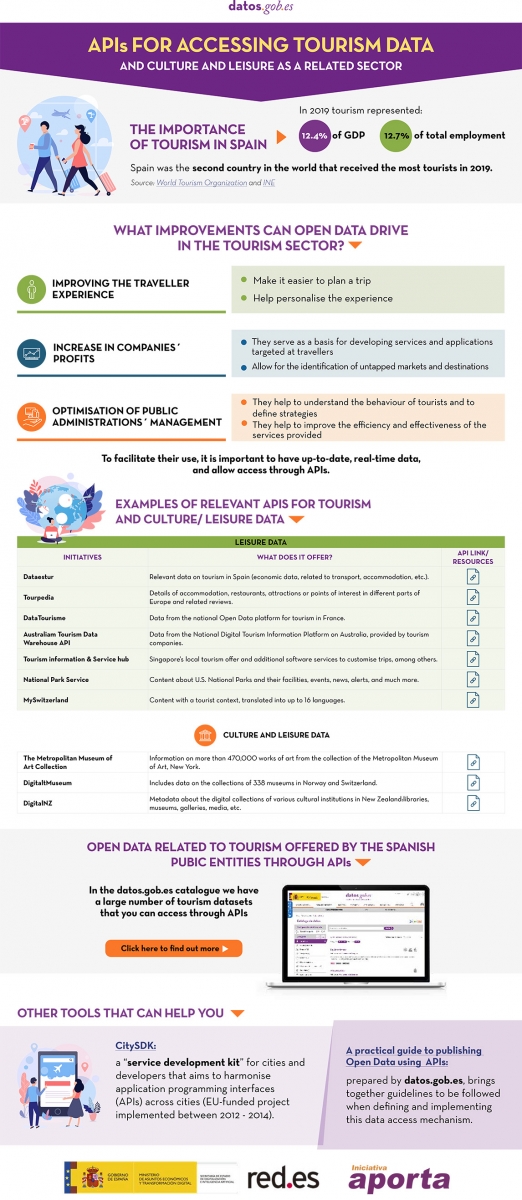
Spain was the second country in the world that received the most tourists during 2019, with 83.8 million visitors. That year, tourism activity represented 12.4% of GDP, employing more than 2.2 million people (12.7% of the total). It is therefore a fundamental sector for our economy.
These figures have been reduced due to the pandemic, but the sector is expected to recover in the coming months. Open data can help. Up-to-date information can bring benefits to all actors involved in this industry:
- Tourists: Open data helps tourists plan their trips, providing them with the information they need to choose where to stay or what activities to do. The up-to-date information that open data can provide is particularly important in times of COVID. There are several portals that collect information and visualisations of travel restrictions, such as the UN's Humanitarian Data Exchange. This website hosts a daily updated interactive map of travel restrictions by country and airline.
- Businesses. Businesses can generate various applications targeted at travellers, with useful information. In addition, by analysing the data, tourism establishments can detect untapped markets and destinations. They can also personalise their offers and even create recommendation systems that help to promote different activities, with a positive impact on the travellers' experience.
- Public administrations. More and more governments are implementing solutions to capture and analyse data from different sources in real time, in order to better understand the behaviour of their visitors. Examples include Segovia, Mallorca and Gran Canaria. Thanks to these tools, they will be able to define strategies and make informed decisions, for example, aimed at avoiding overcrowding. In this sense, tools such as Affluences allow them to report on the occupation of museums, swimming pools and shops in real time, and to obtain predictions for successive time slots.
The benefits of having quality tourism-related data are such that it is not surprising that the Spanish Government has chosen this sector as a priority when it comes to creating data spaces that allow voluntary data sharing between organisations. In this way, data from different sources can be cross-referenced, enriching the various use cases.
The data used in this field are very diverse: data on consumption, transport, cultural activities, economic trends or even weather forecasts. But in order to make good use of this highly dynamic data, it needs to be available to users in appropriate, up-to-date formats and access needs to be automated through application programming interfaces (APIs).
Many organisations already offer data through APIs. In this infographic you can see several examples linked to our country at national, regional and local level. But in addition to general data portals, we can also find APIs in open data platforms linked exclusively to the tourism sector. In the following infographic you can see several examples:
Click here to see the infographic in full size and in its accessible version.
Do you know more examples of APIs or other resources that facilitate access to tourism-related open data? Leave us a comment or write to datos.gob.es!
Content prepared by the datos.gob.es team.
Blog
Last December, the Congress of Deputies approved Royal Decree-Law 24/2021, which included the transposition of Directive (EU) 2019/1024 on open data and the reuse of public sector information. This Royal Decree amends Law 37/2007 on the reuse of public sector information, including new requirements for public bodies, including facilitating access to high-value data.
High-value data are data whose reuse is associated with considerable benefits to society, the environment and the economy. Initially, the European Commission highlighted as high-value data those belonging to the categories of geospatial, environmental, meteorological, statistical, societal and mobility data, although these classes can be extended both by the Commission and by the Ministry of Economic Affairs and Digital Transformation through the Data Office. According to the Directive, this type of data "shall be made available for reuse in a machine-readable format, through appropriate application programming interfaces and, where appropriate, in the form of bulk download". In other words, among other things, an API is required.
What is an API?
An application programming interface or API is a set of definitions and protocols that enable the exchange of information between systems. It should be noted that there are different types of APIs based on their architecture, communication protocols and operating systems.
APIs offer a number of advantages for developers, since they automate data and metadata consumption, facilitate mass downloading and optimize information retrieval by supporting filtering, sorting and paging functionalities. All of this results in both economic and time savings.
In this sense, many open data portals in our country already have their own APIs to facilitate access to data and metadata. In the following infographic you can see some examples at national, regional and local level, including information about the API of datos.gob.es. The infographic also includes brief information on what an API is and what is needed to use it.

Click here to see the infographic in full size and in its accessible version
These examples show the effort that public agencies in our country are making to facilitate access to the information they keep in a more efficient and automated way, in order to promote the reuse of their open data.
In datos.gob.es we have a Practical Guide for the publication of open data using APIs where a series of guidelines and good practices are detailed to define and implement this mechanism in an open data portal.
Content prepared by the datos.gob.es team.
Documentación
In a platform such as datos.gob.es, where the frequency of dataset updates is constant, it is necessary to have mechanisms that facilitate massive and automatic queries.
In datos.gob.es we have an API and a SPARQL point to facilitate this task. Both tools allow querying the metadata associated with the datasets of the National Open Data Catalog based on the definitions included in the Technical Interoperability Standard for the Reuse of Information Resources (NTI-RISP). Specifically, the semantic database of datos.gob.es contains two graphs, one containing the entire Catálogo de datos de datos.gob.es and another with the URIs corresponding to the taxonomy of primary sectors and the identification of geographic coverage based on the NTI.
In order to help reusers to perform their searches through these functionalities, we provide users with two videos that show in a simple way the steps to follow to get the most out of both tools.
Video 1: How to make queries to the datos.gob.es catalog through an API?
An application programming interface or API is a mechanism that allows communication and information exchange between systems. Thanks to the API of datos.gob.es you can automatically query the datasets of a publisher, the datasets that belong to a specific subject or those that are available in a specific format, among many other queries.
The video shows:
- How to use the datos.gob.es API.
- What types of queries can be made using this API
- An example to learn how to list the datasets in the catalog.
- What other Open Data Initiatives are publishing APIs
- How to consult other available APIs
You also have at your disposal an infographic with examples of APIs for open data access.
Video 2: How to perform queries to the .gob.es data catalog through the SPARQL point?
A SPARQL point is an alternative way to query the metadata of the datos.gob.es catalog using a service that allows queries over RDF graphs using the SPARQL language.
With this video, you will see:
- How to use the SPARQL point of datos.gob.es.
- What queries can be performed using the SPARQL point
- What methods exist for querying the SPARQL point
- Examples on how to perform a query to find out which datasets are available in the catalog or how to obtain the list of all the organizations that publish data in the catalog.
- It also includes examples of SPARQL points in different national initiatives.
These videos are mainly aimed at data reusers. From datos.gob.es we have also prepared a series of videos for publishers explaining the various features available to them on the platform.
Blog
Life happens in real time and much of our life, today, takes place in the digital world. Data, our data, is the representation of how we live hybrid experiences between the physical and the virtual. If we want to know what is happening around us, we must analyze the data in real time. In this post, we explain how.
Introduction
Let's imagine the following situation: we enter our favorite online store, we search for a product we want and we get a message on the screen saying that the price of the product shown is from a week ago and we have no information about the current price of the product. Someone in charge of the data processes of that online store could say that this is the expected behavior since the price database uploads from the central system to the e-commerce are weekly. Fortunately, this online experience is unthinkable today in an e-commerce, but far from what you might think, it is a common situation in many other processes of companies and organizations. It has happened to all of us that being registered in a database of a business, when we go to a store different from our usual one, opps, it turns out that we are not listed as customers. Again, this is because the data processing (in this case the customer database) is centralized and the loads to peripheral systems (after-sales service, distributors, commercial channel) are done in batch mode. This, in practice, means that data updates can take days or even weeks.
In the example above, batch mode thinking about data can unknowingly ruin the experience of a customer or user. Batch thinking can have serious consequences such as: the loss of a customer, the worsening of the brand image or the loss of the best employees.
Benefits of using real-time data
There are situations in which data is simply either real-time or it is not. A very recognizable example is the case of transactions, banking or otherwise. We cannot imagine that payment in a store does not occur in real time (although sometimes the payment terminals are out of coverage and this causes annoying situations in physical stores). Nor can (or should) it happens that when passing through a toll booth on a highway, the barrier does not open in time (although we have probably all experienced some bizarre situation in this context).
However, in many processes and situations it can be a matter of debate and discussion whether to implement a real-time data strategy or simply follow conventional approaches, trying to have a time lag in (data) analysis and response times as low as possible. Below, we list some of the most important benefits of implementing real-time data strategies:
- Immediate reaction to an error. Errors happen and with data it is no different. If we have a real-time monitoring and alerting system, we will react before it is too late to an error.
- Drastic improvement in the quality of service. As we have mentioned, not having the right information at the time it is needed can ruin the experience of our service and with it the loss of customers or potential customers. If our service fails, we must know about it immediately to be able to fix it and solve it. This is what makes the difference between organizations that have adapted to digital transformation and those that have not.
- Increasing sales. Not having the data in real time, can make you lose a lot of money and profitability. Let's imagine the following example, which we will see in more detail in the practical section. If we have a business in which the service we provide depends on a limited capacity (a chain of restaurants, hotels or a parking lot, for example) it is in our interest to have our occupancy data in real time, since this means that we can sell our available service capacity more dynamically.
The technological part of real time
For years, data analysis was originally conceived in batch mode. Historical data loads, every so often, in processes that are executed only under certain conditions. The reason is that there is a certain technological complexity behind the possibility of capturing and consuming data at the very moment it is generated. Traditional data warehouses, (relational) databases, for example, have certain limitations for working with fast transactions and for executing operations on data in real time. There is a huge amount of documentation on this subject and on how technological solutions have been incorporating technology to overcome these barriers. It is not the purpose of this post to go into the technical details of the technologies to achieve the goal of capturing and analyzing data in real time. However, we will comment that there are two clear paradigms for building real-time solutions that need not be mutually exclusive.
- Solutions based on classic mechanisms and flows of data capture, storage (persistence) and exposure to specific consumption channels (such as a web page or an API).
- Solutions based on event-driven availability mechanisms, in which data is generated and published regardless of who and how it will be consumed.
A practical example
As we usually do in this type of posts, we try to illustrate the topic of the post with a practical example with which the reader can interact. In this case, we are going to use an open dataset from the datos.gob.es catalog. In particular, we are going to use a dataset containing information on the occupancy of public parking spaces in the city center of Malaga. The dataset is available at this link and can be explored in depth through this link. The data is accessible through this API. In the description of the dataset it is indicated that the update frequency is every 2 minutes. As mentioned above, this is a good example in which having the data available in real time[1] has important advantages for both the service provider and the users of the service. Not many years ago it was difficult to think of having this information in real time and we were satisfied with aggregated information at the end of the week or month on the evolution of the occupancy of parking spaces.
From the data set we have built an interactive app where the user can observe in real time the occupancy level through graphic displays. The reader has at his disposal the code of the example to reproduce it at any time.
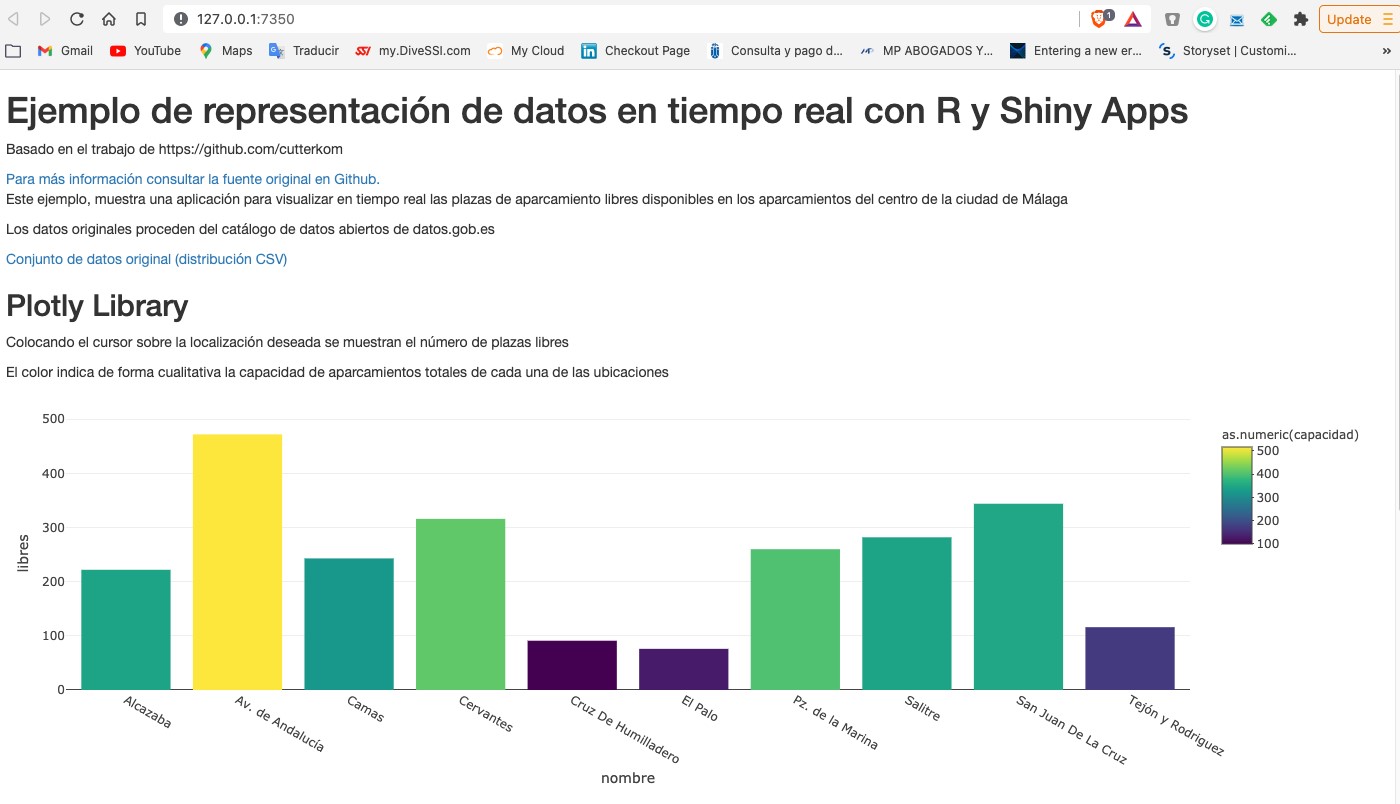
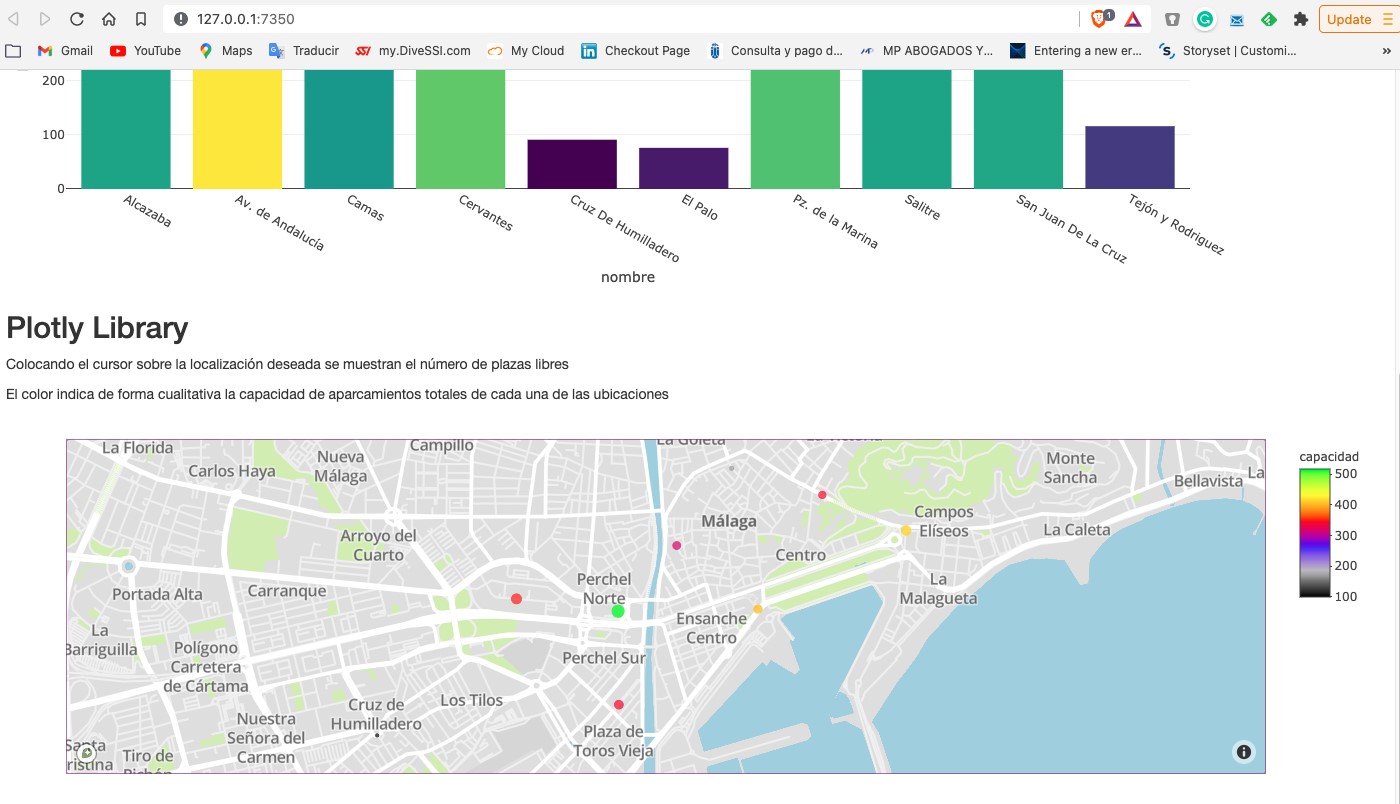
In this example, we have seen how, from the moment the occupancy sensors communicate their status (free or occupied) until we consume the data in a web application, this same data has gone through several systems and even had to be converted to a text file to expose it to the public. A much more efficient system would be to publish the data in an event broker that can be subscribed to with real-time technologies. In any case, through this API we are able to capture this data in real time and represent it in a web application ready for consumption and all this with less than 150 lines of code. Would you like to try it?
In conclusion, the importance of real-time data is now fundamental to most processes, not just space management or online commerce. As the volume of real-time data increases, we need to shift our thinking from a batch perspective to a real-time first mindset. That is, let's think directly that data must be available for real-time consumption from the moment it is generated, trying to minimize the number of operations we do with it before we can consume it.
[1] The term real time can be ambiguous in certain cases. In the context of this post, we can consider real time to be the characteristic data update time that is relevant to the particular domain we are working in. For example, in this use case an update rate of 2 min is sufficient and can be considered real time. If we were analysing a use case of stock quotes the concept of real time would be in the order of seconds.
Content prepared by Alejandro Alija, expert in Digital Transformation and Innovation.
The contents and views expressed in this publication are the sole responsibility of the author.
Blog
A couple of weeks ago, we commented in this article the importance of data analysis tools to generate representations that allow a better understanding of the information and make better decisions. In this article we divide these tools into 2 categories: generic data visualization tools - such as Kibana, Tableau Public, SpagoBI (now Knowage) and Grafana - and visualization libraries and APIs. We are going to dedicate this new post to the latter.
Libraries and visualization APIs are more versatile than generic visualization tools, but in order to work with them it is necessary for the user to know the programming language where the library is implemented.
There is a wide range of libraries and APIs for different programming languages or platforms, which implement functionalities related to data visualization. Next, we will show you a selection taking as a fundamental criterion the popularity that the User Community grants them.
Google Chart Tools
Functionality:
Google Chart Tools is Google's API for creating interactive visualizations. It allows the creation of dashboards using different types of widgets, such as category selectors, time ranges or autocompleters, among others.
Main advantages:
It is a very easy-to-use and intuitive tool that allows interaction with data in real time. Furthermore, the generated visualizations can be integrated into web portals using HTML5 / SVG technology.
Do you want to know more?
- Support materials: On Youtube we find various tutorials made by API users.
- Repository: On Github we can access a common library for graphics packages, as well as know the supported chart types and examples of how to customize the components of each graphic, among others.
- User community: Users of Google Chart Tools can raise their questions in the Google community, in the space enabled for it.
JavaScript InfoVis Toolkit
Functionality:
JavaScript InfoVis Toolkit is the JavaScript library that provides functions for creating multiple interactive visualizations such as maps, hierarchical trees or line graphs.
Main advantages:
It is efficient in handling complex data structures and has a wide variety of display options, so it adapts to any developer need.
Do you want to know more?
- Support materials: East user manual explains the main display options and how to work with the library. Also available demos for creating different types of graphics.
- Repository: Users must download the project from http://thejit.org, although they also have available a repository on Github where, among other things, they can download extras.
- User community: Both in the Google user community like in Stackoverflow We found spaces dedicated to JavaScript InfoVis Tookit for users to share doubts and experiences.
Data-Driven Documents (D3.js)
Functionality:
Data-Driven Documents (D3.js) is the Javascript library that allows the creation of interactive graphics and complex visualizations. Thanks to it, data-based documents can be manipulated using open web standards (HTML, SVG and CSS), so that browsers can interpret them to create visualizations independently of proprietary software.
Main advantages:
This library allows the manipulation of a DOM (Object Model for Document Representation) by applying the necessary transformations to the structure based on the data linked to an HTML or XML document. This provides virtually unlimited versatility.
Do you want to know more?
- Support materials: On Github You can find numerous tutorials, although mainly dedicated to the old versions (they are currently in the process of updating this section of the wiki and writing new tutorials on version 4.0 of D3).
- Repository: Also on Github we find up to 53 repositories, which cover different materials to manage thousands of simultaneous animations, group two-dimensional points in hexagonal trays or work with the d3-color module, among others. In this Gallery you can see some of the work done.
- User community:There are spaces for discussion about D3 in the Community of Google,Stackoverflow, Gitter Y Slack.
- Social media: On the Twitter account @ d3js_org experiences, news and use cases are shared. There is also a group in LinkedIn.
Matplotlib
Functionality:
Matplotlib is one of the most popular libraries in Python for creating high-quality graphics and visualizations. It is characterized by presenting a hierarchical organization that goes from the most general level, such as the outline of a 2D matrix, to a very specific level, such as coloring a certain pixel.
Main advantages:
Matplotlib supports text and labels in LaTeX format. In addition, users can customize its functionality through packages designed by third parties (Cartopy, Ridge Map, holoviews, among others).
Do you want to know more?
- Support materials: On its own website we find a user's GuideIt includes information on the installation and use of the various functionalities. Also available tutorials for both beginners, intermediate or advanced users.
- Repository: In this repository Github are the materials you need for installation. On the web you can see a Gallery with examples of works for your inspiration.
- User community: The official website has a community section, although you can also find user groups to help you with your questions in Stackoverflow and Gitter.
- Social media: On Twitter profile @matplotlib Examples of user work and visualizations are also shared, as well as information on the latest news in the tool.
Bokeh
Functionality:
Bokeh is the Python library oriented to the creation of interactive graphs based on HTML / JS. It has the ability to generate interactive visualizations with features such as floating text, zoom, filters or selections, among others.
Main advantages:
Its main advantage is simplicity in implementation: complex interactive visualizations can be created with just a few lines of code. In addition, it allows embedding JavaScript code to implement specific functionalities.
Do you want to know more?
- Support materials: This User's guide provides detailed descriptions and examples that describe many common tasks that can be performed with Bokeh. On the Bokeh website we also find this tutorial and application examples built with this tool.
- Repository: In this repository Github There are the materials and instructions for its installation, as well as examples of use. Examples are also available in this Gallery.
- User community: The official community can be found on the website of Bokeh, although the users of this tool also meet in Stackoverflow.
- Social media:To keep up to date with news, you can follow the Twitter account @bokeh or your profile in LinkedIn.
The following table shows a summary of the tools mentioned above:
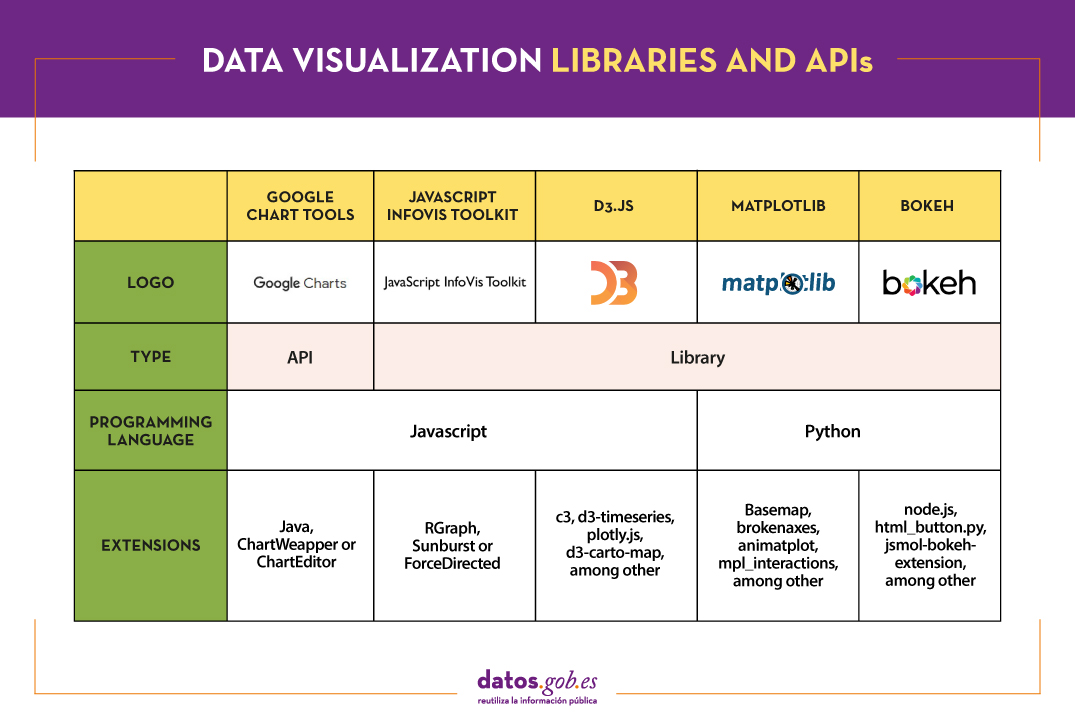
Are you agree with our selection? We invite you to share your experience with these or other tools in the comments section.
If you are looking for tools to help you in data processing, from datos.gob.es we put at your disposal the report "Data processing and visualization tools”, Recently updated, as well as the following monographic articles:
- The most popular data conversion and data cleaning tools
- The most popular data analysis tools
- The most popular data visualisation tools
- The most popular geospatial visualisation tools
- The most popular network analysis tools
Content elaborated by datos.gob.es team.
Blog
When it comes to infrastructure, the foundation of our modern civilisation is based on concrete and steel. Wherever we look, large structures such as roads, buildings, cars, trains and planes are made of concrete and metal. In the digital world, everything is made of data and APIs. From the moment we wake up in the morning and look at our mobile phones, we interact with data and APIs.
Introduction
When we check our email, ask ourselves what the weather is going to be like or check our route by car, we do so through applications (mobile, web or desktop) that make use of APIs to return the data we request. We have already talked at length about APIs, through various contents where we have explained, for example, how to publish open data using this mechanism or how to ensure that the APIs comply with certain specifications.
APIs are the interfaces through which computer programs talk to each other and exchange information. The current absolute standard for APIs is REST technology. REST has long since replaced SOAP as the preferred technology for communicating between applications over the Internet. REST uses the HTTPs protocol as a transport medium to ask questions and get answers. For example, the AEMET app, executes a query via REST using HTTPs over the Internet to the AEMET servers. When the AEMET servers (known as the AEMET API) receive the specific query, it returns the information to our mobile phone as programmed. All this usually happens very quickly (usually in less than a second) and is not noticeable to us.
Undoubtedly most digital products rely on REST APIs for their operation. Data products are no exception and the vast majority adopt this standard for their operation. However, despite the great acceptance and flexibility of REST, it is not perfect, and some of its limitations have a negative impact on the development of highly data-oriented products. Some of its most obvious limitations are:
- REST is all or nothing. When you make a query, you get the full programmed result. For example, if you want to query a user in a database, you normally make one call (to the user endpoint) and get the full list of users.
- REST often requires several calls to get the desired data. Continuing with the previous example, if you want to query the balance of a user's bank account, you usually have to make the call to the list of users, then call the list of bank accounts, cross-reference these two results, and finally call the balance query with the user and his bank account as parameters of the final query.
- REST is not designed to easily manage relationships. In the previous example we saw that we have to do several sequential steps intermediating partial queries in order to get the result of a related query.
To simply understand the difference between a service-oriented IT application and a data-oriented IT application, let's take an example: when developing a modern application with different functionality, it is often referred to as a service-oriented IT design pattern. Under this pattern, a service that allows users to log into the system is a typical case of integration between services. This functionality typically uses REST APIs as an integration mechanism. A concrete example are those applications that allow us to log in to their service using an email account or a social network. The case of a data-oriented service is one in which the application performs a query to the system with the main purpose of sharing data. For example, when we request the average time that a user has been browsing a particular part of our application or website.
GraphQL
As an alternative to REST and to overcome these limitations, Facebook created GraphQL in 2012. At that time, Facebook used it internally for its own queries on the social network, but in 2015, the company decided to publish the source code of this project, turning it into Open Source software.
The great advantage of GraphQL is the possibility of requesting specific data, regardless of how the data is organised at source. The source data can be organised (and stored) in a relational database, in a REST API in a NoSQL database or in a specifically designed object, e.g. the result of an algorithm.
A query in the GraphQL language looks like this:
{
Bicicletas_Barcelona(district:1, type:”electric”){
Bike,
Street
}
Barcelona(district:1){
Bus,
Stop,
Lat,
Long
}
}
In the example above, starting from an open dataset available on datos.gob.es, with GraphQL, we would be able to combine (in a single query) the results of the location of an urban electric bicycle parking in Barcelona together with the position of a nearby bus stop. The goal would be to be able to build a data product that is able to plan urban trips by sustainable means of transport[1]. In the same way we could combine multiple data sources, for example, open data on buses and mobility from other cities in Spain. We would only need to incorporate these new data sources as the underlying model returning the queries would be very similar.
As can be seen in the query, GraphQL is declarative in nature. JSON format is used to declare in a very simple and clear way what is being requested from the system.
An example of GraphQL
Let's suppose that we have a database to manage a training course. It is easy to think that in that database we have several tables with the record of the students, the subjects, the grades, etc. When we apify this database with REST, we will create several endpoints to consult the students, the subjects and the grades. When we want to consult the students, who are eligible in a specific subject, we will have to make several consecutive calls and our application will have to take care of the corresponding filters. The logical flow would be something like this:
- We request the list of students.
- We request the list of subjects.
- We cross both lists and filter for the subject we want to check.
- We request the list of grades for that subject.
- We filter for students above a certain grade.
Each of these calls will have a different endpoint of the type:
However, in GraphQL we can perform this query in a single call since GraphQL allows querying related data in a single call.
In conclusion, GraphQL is a technology to be considered today as a tool for integration with information systems. It is generally accepted that REST APIs are more oriented towards integration between Internet services (e.g. a user authentication service) while GraphQL is more oriented towards integration between data products (e.g. a price comparison tool on the Internet). In this interesting debate between IT product integration versus data products, it seems that both technologies will coexist in the near future.
[1] This consultation has been adapted from its original source. Thanks to Ángel Garrido Román for his detailed explanation in his TFG 2018.
Content elaborated by Alejandro Alija, expert in Digital Transformation and Innovation.
Contents and points of view expressed in this publication are the exclusive responsibility of its author.
Blog
Many people don't know, but we are surrounded by APIs. APIs are the mechanism by which services communicate on the Internet. APIs are what make it possible for us to log into our email or make a purchase online.
API stands for Application Programming Interface, which for most Internet users means nothing. However, the reality is that thanks to APIs today we can do all those fantastic things that we love so much in the digital world. From logging into any Internet service, making a purchase on Amazon or reserving a hotel room on Booking. All these services are possible thanks to APIs.
A simple way to explain what an API is for is as follows: a mechanism by which two software programs can “talk” and exchange the data they need to fulfill the functionality for which they were designed. For example, to log in to our email provider, there is a program in charge of validating that we have a correct username and password. However, this program must receive that username and password from a person who interacts with a web browser or a mobile application. In order for the mobile application to know how to send that program the username and password of the person who wants to access the service, it uses an API as an exchange language. This API defines the way the mobile app sends this data and the way the validation program consumes it. Thus, when a new mobile application requires the same validation process, it will be enough to follow the same API to verify the user's credentials.
The importance of APIs in creating data products
In this new post, we focus on the field of APIs as a key technological base for the creation of data products. The fundamental characteristic of digital disruption is the role of data as the main transforming element of organizations and society. This is why data products are becoming more common and valuable. Data products are digital applications and services created with the integrated data component from design. The data component does not have to be the only characteristic of the product or service, but it does play a fundamental role in the operation of the product (physical or digital) or service. Take, for example, a mobile map application. Its main functionality may be to show us a map and physically locate our current position. However, the application can be understood as a data product where, in addition to our current position, we find nearby services such as restaurants, gas stations, libraries, etc. In addition, we can over-print weather information or current traffic conditions. An application of this type cannot be understood without an ecosystem of APIs that allow the intercommunication of the different services (meteorology, traffic, points of interest, etc.) with the application itself.
How to Manage APIs in Data Products: The Friendliness Checker API Example
Having clearly understood the importance of APIs in data products, let us now analyze the complexity of managing one or more large APIs in a data product. Creating good APIs is hard work. You need to determine what data you are going to provide and accept our API. We must estimate the volume of requests that we will have to assume. We must think about the update mechanisms as well as the monitoring of the use that the API is having. Not to mention the security and privacy of the data that the API will handle.
For these and many other reasons, the Support Center for Data Sharing has created the API Friendliness Checker tool. The Support Center for Data Sharing (SCDS) is a European project led by a consortium of three companies: Capgemini Invent, Fraunhofer Fokus and Timelex.
The API Friendliness Checker tool allows API developers to analyze whether their APIs comply with the OpenAPI specification: an established and widely recognized standard for developing APIs. The OpenAPI specification was developed with accessibility criteria in mind. The goal is that the services and applications that implement it can be understood by humans and machines alike, without the need to access programming code or documentation. In other words, an API developed under the OpenAPI specification is self-contained and can be used out of the box without the need for additional documentation or code. In other words, an API developed under the OpenAPI specification is self-contained and can be used out of the box without the need for additional documentation or code.
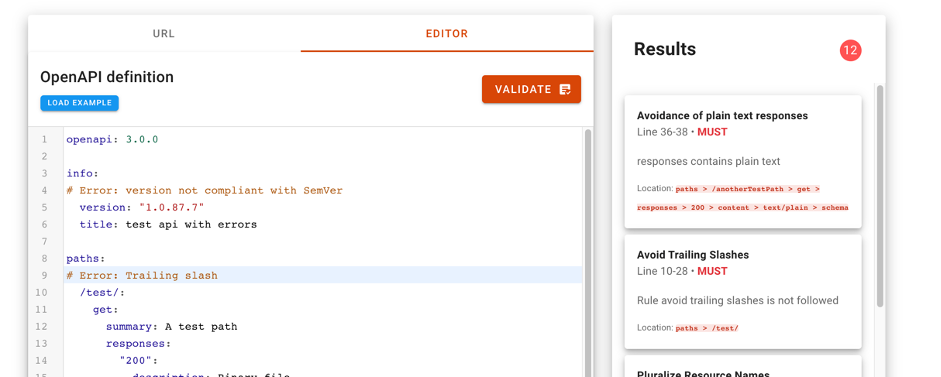
When we use the tool, the API compatibility validator allows the developer to compare their API against the essential quality and usability criteria defined by the OpenAPI specification. The tool allows you to copy the specification url of our API to evaluate its compatibility. It is also possible to copy and paste the description of our API in the editor of the tool. Just by pressing the validate button, the compatibility checker will evaluate the API and display any comments for improvement.
For more information on the technical characteristics of this validation tool, all the information can be consulted on the SCDS website https://eudatasharing.eu/es/node/578.
If you are thinking of creating a new data product, we are sure that this tool to validate your API before putting it into production will be of great help. Finally, if your digital product is based on real-time data, you will surely be interested in exploring these other concepts such as event-oriented systems and asynchronous APIs.
Do you want to know more about the APIs?
As we have seen, APIs are a fundamental element in the world of data. Whether you are a publisher or a reuser of open data, at datos.gob.es you have at your disposal some materials that can help you:
- Report "How to generate value from data: formats, techniques and tools to analyze open data". Aimed at reusers, it discusses the world of APIs in more detail, including practical examples on their use on the Internet.
- “Practical guide for the publication of Open Data using APIs”. Aimed at those data portals that do not yet have an API, this guide offers guidelines to define and implement this data access mechanism.
Contenido elaborado por Alejandro Alija,experto en Transformación Digital e Innovación.
Los contenidos y los puntos de vista reflejados en esta publicación son responsabilidad exclusiva de su autor.
Documentación
An application programming interface or API is a mechanism that allows communication and information exchange between systems. Open data platforms, such as datos.gob.es, have this type of tool to interact with the information system and consult the data without the need for knowledge of the internal structure or the technology used in its development. Thanks to the APIs, reusers can more easily access the information they need automatically, and it is possible to adjust the download exclusively to the data required.
More and more organizations are betting on this type of mechanism, especially to publish data with a high frequency of update as the data in real time. The European Directive on Open Data and Re-use of Public Sector Information refers to the need for this type of mechanism for the publication of dynamic and high-value data. It is common to use APIs to access meteorological data, public transport data or data produced by urban monitoring sensors, although it should be noted that APIs are suitable for consuming all types of data.
With the aim of helping those open data portals that do not have an API yet, datos.gob.es has prepared a guide with the main guidelines to follow when defining and implementing this data access mechanism. The guide has been prepared by Carlos de la Fuente, expert in Information Technology and Open Data, and has been supported by a multidisciplinary group of experts from both the public administration and the field of reuse, with experience in international projects.
What can the reader find in this guide?
The guide begins with a first section dedicated to understanding what APIS are and what their value is. It explains how they work and how they are implemented. For those who want to learn more, we recommend the training unit ”Buenas prácticas en el diseño de APIs y Linked Data” (only available in Spanish).
The guide then focuses on the guidelines for designing and implementing APIs. Among other aspects, it addresses how to use URIs to identify resources or how to avoid service interruptions.
The guide ends with a series of more specific sections focusing on the implementation of APIs in Open Data catalogues, for access to linked data and to geographic web services.
What are the main improvements and updates in the 2025 release?
The guide has been revised in 2025 to update the content with new links and examples, as well as to expand the content on FIWARE with a practical focus and to go into more detail in the OpenAPI section.
A new volume in the collection
This guide is part of a collection of documents produced by the Aporta Initiative to help data publishers to facilitate access and encourage the use of published information. Specifically, the collection seeks to raise awareness of the best formats for reuse, and to provide a series of clear and simple guidelines that agencies can follow when opening their datasets, thus ensuring their quality.
The "Practical Guide to Publishing Open Data using APIs" is the second document in the series, which began in March with the publication of a first volume dedicated to the publication of tabular data in CSV files. In the coming months we will continue publishing content in our effort to facilitate the opening of data and its reuse.
Documentación
In the digital world, data becomes a fundamental asset for companies. Thanks to them, they can better understand their environment, business and competition, and make convenient decisions at the right time.
In this context, it is not surprising that an increasing number of companies are looking for professional profiles with advanced digital capabilities. Workers who are able to search, find, process and communicate exciting stories based on data.
The report "How to generate value from data: formats, techniques and tools to analyse open data" aims to guide those professionals who wish to improve the digital skills highlighted above. It explores different techniques for the extraction and descriptive analysis of the data contained in the open data repositories.
The document is structured as follows:
- Data formats. Explanation of the most common data formats that can be found in an open data repository, paying special attention to csv and json.
- Mechanisms for data sharing through the Web. Collection of practical examples that illustrate how to extract data of interest from some of the most popular Internet repositories.
- Main licenses. The factors to be considered when working with different types of licenses are explained, guiding the reader towards their identification and recognition.
- Tools and technologies for data analysis. This section becomes slightly more technical. It shows different examples of extracting useful information from open data repositories, making use of some short code fragments in different programming languages.
- Conclusions. A technological vision of the future is offered, with an eye on the youngest professionals, who will be the workforce of the future.
The report is aimed at a general non-specialist public, although those readers familiar with data treatment and sharing o in the web world will find a familiar and recognizable reading.
Next, you can then download the full text, as well as the executive summary and a presentation.
Note: The published code is intended as a guide for the reader, but may require external dependencies or specific settings for each user who wishes to run it.