Entrevista
Google is a company with a strong commitment to open data. It has launched Google Dataset Search, to locate open data in existing repositories around the world, and also offers its own datasets in open format as part of its Google Research initiative. In addition, it is a reuser of open data in solutions such as Google Earth.
Among its areas of work is Google for Education, with solutions designed for teachers and students. In datos.gob.es we have interviewed Gonzalo Romero, director of Google for Education in Spain and member of the jury in charge of evaluating the proposals received in the III edition of Desafío Aporta. Gonzalo talked to us about his experience, the influence of open data in the education sector and the importance of open data.
Full interview:
1. What challenges does the education sector face in Spain and how can open data and data-driven technologies help to overcome them?
Last year, due to the pandemic, the education sector was forced to accelerate its digitalization process so that the activity could develop as normally as possible.
The main challenges facing the education sector in Spain are technology and digitization as this sector is less digitized than average. Secure, simple and sustainable digital tools are needed so that the education system, from teachers and students to administrators, can operate easily and without any problems.
Open data makes it possible to locate certain quality information from thousands of sources quickly and easily at any time. These repositories create a reliable data sharing ecosystem that encourages publishers to publish data to drive student learning and the development of technology solutions.
2. Which datasets are most in demand for implementing educational solutions?
Each region usually generates its own. The main challenge is how new datasets can be created in collaboration with the variables that allow them to create predictive models to anticipate the main challenges they face, such as school dropout, personalization of learning or academic and professional orientation, among others.
3. How can initiatives such as hackathons or challenges help drive data-driven innovation? How was your experience in the III Aporta Challenge?
It is essential to support projects and initiatives that develop innovative solutions to promote the use of data.
Technology offers tools that help to find synergies between public and private data to develop technological solutions and promote different skills among students.
4. In addition to being the basis for technological solutions, open data also plays an important role as an educational resource in its own right, as it can provide knowledge in multiple areas. To what extent does this type of resource foster critical thinking in students?
The use of open data in the classroom is a way to boost and foster students' educational skills. For a good use of these resources it is important to search and filter the information according to the needs, as well as to improve the ability to analyse data and argumentation in a reasoned way. In addition, it allows the student to manage technological programs and tools.
These skills are useful for the future not only academically but also in the labour market, since more and more professionals with skills related to analytical capacity and data management are in demand.
5. Through your Google Research initiative, multiple projects are being carried out, some of them linked to the opening and reuse of open data. Why is it important that private companies also open data?
We understand the difficulties that private companies may have if they share data since sharing their information can be an advantage for competitors. However, it is essential to combine public and private sector data to drive the growth of the open data market that can lead to new analyses and studies and the development of new products and services.
It is also important to approach data reuse in the light of new and emerging social challenges and to facilitate the development of solutions without having to start from scratch.
6.What are Google's future plans for open data?
Sensitive corporate data has high survivability requirements, in case a provider has to cancel cloud services due to policy changes in a country or region, and we believe it is not possible to secure data with a proprietary solution. However, we do have open source and open standards tools that address multiple customer concerns.
Data analysis tools such as BigQuery or BigQuery Omni allow customers to make their own data more open, both inside and outside their organization. The potential of that data can then be harnessed in a secure and cost-efficient way. We already have clear use cases of value created with our data and artificial intelligence technology, and endorsed by the CDTI, such as the Student Success data dropout prevention model. Leading educational institutions already use it on a daily basis and it is in pilot phase in some education departments.
The company's goal is to continue working to build an open cloud hand in hand with our local partners and public institutions in Spain and across Europe, creating a secure European digital data ecosystem with the best technology.
Noticia
How time flies! It seems like only yesterday when, at this time of year, we were writing our letter to Santa Claus and the Three Wise Men asking them for our most sincere wishes. Once again, Christmas is here to remind us of the magic of reuniting with our loved ones, but it is also the perfect time to enjoy and rest.
For many, within that Christmas happiness is the passion for reading. What better time to enjoy a good book than these winter days under the warmth of home? Novels, comics, essays... but also guides or theoretical books that can help you expand your knowledge related to your field of work. Therefore, as every year, we have asked our pages -the collaborators of datos.gob.es- the best recommendations on books related to data and technology to offer you some ideas that you can include in your letter this year, if you have behaved well.
Telling your Data Story: Data Storytelling for Data Management, Scott Taylor (The Data Whisperer)
What is it about? The author of this book offers us a practical guide to explain and make us understand the strategic value of data management within the business environment.
Who is it for? It is focused on working professionals interested in improving their skills both in managing and carrying out a company's data plan, as well as in handling tools to be able to clearly explain their actions to third parties. Its target audience also includes data scientists interested in bringing this discipline closer to the business sector.
Language: English
The art of statistics: Learning from data, David Spiegelhalter
What is it about? This book shows readers how to derive knowledge from raw data and mathematical concepts. Through real-world examples, the author tells us how data and statistics can help us solve different problems, such as determining the luckiest passenger on the Titanic or whether a serial killer could have been caught earlier, among others.
Who is it for? If you are passionate about the world of statistics and curious data, this book is for you. Its readability and full of examples taken from the world around us makes this book an interesting idea to include in your letter to the Three Wise Men this year.
Language: English
Big Data. Conceptos, tecnologías y aplicaciones, David Ríos Insúa y David Gómez Ullate Oteiza
What is it about? This new CSIC book brings readers closer to big data and its applications in politics, healthcare and cybersecurity. Its authors, David Ríos and David Gómez-Ullate describe the technology and methods used by data science, explaining its potential in various fields.
Who is it for? Anyone interested in expanding their knowledge of current scientific and technological issues will find this book more than interesting. Its simple and accessible explanations make this manual a pleasant and friendly text for all types of readers.
Language: Spanish
Data Analytics with R: A Recipe book, Ryan Garnett
What is it about? As if it were a recipe book! This is how Ryan Garnet presents this book dedicated to explaining in an entertaining and very practical way to the readers the data analysis focused on the R language.
Who is it for? This book is a very interesting option for both programmers and data analysis enthusiasts who want to discover more about R. Its structure in the form of recipes to explain this field makes it easy to understand. In addition, you can download it for free.
Language: English
Datanomics, Paloma Llaneza
What is it about? This book reveals with data, reports and proven facts what technology companies are really doing with the personal data we give them and how they profit from it.
Who is it for? It is a document of great interest to all citizens. The fact that the information it contains is reinforced with supporting reports makes it lighter and more enjoyable to read.
Language: Spanish
Everybody Lies: Big Data, New Data, and What the Internet Can Tell Us about Who We Really Are, Seth Stephens-Davidowitz
What is it about? Did you know that users surfing the Internet expose a total of 8 billion gigabytes of data every day? The author shows us in this book how the data we provide about our searches reveal our fears, desires and behaviors, but also conscious and unconscious biases.
Who is it for? This book is aimed at anyone looking to expand their knowledge about how we express ourselves in the digital age. If you would like answers to questions such as whether where we go to school can influence our future success, this book is for you.
Language: English
As in previous years, this list is just a small selection that we have made based on the recommendations suggested by some of the experts who collaborate in datos.gob.es, as well as some of the members of this team. Undoubtedly, the world is full of really interesting books on data and technology.
Do you know of any more that we should not forget in our letter to the Three Wise Men? Leave us a comment or send us an email to dinamizacion@datos.gob.es, we will be happy to read it!
Entrevista
Open data is not only a matter of public administrations, more and more companies are also betting on them. This is the case of Microsoft, who has provided access to selected open data in Azure designed for the training of Machine Learning models. He also collaborates in the development of multiple projects in order to promote open data. In Spain, it has collaborated in the development of the platform HealthData 29, intended for the publication of open data to promote medical research.
We have interviewed Belén Gancedo, Director of Education at Microsoft Ibérica and member of the jury in the III edition of the Aporta Challenge,focused on the value of data for the education sector. We met with her to talk about the importance of digital education and innovative data-driven solutions, as well as the importance of open data in the business sector.
Complete interview:
1. What challenges in the education sector, to which it is urgent to respond, has the pandemic in Spain revealed?
Technology has become an essential element in the new way of learning and teaching. During the last months, marked by the pandemic, we have seen how a hybrid education model - face-to-face and remotely - has changed in a very short time. We have seen examples of centers that, in record time, in less than 2 weeks, have had to accelerate the digitization plans they already had in mind.
Technology has gone from being a temporary lifeline, enabling classes to be taught in the worst stage of the pandemic, to becoming a fully integrated part of the teaching methodology of many schools. According to a recent YouGov survey commissioned by Microsoft, 71% of elementary and middle school educators say that technology has helped them improve their methodology and improved their ability to teach. In addition, 82% of teachers report that the pace at which technology has driven innovation in teaching and learning has accelerated in the past year.
Before this pandemic, in some way, those of us who had been dedicating ourselves to education were the ones who defended the need to digitally transform the sector and the benefits that technology brought to it. However, the experience has served to make everyone aware of the benefits of the application of technology in the educational environment. In that sense, there has been an enormous advance. We have seen a huge increase in the use of our Teams tool, which is already used by more than 200 million students, teachers, and education staff around the world.
The biggest challenges, then, currently, are to not only take advantage of data and Artificial Intelligence to provide more personalized experiences and operate with greater agility, but also the integration of technology with pedagogy, which will allow more flexible, attractive learning experiences and inclusive. Students are increasingly diverse, and so are their expectations about the role of college education in their journey to employment.
The biggest challenges, then, currently, are to not only take advantage of data and Artificial Intelligence to provide more personalized experiences and operate with greater agility, but also the integration of technology with pedagogy, which will allow more flexible, attractive learning experiences and inclusive.
2. How can open data help drive these improvements? What technologies need to be implemented to drive improvements in the efficiency and effectiveness of the learning system?
Data is in all aspects of our lives. Although it may not be related to the mathematics or algorithm that governs predictive analytics, its impact can be seen in education by detecting learning difficulties before it is too late. This can help teachers and institutions gain a greater understanding of their students and information on how to help solve their problems.
Predictive analytics platforms and Artificial Intelligence technology have already been used with very positive results by different industries to understand user behavior and improve decision-making. With the right data, the same can be applied in classrooms. On the one hand, it helps to personalize and drive better learning outcomes, to create inclusive and personalized learning experiences, so that each student is empowered to succeed. If its implementation is correct, it allows a better and greater monitoring of the needs of the student, who becomes the center of learning and who will enjoy permanent support.
At Microsoft we want to be the ideal travel companion for the digital transformation of the education sector. We offer educational entities the best solutions -cloud and hardware- to prepare students for their professional future, in a complete environment of collaboration and communication for the classroom, both in face-to-face and online models. Solutions like Office 365 Education and the Surface device are designed precisely to drive collaboration both inside and outside the classroom. The educational version of Microsoft Teams makes a virtual classroom possible. It is a free tool for schools and universities that integrates conversations, video calls, content, assignments and applications in one place, allowing teachers to create learning environments that are lively and accessible from mobile devices,
And, in addition, we make available to schools, teachers and students devices specifically designed for the educational environment, such as the Surface Go 2, expressly designed for the educational environment. It is an evolutionary device, that is, it adapts to any educational stage and boosts the creativity of students thanks to its power, versatility and safety. This device allows the mobility of both teachers and students inside and outside the classroom; connectivity with other peripheral devices (printers, cameras ...); and includes the Microsoft Classroom Pen for natural writing and drawing in digital ink.
3. There is increasing demand for digital skills and competencies related to data. In this sense, the National Plan for Digital Skills, which includes the digitization of education and the development of digital skills for learning. What changes should be made in educational programs in order to promote the acquisition of digital knowledge by students?
Without a doubt, one of the biggest challenges we face today is the lack of training and digital skills. According to a study carried out by Microsoft and EY, 57% of the companies surveyed expect AI to have a high or very high impact in business areas that are "totally unknown to companies today."
There is a clear opportunity for Spain to lead in Europe in digital talent, consolidating itself as one of the most attractive countries to attract and retain this talent. A recent LinkedIn study anticipates that two million technology-related jobs will be created in Spain in the next five years, not only in the technology industry, but also,and above all, in companies in other sectors of activity that seek to incorporate the necessary talent to carry out their transformation. However, there is a shortage of professionals with skills and training in digital skills. According to data from the Digital Economy and Society Index Report published annually by the European Commission, Spain is below the European average in most of the indicators that refer to the digital skills of Spanish professionals.
There is, therefore, an urgent demand to train qualified talent with digital skills, data management, AI, machine learning ... Technology-related profiles are among the most difficult to find and, in the near future, those related to technology data analytics, cloud computing and application development.
For this, adequate training is necessary, not only in the way of teaching, but also in the curricular content. Any career, not just those in the STEM field, would need to include subjects related to technology and AI, which will define the future. The use of AI reaches any field, not only technology, therefore, students of any type of career -Law, Journalism ... - to give some examples of non-STEM careers, need qualified training in technology such as AI or data science, since they will have to apply it in their professional future.
We must bet on public-private collaborations and involve the technology industry, public administrations, the educational community, adapting the curricular contents of the University to the labor reality- and third sector entities, with the aim of promoting employability and professional recycling. In this way, the training of professionals in areas such as quantum computing, Artificial Intelligence, or data analytics and we can aspire to digital leadership.
In the next five years, two million technology-related jobs will be created in Spain, not only in the technology industry, but also, and above all, in companies in other sectors of activity that seek to incorporate the necessary talent to lead carry out your transformation.
4. Even today we find a disparity between the number of men and women who choose professional branches related to technology. What is needed to promote the role of women in technology?
According to the National Observatory of Telecommunications and Information Society -ONTSI- (July 2020), the digital gender gap has been progressively reduced in Spain, going from 8.1 to 1 point, although women maintain an unfavorable position in digital skills and Internet use. In advanced skills, such as programming, the gap in Spain is 6.8 points, the EU average being 8 points. The percentage of researchers in the ICT services sector drops to 23.4%. And in terms of the percentage of graduates in STEM, Spain ranks 12th within the EU, with a difference between the sexes of 17 points.
Without a doubt, there is still a long way to go. One of the main barriers that women face in the technology sector and when it comes to entrepreneurship are stereotypes and cultural tradition. The masculinized environment of technical careers and stereotypes about those who are dedicated to technology make them unattractive careers for women.
Digitization is boosting the economy and promoting business competitiveness,as well as generating an increase in the creation of specialized employment. Perhaps the most interesting thing about the impact of digitization on the labor market is that these new jobs are not only being created in the technology industry, but also in companies from all sectors, which need to incorporate specialized talent and digital skills.
Therefore, there is an urgent demand to train qualified talent with digital capabilities and this talent must be diverse. The woman cannot be left behind. It is time to tackle gender inequality, and alert everyone to this enormous opportunity, regardless of their gender. STEM careers are an ideal future option for anyone, regardless of gender.
Forfavor the female presence in the technology sector, in favor of a digital era without exclusion, at Microsoft we have launched different initiatives that seek to banish stereotypes and encourage girls and young people to take an interest in science and technology and make them see that they they can also be the protagonists of the digital society. In addition to the WONNOW Awards that we convened with CaixaBank, we also participate and collaborate in many initiatives, such as the Ada Byron Awards together with the University of Deusto, to help give visibility to the work of women in the STEM field, so that they are references of those who They are about to come.
The digital gender gap has been progressively reduced in Spain, going from 8.1 to 1 point, although women maintain an unfavorable position in digital skills and Internet use. In advanced skills, such as programming, the gap in Spain is 6.8 points, the EU average being 8 points.
5. How can initiatives like hackathons, challenge or challenges help drive data-driven innovation? How was your experience in the III Aporta Challenge?
These types of initiatives are key to that much-needed change. At Microsoft we are constantly organizing hackathons on a global, regional and local scale, to innovate in different priority areas for the company, such as education.
But we go further. We also use these tools in class. One of Microsoft's bets is the projects STEM hacking.These are projects in which the “maker” concept of learning by doing with programming and robotics is mixed, through the use of everyday materials. What's more,They are made up of activities that allow teachers to guide their students to construct and create scientific instruments and project-based tools to visualize data through science, technology, engineering, and mathematics. Our projects -both Hacking STEM as well as coding and computational language through the use of free tools such as Make Code- aim to bring programming and robotics to any subject in a transversal way, and why not, learn programming in a Latin class or in a biology one.
My experience in the III Aporta Challenge has been fantastic because it has allowed me to learn about incredible ideas and projects where the usefulness of the amount of data available becomes a reality and is put at the service of improving the education of all. There has been a lot of participation and, in addition, with very careful and worked presentations. The truth is that I would like to take this opportunity to thank everyone who has participated and also congratulate the winners.
6. A year ago, Microsoft launched a campaign to promote open data in order to close the gap between countries and companies that have the necessary data to innovate and those that do not. What has the project consisted of? What progress has been made?
Microsoft's global initiative Open Data Campaign seeks to help close the growing “data gap” between the small number of technology companies that benefit most from the data economy today and other organizations that are hampered by lack of access to data or lack of capabilities to use the ones you already have.
Microsoft believes that more needs to be done to help organizations share and collaborate around data so that businesses and governments can use it to meet the challenges they face, as the ability to share data has huge benefits. And not only for the business environment, but they also play a critical role in helping us understand and address major challenges, such as climate change, or health crises, such as the COVID-19 pandemic. To take full advantage of them, it is necessary to develop the ability to share them in a safe and reliable way, and to allow them to be used effectively.
Within the Open Data Campaign initiative, Microsoft has announced 5 great principles that will guide how the company itself approaches how to share its data with others:
- Open- Will work to make relevant data on large social issues as open as possible.
- Usable- Invest in creating new technologies and tools, governance mechanisms and policies so that data can be used by everyone.
- Boosters- Microsoft will help organizations generate value from their data and develop AI talent to use it effectively.
- Insurance- Microsoft will employ security controls to ensure data collaboration is secure at the operational level.
- Private- Microsoft will help organizations protect the privacy of individuals in data-sharing collaborations that involve personally identifiable information.
We continue to make progress in this regard. Last year, Microsoft Spain, next to Foundation 29, the Chair on Privacy and Digital Transformation Microsoft-Universitat de València and with the legal advice of the law firm J&A Garrigues have created the Guide "Health Data"that describes the technical and legal framework to carry out the creation of a public repository of health systems data, and that these can be shared and used in research environments and LaLiga is one of the entities that has shared, in June of this year, its anonymized data.
Data is the beginning of everything and one of our biggest responsibilities as a technology company is to help conserve the ecosystem on a large scale, on a planetary level. For this, the greatest challenge is to consolidate not only all the available data, but the artificial intelligence algorithms that allow access to it and allow making decisions, creating predictive models, scenarios with updated information from multiple sources. For this reason, Microsoft launched the concept of Planetary Computer, based on Open Data, to make more than 10 Petabytes of data - and growing - available to scientists, biologists, startups and companies, free of charge, from multiple sources (biodiversity, electrification , forestry, biomass, satellite), APIs, Development Environments and applications (predictive model, etc.) to create a greater impact for the planet.
Microsoft's global initiative Open Data Campaign seeks to help close the growing “data gap” between the small number of technology companies that benefit most from the data economy today and other organizations that are hampered by lack of access to data or lack of capabilities to use the ones you already have.
7. They also offer some open data sets through their Azure Open Datasets initiative. What kind of data do they offer? How can users use them?
This initiative seeks that companies improve the accuracy of the predictions of their Machine Learning models and reduce the time of data preparation, thanks to selected data sets of public access, ready to use and easily accessible from the Azure services.
There is data of all kinds: health and genomics, transport, labor and economy, population and security, common data ... that can be used in multiple ways. And it is also possible to contribute datasets to the community.
8. Which are the Microsoft's future plans for open data?
After a year with the Opendata campaign, we have had many learnings and, in collaboration with our partners, we are going to focus next year on practical aspects that make the process of data sharing easier. We just started publishing materials for organizations to see the nuts and bolts of how to start sharing data. We will continue to identify possible collaborations to solve social challenges on issues of sustainability, health, equity and inclusion. We also want to connect those who are working with data or want to explore that realm with the opportunities offered by the Microsoft Certifications in Data and Artificial Intelligence. And, above all, this issue requires a good regulatory framework and, for this, it is necessary that those who define the policies meet with the industry.
Documentación
1. Introduction
Data visualization is a task linked to data analysis that aims to graphically represent underlying data information. Visualizations play a fundamental role in the communication function that data possess, since they allow to drawn conclusions in a visual and understandable way, allowing also to detect patterns, trends, anomalous data or to project predictions, alongside with other functions. This makes its application transversal to any process in which data intervenes. The visualization possibilities are very numerous, from basic representations, such as a line graphs, graph bars or sectors, to complex visualizations configured from interactive dashboards.
Before we start to build an effective visualization, we must carry out a pre-treatment of the data, paying attention to how to obtain them and validating the content, ensuring that they do not contain errors and are in an adequate and consistent format for processing. Pre-processing of data is essential to start any data analysis task that results in effective visualizations.
A series of practical data visualization exercises based on open data available on the datos.gob.es portal or other similar catalogues will be presented periodically. They will address and describe, in a simple way; the stages necessary to obtain the data, perform the transformations and analysis that are relevant for the creation of interactive visualizations, from which we will be able summarize on in its final conclusions the maximum mount of information. In each of the exercises, simple code developments will be used (that will be adequately documented) as well as free and open use tools. All generated material will be available for reuse in the Data Lab repository on Github.
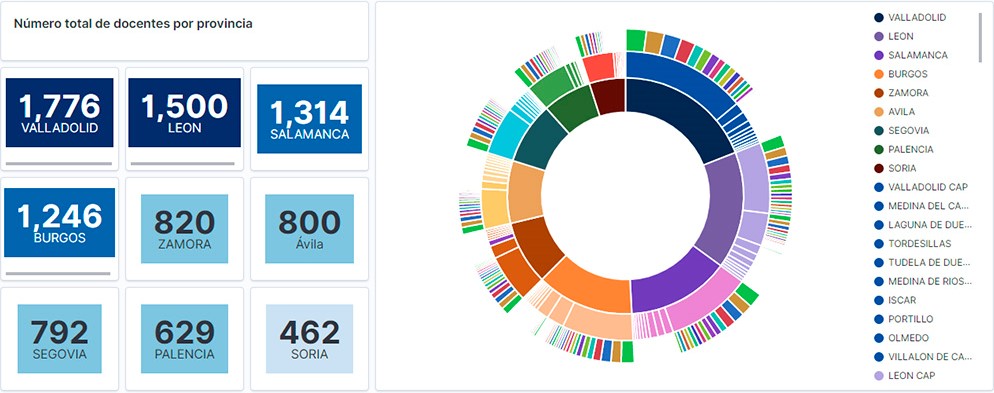
Visualization of the teaching staff of Castilla y León classified by Province, Locality and Teaching Specialty
2. Objetives
The main objective of this post is to learn how to treat a dataset from its download to the creation of one or more interactive graphs. For this, datasets containing relevant information on teachers and students enrolled in public schools in Castilla y León during the 2019-2020 academic year have been used. Based on these data, analyses of several indicators that relate teachers, specialties and students enrolled in the centers of each province or locality of the autonomous community.
3. Resources
3.1. Datasets
For this study, datasets on Education published by the Junta de Castilla y León have been selected, available on the open data portal datos.gob.es. Specifically:
- Dataset of the legal figures of the public centers of Castilla y León of all the teaching positions, except for the schoolteachers, during the academic year 2019-2020. This dataset is disaggregated by specialty of the teacher, educational center, town and province.
- Dataset of student enrolments in schools during the 2019-2020 academic year. This dataset is obtained through a query that supports different configuration parameters. Instructions for doing this are available at the dataset download point. The dataset is disaggregated by educational center, town and province.
3.2. Tools
To carry out this analysis (work environment set up, programming and writing) Python (versión 3.7) programming language and JupyterLab (versión 2.2) have been used. This tools will be found integrated in Anaconda, one of the most popular platforms to install, update or manage software to work with Data Science. All these tools are open and available for free.
JupyterLab is a web-based user interface that provides an interactive development environment where the user can work with so-called Jupyter notebooks on which you can easily integrate and share text, source code and data.
To create the interactive visualization, the Kibana tool (versión 7.10) has been used.
Kibana is an open source application that is part of the Elastic Stack product suite (Elasticsearch, Logstash, Beats and Kibana) that provides visualization and exploration capabilities of indexed data on top of the Elasticsearch analytics engine..
If you want to know more about these tools or others that can help you in the treatment and visualization of data, you can see the recently updated \"Data Processing and Visualization Tools\" report.
4. Data processing
As a first step of the process, it is necessary to perform an exploratory data analysis (EDA) to properly interpret the starting data, detect anomalies, missing data or errors that could affect the quality of subsequent processes and results. Pre-processing of data is essential to ensure that analyses or visualizations subsequently created from it are consistent and reliable.
Due to the informative nature of this post and to favor the understanding of non-specialized readers, the code does not intend to be the most efficient, but to facilitate its understanding. So you will probably come up with many ways to optimize the proposed code to get similar results. We encourage you to do so! You will be able to reproduce this analysis since the source code is available in our Github account. The way to provide the code is through a document made on JupyterLab that once loaded into the development environment you can execute or modify easily.
4.1. Installation and loading of libraries
The first thing we must do is import the libraries for the pre-processing of the data. There are many libraries available in Python but one of the most popular and suitable for working with these datasets is Pandas. The Pandas library is a very popular library for manipulating and analyzing datasets.
import pandas as pd 4.2. Loading datasets
First, we download the datasets from the open data catalog datos.gob.es and upload them into our development environment as tables to explore them and perform some basic data cleaning and processing tasks. For the loading of the data we will resort to the function read_csv(), where we will indicate the download url of the dataset, the delimiter (\"\";\"\" in this case) and, we add the parameter \"encoding\"\" that we adjust to the value \"\"latin-1\"\", so that it correctly interprets the special characters such as the letters with accents or \"\"ñ\"\" present in the text strings of the dataset.
#Cargamos el dataset de las plantillas jurídicas de los centros públicos de Castilla y León de todos los cuerpos de profesorado, a excepción de los maestros url = \"https://datosabiertos.jcyl.es/web/jcyl/risp/es/educacion/plantillas-centros-educativos/1284922684978.csv\"docentes = pd.read_csv(url, delimiter=\";\", header=0, encoding=\"latin-1\")docentes.head(3)#Cargamos el dataset de los alumnos matriculados en los centros educativos públicos de Castilla y León alumnos = pd.read_csv(\"matriculaciones.csv\", delimiter=\",\", names=[\"Municipio\", \"Matriculaciones\"], encoding=\"latin-1\") alumnos.head(3)The column \"\"Localidad\"\" of the table \"\"alumnos\"\" is composed of the code of the municipality and the name of the same. We must divide this column in two, so that its treatment is more efficient.
columnas_Municipios = alumnos[\"Municipio\"].str.split(\" \", n=1, expand = TRUE)alumnos[\"Codigo_Municipio\"] = columnas_Municipios[0]alumnos[\"Nombre_Munipicio\"] = columnas_Munipicio[1]alumnos.head(3)4.3. Creating a new table
Once we have both tables with the variables of interest, we create a new table resulting from their union. The union variables will be: \"\"Localidad\"\" in the table of \"\"docentes\"\" and \"\"Nombre_Municipio” in the table of \"\"alumnos\".
docentes_alumnos = pd.merge(docentes, alumnos, left_on = \"Localidad\", right_on = \"Nombre_Municipio\")docentes_alumnos.head(3)4.4. Exploring the dataset
Once we have the table that interests us, we must spend some time exploring the data and interpreting each variable. In these cases, it is very useful to have the data dictionary that always accompanies each downloaded dataset to know all its details, but this time we do not have this essential tool. Observing the table, in addition to interpreting the variables that make it up (data types, units, ranges of values), we can detect possible errors such as mistyped variables or the presence of missing values (NAs) that can reduce analysis capacity.
docentes_alumnos.info()In the output of this section of code, we can see the main characteristics of the table:
- Contains a total of 4,512 records
- It is composed of 13 variables, 5 numerical variables (integer type) and 8 categorical variables (\"object\" type)
- There is no missing of values.
Once we know the structure and content of the table, we must rectify errors, as is the case of the transformation of some of the variables that are not properly typified, for example, the variable that houses the center code (\"Código.centro\").
docentes_alumnos.Codigo_centro = data.Codigo_centro.astype(\"object\")docentes_alumnos.Codigo_cuerpo = data.Codigo_cuerpo.astype(\"object\")docentes_alumnos.Codigo_especialidad = data.Codigo_especialidad.astype(\"object\")Once we have the table free of errors, we obtain a description of the numerical variables, \"\"Plantilla\" and \"\"Matriculaciones\", which will help us to know important details. In the output of the code that we present below we observe the mean, the standard deviation, the maximum and minimum number, among other statistical descriptors.
docentes_alumnos.describe()4.5. Save the dataset
Once we have the table free of errors and with the variables that we are interested in graphing, we will save it in a folder of our choice to use it later in other analysis or visualization tools. We will save it in CSV format encoded as UTF-8 (Unicode Transformation Format) so that special characters are correctly identified by any tool we might use later.
df = pd.DataFrame(docentes_alumnos)filname = \"docentes_alumnos.csv\"df.to_csv(filename, index = FALSE, encoding = \"utf-8\")5. Creation of the visualization on the teachers of the public educational centers of Castilla y León using the Kibana tool
For the realization of this visualization, we have used the Kibana tool in our local environment. To do this it is necessary to have Elasticsearch and Kibana installed and running. The company Elastic makes all the information about the download and installation available in this tutorial.
Attached below are two video tutorials, which shows the process of creating the visualization and the interaction with the generated dashboard.
In this first video, you can see the creation of the dashboard by generating different graphic representations, following these steps:
- We load the table of previously processed data into Elasticsearch and generate an index that allows us to interact with the data from Kibana. This index allows search and management of data, practically in real time.
- Generation of the following graphical representations:
- Graph of sectors where to show the teaching staff by province, locality and specialty.
- Metrics of the number of teachers by province.
- Bar chart, where we will show the number of registrations by province.
- Filter by province, locality and teaching specialty.
- Construction of the dashboard.
In this second video, you will be able to observe the interaction with the dashboard generated previously.
6. Conclusions
Observing the visualization of the data on the number of teachers in public schools in Castilla y León, in the academic year 2019-2020, the following conclusions can be obtained, among others:
- The province of Valladolid is the one with both the largest number of teachers and the largest number of students enrolled. While Soria is the province with the lowest number of teachers and the lowest number of students enrolled.
- As expected, the localities with the highest number of teachers are the provincial capitals.
- In all provinces, the specialty with the highest number of students is English, followed by Spanish Language and Literature and Mathematics.
- It is striking that the province of Zamora, although it has a low number of enrolled students, is in fifth position in the number of teachers.
This simple visualization has helped us to synthesize a large amount of information and to obtain a series of conclusions at a glance, and if necessary, make decisions based on the results obtained. We hope you have found this new post useful and we will return to show you new reuses of open data. See you soon!
Noticia
A symptom of the maturity of an open data ecosystem is the possibility of finding datasets and use cases across different sectors of activity. This is considered by the European Open Data Portal itself in its maturity index. The classification of data and their uses by thematic categories boosts re-use by allowing users to locate and access them in a more targeted way. It also allows needs in specific areas to be detected, priority sectors to be identified and impact to be estimated more easily.
In Spain we find different thematic repositories, such as UniversiData, in the case of higher education, or TURESPAÑA, for the tourism sector. However, the fact that the competences of certain subjects are distributed among the Autonomous Communities or City Councils complicates the location of data on the same subject.
Datos.gob.es brings together the open data of all the Spanish public bodies that have carried out a federation process with the portal. Therefore, in our catalogue you can find datasets from different publishers segmented by 22 thematic categories, those considered by the Technical Interoperability Standard.
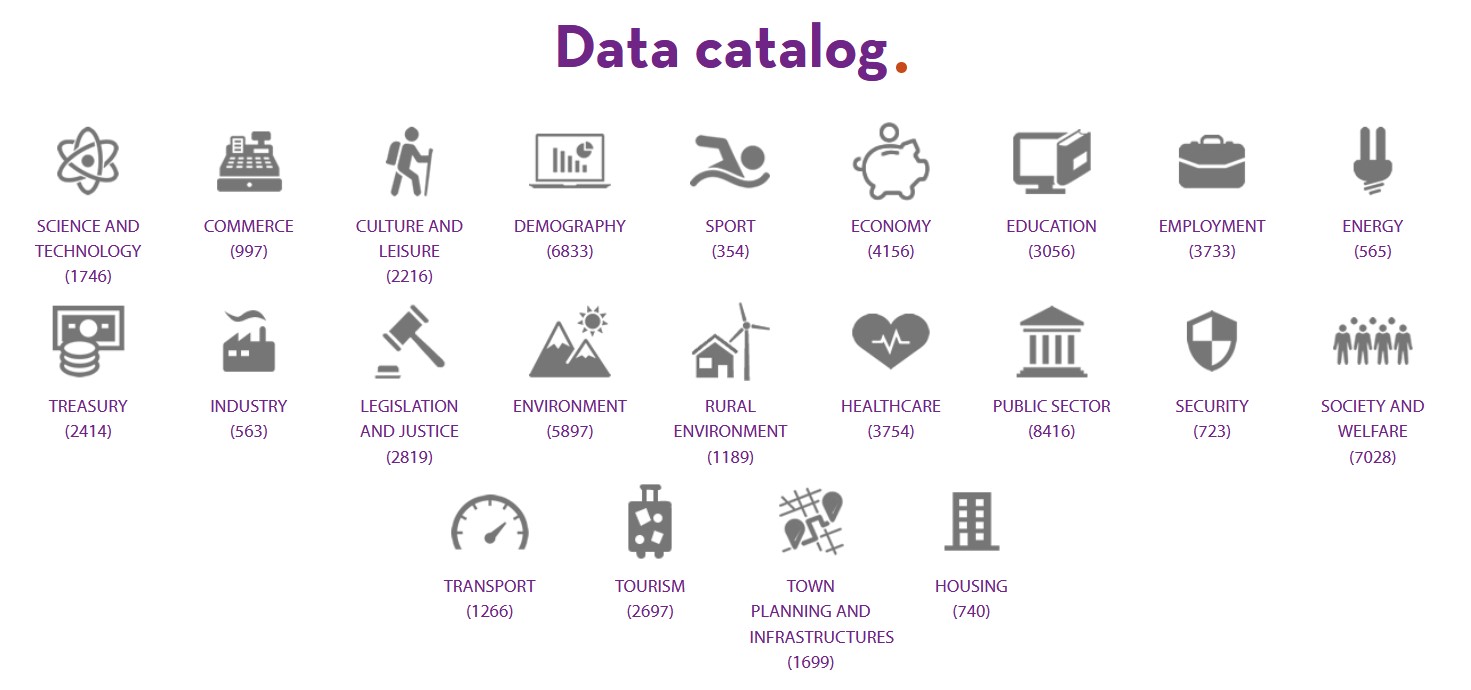
Number of datasets by category as of June 2021
But in addition to showing the datasets divided by subject area, it is also important to show highlighted datasets, use cases, guides and other help resources by sector, so that users can more easily access content related to their areas of interest. For this reason, at datos.gob.es we have launched a series of web sections focused on different sectors of activity, with specific content for each area.
4 sectorial sections that will be gradually extended to other areas of interest
Currently in datos.gob.es you can find 4 sectors: Environment, Culture and leisure, Education and Transport. These sectors have been highlighted for different strategic reasons:
- Environment: Environmental data are essential to understand how our environment is changing in order to fight climate change, pollution and deforestation. The European Commission itself considers environmental data to be highly valuable data in Directive 2019/1024. At datos.gob.es you can find data on air quality, weather forecasting, water scarcity, etc. All of them are essential to promote solutions for a more sustainable world.
- Transport: Directive 2019/1024 also highlights the importance of transport data. Often in real time, this data facilitates decision-making aimed at efficient service management and improving the passenger experience. Transport data are among the most widely used data to create services and applications (e.g. those that inform about traffic conditions, bus timetables, etc.). This category includes datasets such as real-time traffic incidents or fuel prices.
- Education: With the advent of COVID-19, many students had to follow their studies from home, using digital solutions that were not always ready. In recent months, through initiatives such as the Aporta Challenge, an effort has been made to promote the creation of solutions that incorporate open data in order to improve the efficiency of the educational sphere, drive improvements - such as the personalisation of education - and achieve more universal access to knowledge. Some of the education datasets that can be found in the catalogue are the degrees offered by Spanish universities or surveys on household spending on education.
- Culture and leisure: Culture and leisure data is a category of great importance when it comes to reusing it to develop, for example, educational and learning content. Cultural data can help generate new knowledge to help us understand our past, present and future. Examples of datasets are the location of monuments or listings of works of art.
Structure of each sector
Each sector page has a homogeneous structure, which facilitates the location of contents also available in other sections.
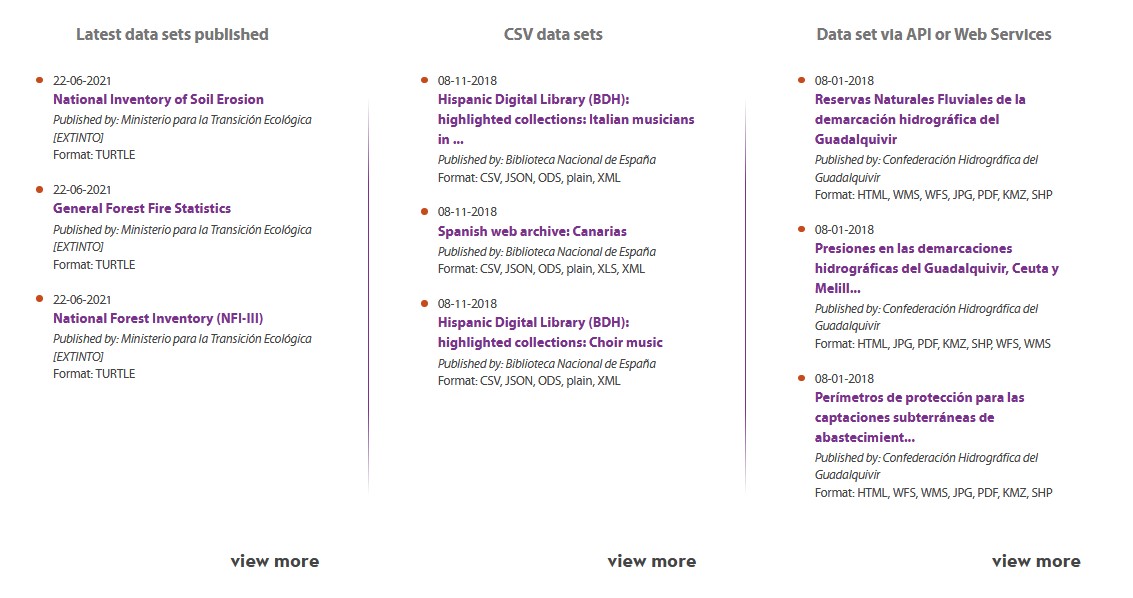
It starts with a highlight where you can see some examples of outstanding datasets belonging to this category, and a link to access all the datasets of this subject in the catalogue.
It continues with news related to the data and the sector in question, which can range from events or information on specific initiatives (such as Procomún in the field of educational data or the Green Deal in the environment) to the latest developments at strategic and operational level.
Finally, there are three sections related to use cases: innovation, reusing companies and applications. In the first section, articles provide examples of innovative uses, often linked to disruptive technologies such as Artificial Intelligence. In the last two sections, we find specific files on companies and applications that use open data from this category to generate a benefit for society or the economy.
Highlights section on the home page
In addition to the creation of sectoral pages, over the last year, datos.gob.es has also incorporated a section of highlighted datasets. The aim is to give greater visibility to those datasets that meet a series of characteristics: they have been updated, are in CSV format or can be accessed via API or web services.
What other sectors would you like to highlight?
The plans of datos.gob.es include continuing to increase the number of sectors to be highlighted. Therefore, we invite you to leave in comments any proposal you consider appropriate.
Blog
The Hercules initiative was launched in November 2017, through an agreement between the University of Murcia and the Ministry of Economy, Industry and Competitiveness, with the aim of developing a Research Management System (RMS) based on semantic open data that offers a global view of the research data of the Spanish University System (SUE), to improve management, analysis and possible synergies between universities and the general public.
This initiative is complementary to UniversiDATA, where several Spanish universities collaborate to promote open data in the higher education sector by publishing datasets through standardised and common criteria. Specifically, a Common Core is defined with 42 dataset specifications, of which 12 have been published for version 1.0. Hercules, on the other hand, is a research-specific initiative, structured around three pillars:
- Innovative SGI prototype
- Unified knowledge graph (ASIO) 1],
- Data Enrichment and Semantic Analysis (EDMA)
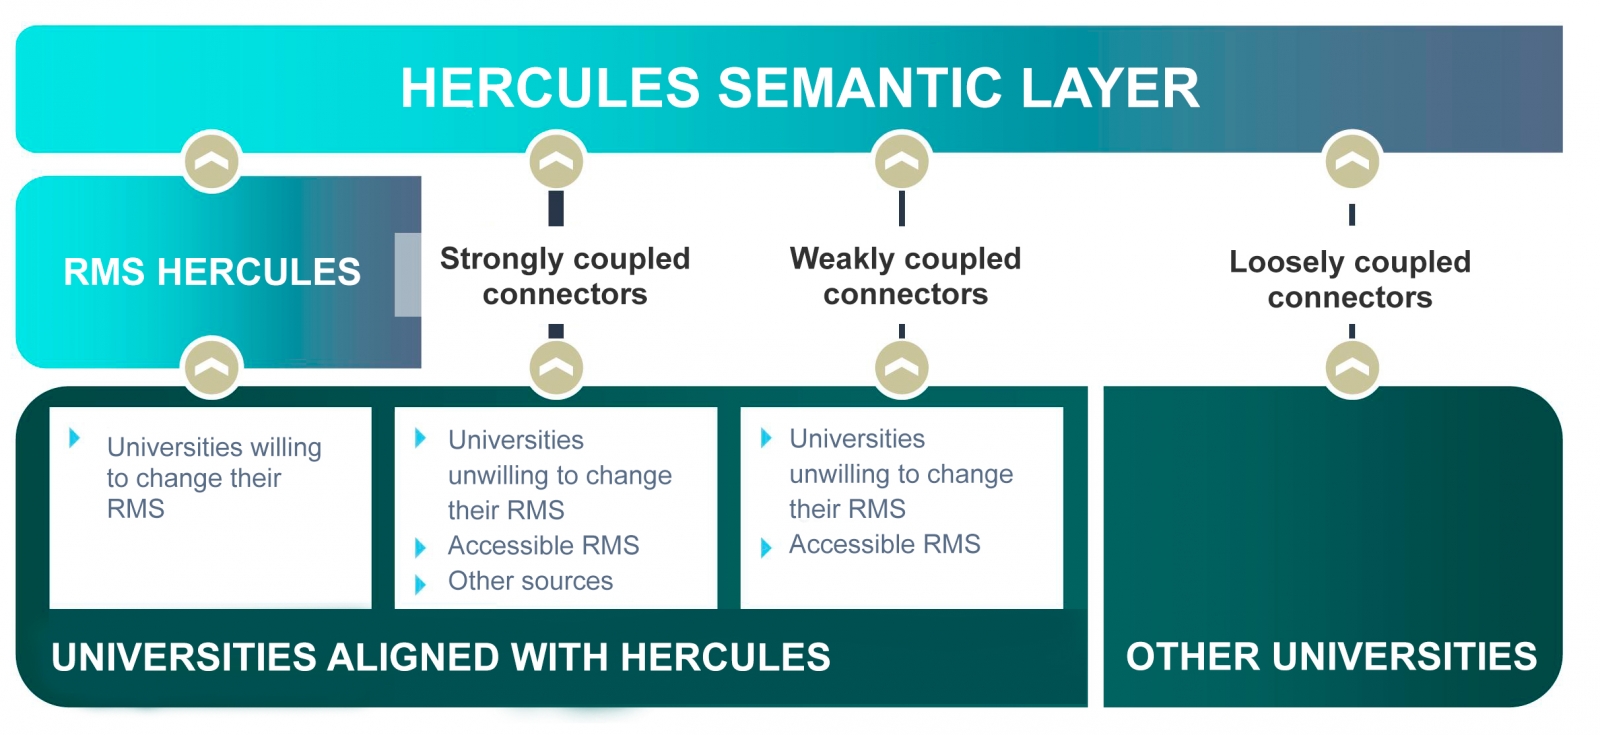
The ultimate goal is the publication of a unified knowledge graph integrating all research data that participating universities wish to make public. Hercules foresees the integration of universities at different levels, depending on their willingness to replace their RMS with the Hercules RMS. In the case of external RMSs, the degree of accessibility they offer will also have an impact on the volume of data they can share through the unified network.
General organisation chart of the Hercule initiative
Within the Hercules initiative, the ASIO Project (Semantic Architecture and Ontology Infrastructure) is integrated. The purpose of this sub-project is to define an Ontology Network for Research Management (Ontology Infrastructure). An ontology is a formal definition that describes with fidelity and high granularity a particular domain of discussion. In this case, the research domain, which can be extrapolated to other Spanish and international universities (at the moment the pilot is being developed with the University of Murcia). In other words, the aim is to create a common data vocabulary.
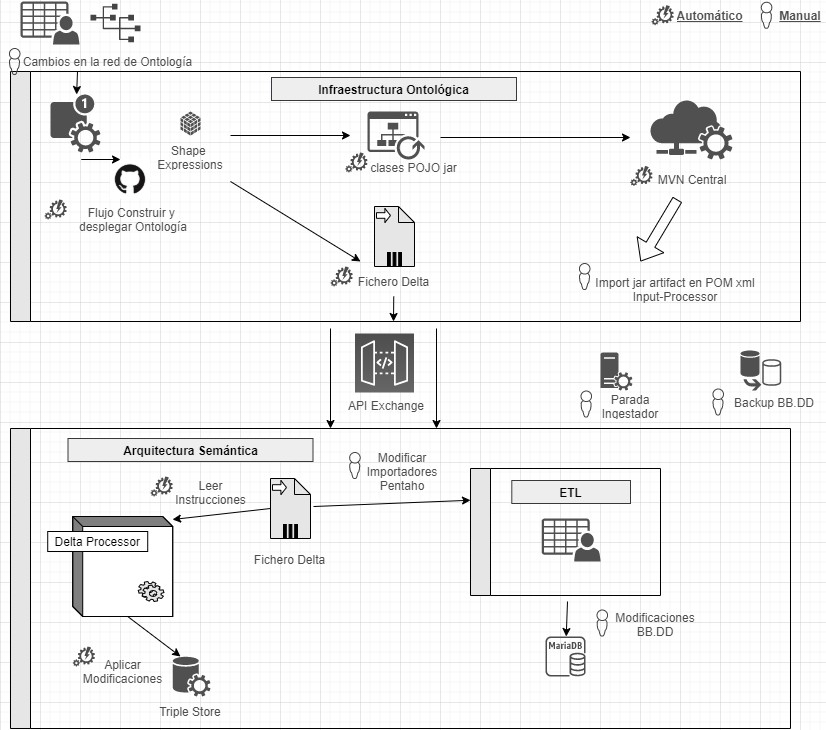
Additionally, through the Semantic Data Architecture module, an efficient platform has been developed to store, manage and publish SUE research data, based on ontologies, with the capacity to synchronise instances installed in different universities, as well as the execution of distributed federated queries on key aspects of scientific production, lines of research, search for synergies, etc.
As a solution to this innovation challenge, two complementary lines have been proposed, one centralised (synchronisation in writing) and the other decentralised (synchronisation in consultation). The architecture of the decentralised solution is explained in detail in the following sections.
Domain Driven Design
The data model follows the Domain Driven Design approach, modelling common entities and vocabulary, which can be understood by both developers and domain experts. This model is independent of the database, the user interface and the development environment, resulting in a clean software architecture that can adapt to changes in the model.
This is achieved by using Shape Expressions (ShEx), a language for validating and describing RDF datasets, with human-readable syntax. From these expressions, the domain model is automatically generated and allows orchestrating a continuous integration (CI) process, as described in the following figure.
Continuous integration process using Domain Driven Design (just available in Spanish)
By means of a system based on version control as a central element, it offers the possibility for domain experts to build and visualise multilingual ontologies. These in turn rely on ontologies both from the research domain: VIVO, EuroCRIS/CERIF or Research Object, as well as general purpose ontologies for metadata tagging: Prov-O, DCAT, etc.
Linked Data Platform
The linked data server is the core of the architecture, in charge of rendering information about all entities. It does this by collecting HTTP requests from the outside and redirecting them to the corresponding services, applying content negotiation, which provides the best representation of a resource based on browser preferences for different media types, languages, characters and encoding.
All resources are published following a custom-designed persistent URI scheme. Each entity represented by a URI (researcher, project, university, etc.) has a series of actions to consult and update its data, following the patterns proposed by the Linked Data Platform (LDP) and the 5-star model.
This system also ensures compliance with the FAIR (Findable, Accessible, Interoperable, Reusable) principles and automatically publishes the results of applying these metrics to the data repository.
Open data publication
The data processing system is responsible for the conversion, integration and validation of third-party data, as well as the detection of duplicates, equivalences and relationships between entities. The data comes from various sources, mainly the Hercules unified RMS, but also from alternative RMSs, or from other sources offering data in FECYT/CVN (Standardised Curriculum Vitae), EuroCRIS/CERIF and other possible formats.
The import system converts all these sources to RDF format and registers them in a specific purpose repository for linked data, called Triple Store, because of its capacity to store subject-predicate-object triples.
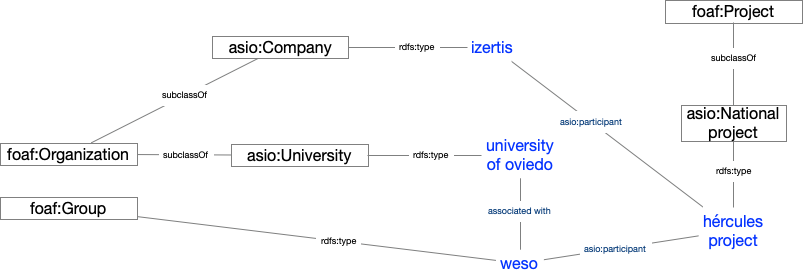
Once imported, they are organised into a knowledge graph, easily accessible, allowing advanced searches and inferences to be made, enhanced by the relationships between concepts.
Example of a knowledge network describing the ASIO project
Results and conclusions
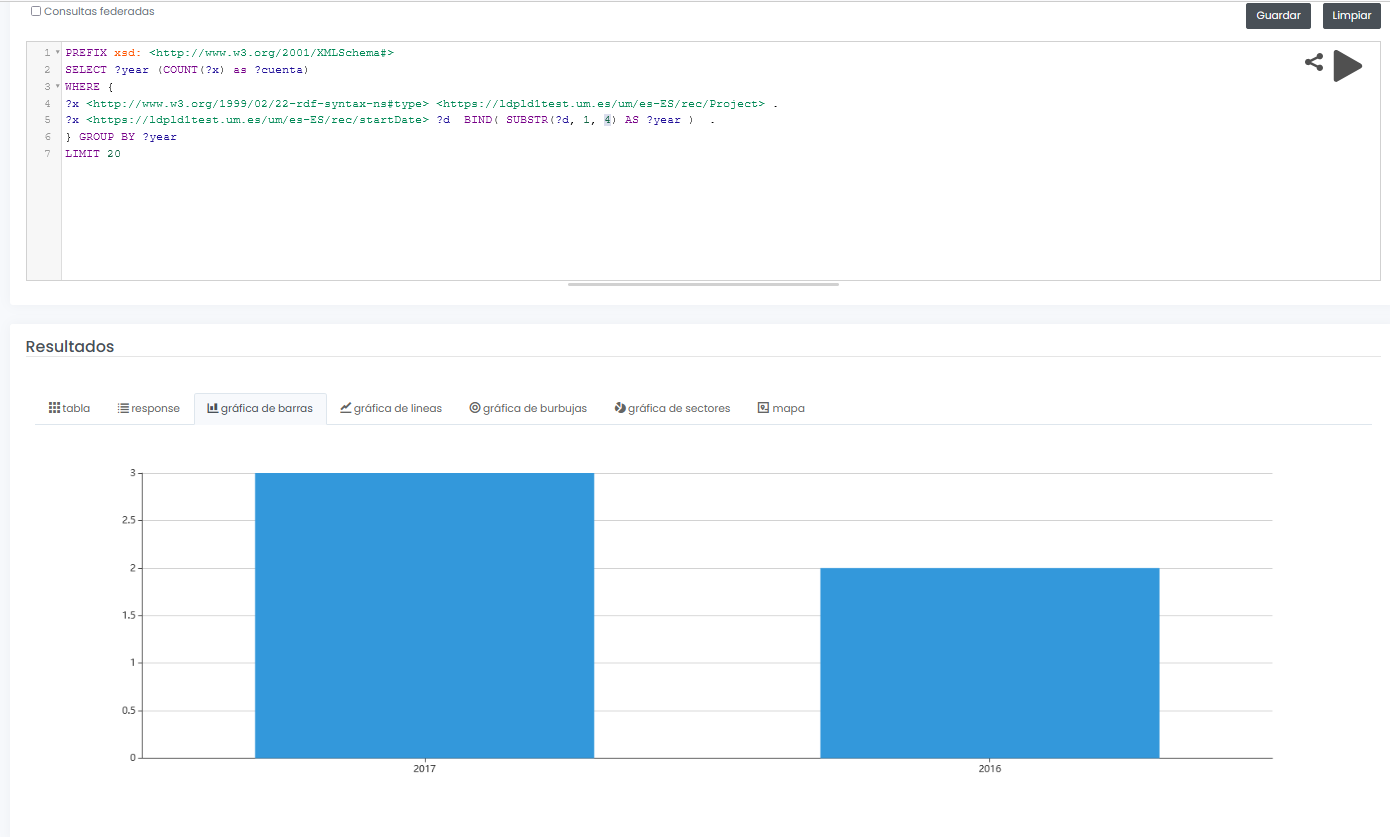
The final system not only allows to offer a graphical interface for interactive and visual querying of research data, but also to design SPARQL queries, such as the one shown below, even with the possibility to run the query in a federated way on all nodes of the Hercules network, and to display results dynamically in different types of graphs and maps.
In this example, a query is shown (with limited test data) of all available research projects grouped graphically by year:
PREFIX xsd: <http://www.w3.org/2001/XMLSchema#>
SELECT ?year (COUNT(?x) as ?cuenta)
WHERE {
?x <http://www.w3.org/1999/02/22-rdf-syntax-nes#type> <https://ldpld1test.um.es/um/es-ES/rec/Project> .
?x <https://ldpld1test.um.es/um/es-ES/rec/startDate> ?d BIND(SUBSTR(?d, 1, 4) as ?year) .
} GROUP BY ?year LIMIT 20
LIMIT 20
Ejemplo de consulta SPARQL con resultado gráfico
In short, ASIO offers a common framework for publishing linked open data, offered as open source and easily adaptable to other domains. For such adaptation, it would be enough to design a specific domain model, including the ontology and the import and validation processes discussed in this article.
Currently the project, in its two variants (centralised and decentralised), is in the process of being put into pre-production within the infrastructure of the University of Murcia, and will soon be publicly accessible.
[1 Graphs are a form of knowledge representation that allow concepts to be related through the integration of data sets, using semantic web techniques. In this way, the context of the data can be better understood, which facilitates the discovery of new knowledge.
Content prepared by Jose Barranquero, expert in Data Science and Quantum Computing.
The contents and views expressed in this publication are the sole responsibility of the author.
Entrevista
During 2020 the education sector has been exposed to great changes due to the global pandemic. Homes were transformed into classrooms, which was a challenge for everyone involved in the educational ecosystem.
The COTEC Foundation, a private non-profit organization charged with promoting innovation for economic and social development, closely followed this situation. Already in April, they published the first report "COVID 19 AND EDUCATION I: problems, responses and scenarios", where the educational challenges derived from the health emergency were analyzed and various action scenarios were proposed. It was then followed by "Covid-19 and Education II: homeschooling and inequality" and "Covid-19 and Education II: homeschooling and inequality."
We have spoken with Ainara Zubillaga, Director of Education and Training of the COTEC Foundation and co-author of the report, to analyze the situation of Spanish R&D in general and to tell us about the current situation and the evolution that our system is expected to experience. education in the years to come thanks to technology and data.
Complete interview
1. In March 2020, schools closed practically overnight. What challenges did this situation bring to light?
The closure of schools made visible the seams of the educational system. Problems that did not exist did not emerge, but it did put the magnifying glass on the structural deficits that already existed, just as it has accelerated trends that were knocking on the door.
The impact of the closure of educational centers has been twofold: educational and social. From the educational perspective, it has revealed the overload of our curriculum, a volume of content that is not capable of being addressed under normal conditions, which further complicated development in a remote education setting. Digitization has been the great challenge that schools and teachers have faced: from lack of resources (platforms, applications, digitization of materials, etc.), to little teacher training that has been forced to migrate their activity daily teacher to a format and a channel that many were unaware of how it works and how to take advantage of it didactically.
And from the social perspective, the closure of schools has made the educational gap visible, which has been shown to the general public through the digital gap. It is not only reduced to it, but it is what has allowed everyone to see the problems of equity and educational segregation beyond the classroom. The data are clear: it is fundamentally the socioeconomic level, the variable that affects the three digital gaps -access, use and center-, above comparisons with other countries or between Autonomous Communities.
2. When reviewing the educational policies of the different Autonomous Communities, what aspects could help to alleviate the different gaps detected and also avoid disparities between territories?
The most obvious seems to be any action linked to the reduction of the digital divide, but in its broadest sense, that is, we are not only talking about the provision of devices and the guarantee of connectivity, but also about digital competence and the didactic use of technologies.
And the other great aspect, without a doubt, are all the school reinforcement and support programs. The first data that we began to have on the impact of school closings in terms of learning loss clearly show that there is a significantly higher incidence on the most vulnerable students. The gaps that already existed, therefore, are widening, and it is necessary to reverse the trend.
3. In what way can open data drive improvements in the education sector that help overcome these challenges?
Data is a fundamental element for the transparency and evaluation of the functioning of the educational system and its policies. Only evidence on the degree of impact and operation of public policies can help us both to focus investments correctly, and to reinforce what does not work.
On the other hand, open data allows the different Ministries to share information, share good practices, and, ultimately, make public administration more efficient and put it at the service of the citizen. The COVID-19 AND EDUCATION III study: the response of the Administrations, which we launched from Cotec last December, reflects among its conclusions that a more accessible, transparent, direct and coordinated information system is necessary that allows sharing, replicating and transmitting good practices within the educational Administration.
Data is a fundamental element for the transparency and evaluation of the functioning of the educational system and its policies, which allow the sharing of information and good practices to make public administration more efficient.
4. Be part of the jury of the Aporta 2020 Challenge, which this year has focused on finding solutions based on data that help solve challenges in the education system. Can you tell us something about the solutions presented?
The proposals that have been submitted to the contest are an example of those trends that have accelerated and that I discussed earlier. They are clear examples, for the most part, of solutions aimed at the personalization of learning, which is undoubtedly one of the lines of development of digitization in education, and is thus also included in the Educa en Digital program of the Ministry of Education itself.
The personalization of the learning process is a clear example of the added value that technology brings to education: not only does it allow adjusting what is taught and how to the student and their needs, but also frees the teacher from routine monitoring functions, allowing you to focus on a more personalized attention, especially in those students who need more support.
5. You have just started the project La escuela, lo primero, what can you tell us about it?
La escuela, lo primero” is an innovation project whose objective is to offer the Administration, educational centers, teaching staff, and other institutions, the necessary tools to face the challenges faced by the educational system, the different scenarios and situations - face-to-face and at a distance - derived from the Covid-19 pandemic.
We started in July, with the first edition of the teaching innovation laboratories, and we have had the participation of more than 200 teachers from all over Spain, who have generated more than thirty proposals, all of them innovative solutions that include games, guides, decalogues or virtual resources, valid to be applied in any school.
The practical proposals address, among other challenges, the transfer of active methodologies to the virtual environment, the organization of times and spaces in a flexible way, the promotion of collaborative remote work, promoting student autonomy, reinforcing special educational needs or promoting coexistence.
"La escuela, lo primero" is an innovation project that offers tools to face the challenges faced by the educational system.
6. What other projects related to the educational field have you started or are you planning to develop?
We continue with our work of analysis and design of solutions and proposals aimed at responding to all the challenges that have arisen from the pandemic. The teaching laboratories at La Escuela Lo Primero are not only continuing, but will be completed with follow-up others that allow us to evaluate the implementation of the proposed solutions: what has worked and what has not, how has this peculiar course evolved, what new Challenges have arisen… and all this aimed at defining the lines of that school that we want to build.
And from the dimension most linked to public policies, we are working on the preparation of a Digitization Plan, which we hope will give guidance to both the Administration and the centers, in this process that is sometimes not being approached in the most appropriate way.
7. The COTEC Foundation prepares a report each year on the I+D situation in Spain. This year's report shows that R&D has gained weight in the production structure for the second consecutive year. What are we doing well in Spain? What is left to do?
If we look at the country as a whole, the data tell us that we are not a particularly innovative country (we occupy middle positions in international rankings, which do not correspond to the positions we have as an economic or scientific power).
Now, if our point of view goes down from the country scale to the individual scale, from the institutional to the personal, the perspective changes. In both the public and private sectors, innovative initiatives are proliferating increasingly, driven by strong creativity and individual enthusiasm. And to this is added that many of them are being developed in environments and through channels outside the classical structure of the science, technology and university system. Therefore, I believe that we are good individually, in projects that act as catalysts, but that, lacking a properly defined, articulated, connected and coordinated system, we lose strength in collective change.
And something similar happens in education: we have a gap between an innovative vocation of a large part of the teaching staff, reflected in this multitude of pilot projects and experiences, and the innovative performance of schools and the system as a whole. And that slows down the transformation of the educational system as a whole.
In both the public and private sectors, innovative initiatives are proliferating increasingly, driven by strong creativity and individual enthusiasm.
8. This year's COTEC report also highlights that Spain has a higher rate than the European average in STEM graduates, but with a much wider gender gap, what can we do to reverse this situation?
It seems clear that there is a gap between technology and women (and I emphasize technology because, for example, it is not produced in the health field, which is also another STEM, scientific area, but it does have a significant female presence). I think that this distancing is generated by the discourse underlying technology, which is focused on the device (the what), not on the process (the what for). We need to clearly link the purpose of technologies, contextualize them, give them a greater sense and social focus, and I believe that in this way we would minimize the distance that the general population and women in participating have towards technology. It would allow approaching the problem from another perspective: it is not about bringing women closer to technology, but about bringing technology closer to women.
Noticia
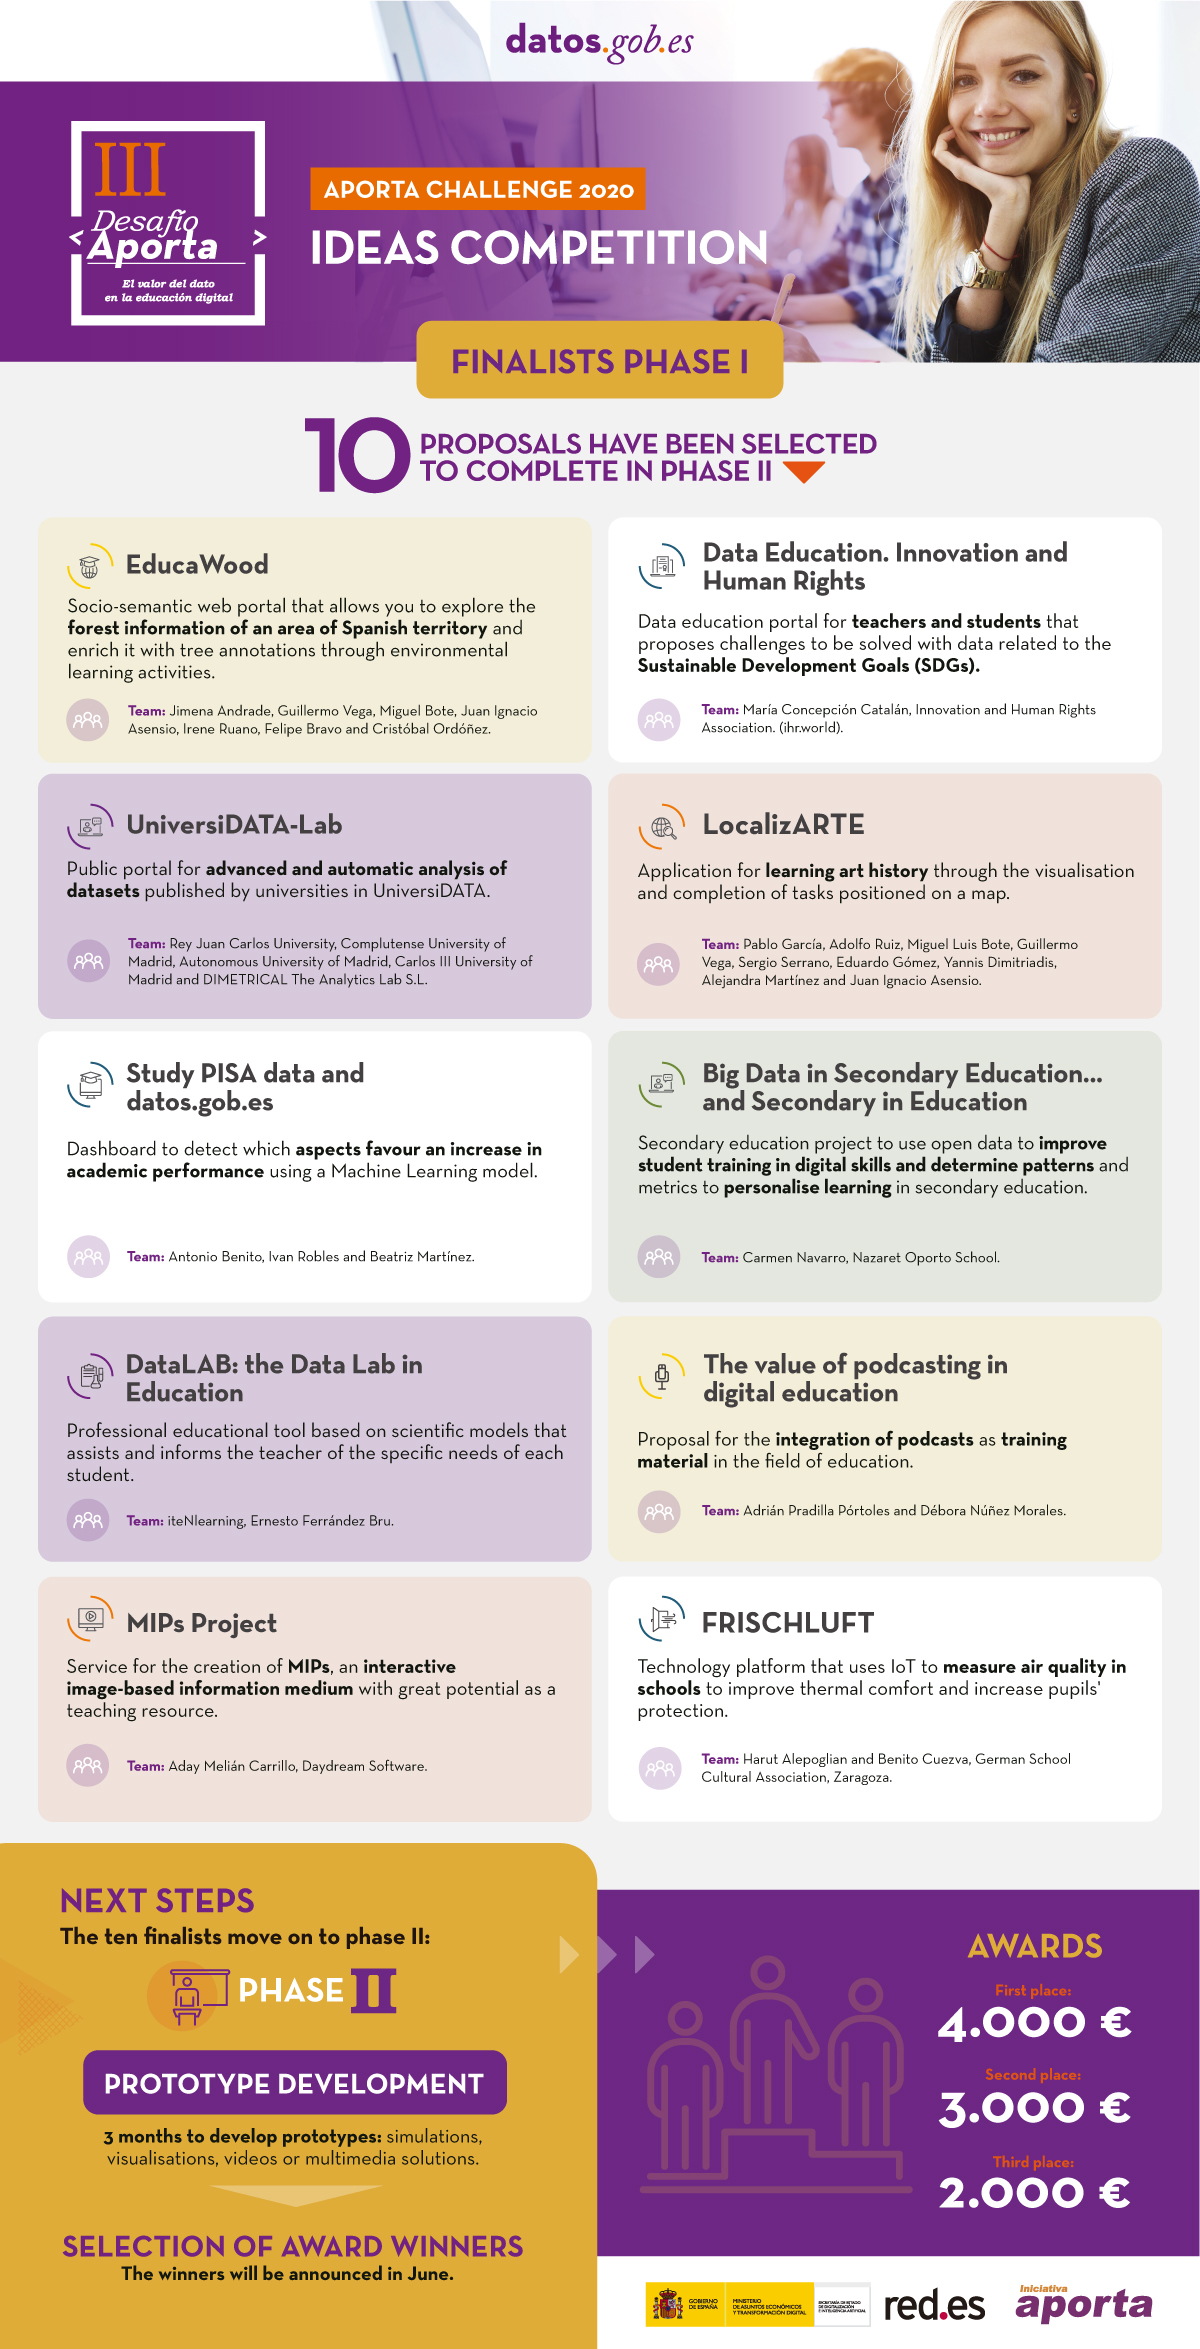
Last October, the Aporta Initiative, together with the Secretary of State for Digitalization and Artificial Intelligence and Red.es, launched the third edition of the Aporta Challenge. Under the slogan "The value of data in digital education", the aim was to reward ideas and prototypes capable of identifying new opportunities to capture, analyse and use data intelligence in the development of solutions in the field of education.
Among the proposals submitted in Phase I, there were a wide range of entries. From individuals to university academic teams, educational institutions and private companies, which have devised web platforms, mobile applications and interactive solutions with data analytics and machine learning techniques as protagonists.
A jury of renowned prestige has been in charge of evaluating the proposals submitted based on a series of public criteria. The 10 solutions selected as finalists are:
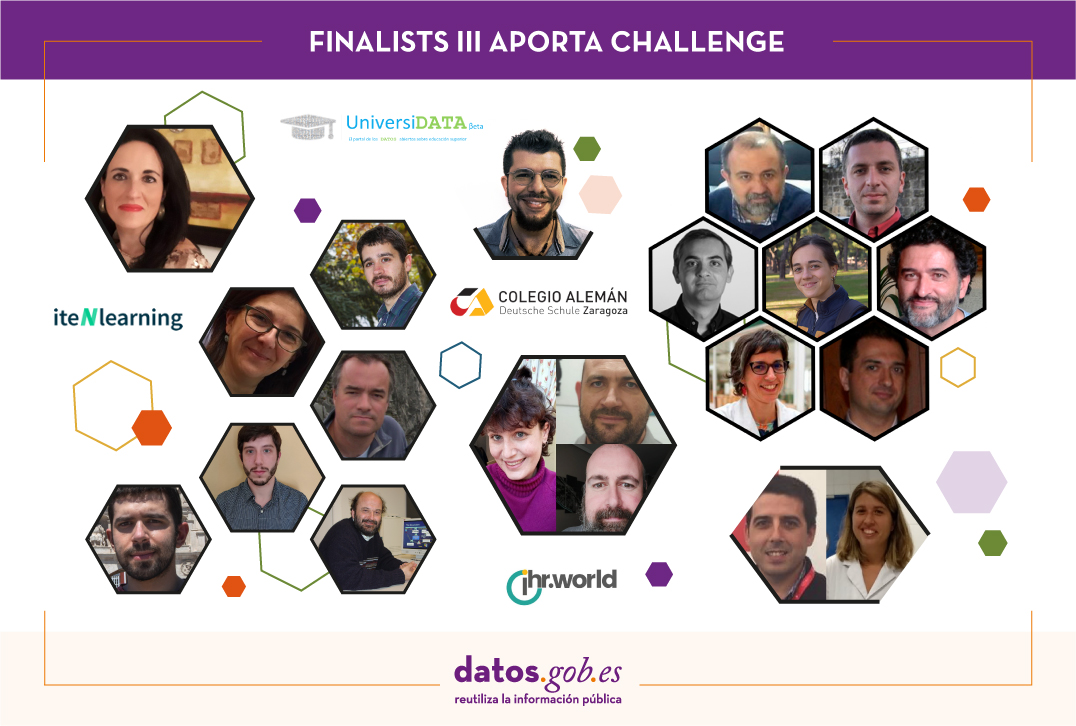
EducaWood
- Team: Jimena Andrade, Guillermo Vega, Miguel Bote, Juan Ignacio Asensio, Irene Ruano, Felipe Bravo and Cristóbal Ordóñez.
What is it?
EducaWood is a socio-semantic web portal that allows to explore the forest information of an area of the Spanish territory and to enrich it with tree annotations. Teachers can propose environmental learning activities contextualized to their environment. Students carry out these activities during field visits by means of tree annotations (location and identification of species, measurements, microhabitats, photos, etc.) through their mobile devices. In addition, EducaWood allows virtual field visits and remote activities with the available forestry information and annotations generated by the community, thus enabling its use by vulnerable groups and in Covid scenarios.
EducaWood uses sources such as the Spanish Forest Map, the National Forest Inventory or GeoNames, which have been integrated and republished as linked open data. The annotations generated by the students' activities will also be published as linked open data, thus contributing to community benefit.
Data Education. Innovation and Human Rights.
- Team: María Concepción Catalán, Asociación Innovación y Derechos Humanos (ihr.world).
What is it?
This proposal presents a data education web portal for students and teachers focused on the Sustainable Development Goals (SDGs). Its main objective is to propose to its users different challenges to be solved through the use of data, such as 'What were women doing in Spain in 1920' or 'How much energy is needed to maintain a farm of 200 pigs'.
This initiative uses data from various sources such as the UN, the World Bank, Our World in Data, the European Union and each of its countries. In the case of Spain, it uses data from datos.gob.es and INE, among others.
UniversiDATA-Lab
- Team: Rey Juan Carlos University, Complutense University of Madrid, Autonomous University of Madrid, Carlos III University of Madrid and DIMETRICAL The Analytics Lab S.L.
What is it?
UniversiDATA-Lab is a public and open portal whose function is to host a catalog of advanced and automatic analyses of the datasets published in the UniversiDATA portal, and which is the result of the collaborative work of universities. It arises as a natural evolution of the current "laboratory" section of UniversiDATA, opening the scope of potential analysis to all present and future datasets/universities, in order to improve the aspects analysed and encourage universities to be laboratories of citizenship, providing a differential value to society.
All the datasets that universities are publishing or will publish in UniversiDATA are potentially usable to carry out in-depth analyses, always considering the respect for the protection of personal data. The specific sources of the analyses will be published on GitHub to encourage the collaboration of other users to contribute improvements.
LocalizARTE
- Team: Pablo García, Adolfo Ruiz, Miguel Luis Bote, Guillermo Vega, Sergio Serrano, Eduardo Gómez, Yannis Dimitriadis, Alejandra Martínez and Juan Ignacio Asensio.
What is it?
This web application pursues the learning of art history through different educational environments. It allows students to visualize and perform geotagged tasks on a map. Teachers can propose new tasks, which are added to the public repository, as well as select the tasks that may be more interesting for their students and visualize the ones they perform. On the other hand, a mobile version of LocalizARTE will be developed in the future, in which the user will need to be close to the place where the tasks are geotagged in order to perform them.
The open data used in the first version of LocalizARTE comes from the list of historical monuments of Castilla y León, DBpedia, Wikidata, Casual Learn SPARQL and OpenStreetMap.
Study PISA data and datos.gob.es
- Team: Antonio Benito, Iván Robles and Beatriz Martínez.
What is it?
This project is based on the creation of a dashboard that allows to view information from the PISA report, conducted by the OECD, or other educational assessments along with data provided by datos.gob.es of socioeconomic, demographic, educational or scientific scope. The objective is to detect which aspects favour an increase in academic performance using a machine learning model, so that effective decision-making can be carried out. The idea is that schools themselves can adapt their educational practices and curricula to the learning needs of students to ensure greater success.
This application uses various open data from INE, the Ministry of Education and Vocational Training or PISA Spain.
Big Data in Secondary Education... and Secondary in Education
- Team: Carmen Navarro, Nazaret Oporto School.
What is it?
This proposal pursues two objectives: on the one hand, to improve the training of secondary school students in digital skills, such as the control of their digital profiles on the Internet or the use of open data for their work and projects. On the other hand, the use of data generated by students in an e-learning platform such as Moodle to determine patterns and metrics to personalize learning. All of this is aligned with the SDGs and the 20-30 Agenda.
Data used for its development come from the WHO and the datathon "Big Data in the fight against obesity", where several students proposed measures to mitigate global obesity based on the study of public data.
DataLAB: the Data Lab in Education
- Team: iteNlearning, Ernesto Ferrández Bru.
What is it?
Data obtained with empirical Artificial Intelligence techniques such as big data or machine learning offer correlations, not causes. iteNleanring bases its technology on scientific models with evidence, as well as on data (from sources such as INE or the Basque Institute of Statistics - Eustat). These data are curated in order to assist teachers in decision making, once DataLAB identifies the specific needs of each student.
DataLAB Mathematics is a professional educational tool that, based on neuropsychological and cognitive models, measures the level of neurodevelopment of the specific cognitive processes developed by each student. This generates an educational scorecard that, based on data, informs us of the specific needs of each person (high ability, dyscalculia...) so that they can be enhanced and/or reinforced, allowing an evidence-based education.
The value of podcasting in digital education
- Team: Adrián Pradilla Pórtoles and Débora Núñez Morales.
What is it?
2020 has been the year in which podcasts have taken off as a new digital format for the consumption of different areas of information. This idea seeks to take advantage of the boom of this tool to use it in the educational field so that students can learn in a more enjoyable and different way.
The proposal includes the official syllabus of secondary or university education, as well as competitive examinations, which can be obtained from open data sources and official websites. Through natural language processing technologies, these syllabi are associated with existing audios of teachers on history, English, philosophy, etc. on platforms such as iVoox or Spotify, resulting in a list of podcasts by course and subject.
The data sources used for this proposal include the Public Employment Offer of Castilla La Mancha or the educational competences in different stages.
MIPs Project
- Team: Aday Melián Carrillo, Daydream Software.
What is it?
A MIP (Marked Information Picture) is a new interactive information tool, consisting of a series of interactive layers on static images that facilitate the retention of information and the identification of elements.
This project consists of a service for creating MIPs quickly and easily by manually drawing regions of interest on any image imported through the web. The created MIPs will be accessible from any device and have multiple applications as a teaching, personal and professional resource.
In addition to manual creation, the authors have implemented an automatic GeoJSON to MIP data converter in Python. As a first step, they have developed a MIP of Spanish provinces from this public database.
FRISCHLUFT
- Team: Harut Alepoglian and Benito Cuezva, German School Cultural Association, Zaragoza.
What is it?
The Frischluft (Fresh Air) project is a hardware and software solution for measuring environmental parameters in the school. It aims to improve the thermal comfort of the classrooms and increase the protection of the students through intelligent ventilation, while consolidating a tractor project that drives the digital transformation of the school.
This proposal uses data sources from Zaragoza City Council on CO2 levels in the urban environment of the city and international data repositories to measure global emissions, which are compared through statistical techniques and machine learning models.
Next steps
All of these ideas have been able to capture how to best use data intelligence to develop real solutions in the education sector. The finalists now have 3 months to develop a prototype. The three prototypes that receive the best evaluation from the jury, according to the established evaluation criteria, will be awarded 4,000, 3,000 and 2,000 euros respectively.
Good luck to all participants!
Blog
When we think of open data our first intuition is usually directed towards data generated by public sector bodies in the exercise of their functions and made available for reuse by citizens and businesses, i.e. public sector open data or open public data. This is natural, because public sector information represents an extraordinary source of data and the intelligent use of this data, including its processing through artificial intelligence applications, has great transformative potential in all sectors of the economy, as recognised by the European directive on open data and re-use of public sector information.
One of the most interesting novelties introduced by the directive was the initial but expandable definition of 6 thematic categories of high-value datasets, whose re-use is associated with considerable benefits for society, the environment and the economy. These six areas - Geospatial, Earth Observation and Environment, Meteorology, Statistics, Societies and Corporate Ownership and Mobility - are the ones that in 2019 were considered to have the greatest potential for the creation of value-added services and applications based on such datasets. However, looking ahead to 2021, which is almost a year into the global health crisis, it seems clear that this list misses two key areas with a high potential impact on society, namely health and education.
Indeed, we find that on the one hand, educational institutions are explicitly exempted from some obligations in the directive, and on the other hand, health sector data are hardly mentioned at all. The directive, therefore, does not provide for a development of these two areas that the circumstances of the covid-19 pandemic have brought to the forefront of society's priorities.
The availability of health and education data
Although health systems, both public and private, generate and store an enormous amount of valuable data in people's medical records, the availability of these data is very limited due to the very high complexity of processing them in a secure way. Health-related datasets are usually only available to the entity that generates them, despite the great value that their release could have for the advancement of scientific research.
The same could be said for data generated by student interaction with educational platforms, which is also generally not available as open data. As in the health sector, these datasets are usually only available to their owners, for whom they are a valuable asset for the improvement of the platforms, which is only a small part of their potential value to society.
The directive states that high-value data should be published in open formats that can be freely used, re-used and shared by anyone for any purpose. Furthermore, in order to ensure maximum impact and facilitate re-use, high-value datasets should be made available for re-use with very few legal restrictions and at no cost.
Health data are highly sensitive to the privacy of individuals, so the delicate trade-off between respect for privacy and the need to support the advancement of scientific research must always be kept in mind. The consideration of health and education data as high-value open data should probably maintain some particular restrictions due to the nature and sensitivity of these data and promote figures such as the donation of data for research purposes by patients or the exchange for the same purpose between researchers. In this sense, the 2018 regulation on data protection introduced the possibility of reusing data for research purposes, provided that the appropriate pseudonymisation measures and the rest of the legally stipulated guarantees are adopted.
The importance of public-private partnerships
Education and health are two areas where the private sector or public-private partnerships are making exciting strides in converting some of the potential of open data into benefits for society. Open data publishing is not the exclusive preserve of the public sector and there is a long tradition of private-public collaboration, largely channelled through universities. Let us look at some examples:
- There are a number of initiatives such as the pioneering The UCI Machine Learning Repository founded in 1987 as a repository of datasets used by the artificial intelligence community for empirical analysis of machine learning algorithms. This repository has been cited more than 1000 times, the highest number of citations obtained in the computer science domain. In this and other repositories also managed by universities or foundations with donations from private companies, we can also find open datasets released by companies or in which they have actively collaborated in their creation or development.
- Also large technology companies, no doubt inspired by these initiatives, maintain open data search engines or repositories such as Google's dataset search engine, AWS's open data registry, or Microsoft Azure's datasets, where datasets related to health or education are increasingly common.
- In terms of data that can contribute to improving education, for example, The Open University publishes OULAD (OpenUniversity Learning Analytics Dataset), an open learning analytics dataset containing data on courses, students and their interactions with the virtual learning environment for seven courses. However, there are very few comparable datasets whose joint use in projects would undoubtedly allow further progress to be made in areas such as detecting the risk of students dropping out.
- As far as the health sector is concerned, it is worth highlighting the case of the Spanish platform HealthData 29, developed by Fundación 29, which aims to create the necessary infrastructure to make it possible to securely publish open health datasets so that they are available to the community for research purposes. As part of this infrastructure, Foundation 29 has published the Health Data Playbook, which is a guide for the creation, within the current technical and legal framework, of a public repository of data from health systems, so that they can be used in medical research. Microsoft has collaborated in the preparation of this guide as a technological partner and Garrigues as a legal partner, and it is aimed at organisations that carry out health research.
At the moment the platform only has available the Covid Data Save Lives (COVIDDSL) dataset published by the HM Hospitales University Hospital Group, composed of clinical data on interactions recorded in the covid-19 treatment process. However, it is an excellent example of the potential that we may be missing out on globally by not collecting and publishing more and better data on patients diagnosed with covid-19 in a systematised way and on a global scale. The creation of predictive models of disease progression in patients, the development of epidemiological models on the spread of the virus, or the extraction of knowledge on the behaviour of the virus for vaccine development are just some of the use cases that would benefit from greater availability of this data.
Education and health are two of the great concerns of all developed societies in the world because they are closely related to the well-being of their citizens. But perhaps we have never been more aware of this than in the last year and this represents an extraordinary opportunity to drive initiatives that contribute to unlocking more open health and education data. Whether as high-value data or in any other form, these datasets are key to enabling us to better react to future health crisis situations but also to help us overcome the aftermath of the current one.
Content prepared by Jose Luis Marín, Senior Consultant in Data, Strategy, Innovation & Digitalization.
The contents and points of view reflected in this publication are the sole responsibility of its author.
Blog
The world of technology and data is constantly evolving. Keeping up with the latest developments and trends can be a difficult task. Therefore, spaces for dialogue where knowledge, doubts and recommendations can be shared are important.
What are communities?
Communities are open channels through which different people interested in the same subject or technology meet physically or virtually to contribute, ask questions, discuss and resolve issues related to that technology. They are commonly created through an online platform, although there are communities that organise regular meetings and events where they share experiences, establish objectives and strengthen the bonds created through the screen.
How do they work?
Many developer communities use open source platforms known as GitHub or Stack Overflow, through which they store and manage their code, as well as share and discuss related topics.
Regarding how they are organised, not all communities have an organisational chart as such, some do, but there is no parameter that governs the organisation of communities in general. However, there may be roles defined according to the skills and knowledge of each of their members.
Developer communities as data reusers
There are a significant number of communities that bring knowledge about data and its associated technologies to different user groups. Some of them are made up of developers, who come together to expand their skills through webinars, competitions or projects. Sometimes these activities help drive innovation and transformation in the world of technology and data, and can act as a showcase to promote the use of open data.
Here are three examples of data-related developer communities that may be of interest to you if you want to expand your knowledge in this field:
Hackathon Lovers
Since its creation in 2013, this community of developers, designers and entrepreneurs who love hackathons have been organising meetings to test new platforms, APIs, products, hardware, etc. Among its main objectives is to create new projects and learn, while users have fun and strengthen ties with other professionals.
The topics they address in their events are varied. In the #SerchathonSalud hackathon, they focused on promoting training and research in the field of health based on bibliographic searches in 3 databases (PubMed, Embase, Cochrane).). Other events have focused on the use of specific APIs. This is the case of #OpenApiHackathon, a development event on Open Banking and #hackaTrips, a hackathon to find ideas on sustainable tourism.
Through which channels can you follow their news?
Hackathon Lovers is present in the main social networks such as Twitter and Facebook, as well as YouTube, Github, Flickr and has its own blog.
Comunidad R Hispano
It was created in November 2011, as part of the 3rd R User Conference held at the Escuela de Organización Industrial in Madrid. Organised through local user groups, its main objective is to promote the advancement of knowledge and use of the R programming language, as well as the development of the profession in all its aspects, especially research, teaching and business.
One of its main fields is the training of R and associated technologies for its users, in which open data has a place. With regard to the activities they carry out, there are events such as:
- Annual conferences: so far there have been eleven editions based on talks and workshops with attendees with R software as the protagonist.
- Local initiatives: although the association is the main promoter of the annual conferences, the feeling of community is forged thanks to local groups such as those in Madrid, sponsored by RConsortium, the Canary Islands, which communicates aspects such as public and geographic data, or Seville, which during its latest hackathons has developed several packages linked to open data.
- Collaboration with groups and initiatives focused on data: such as UNED, Grupo de Periodismo de Datos, Grupo Machine Learning Spain or companies such as Kabel or Kernel Analytics.
- Collaboration with Spanish academic institutions: such as EOI, Universidad Francisco de Vitoria, ESIC, or K-School, among others.
- Relationship with international institutions: such as RConsortium or RStudio.
- Creation of data-centric packages in Spain: participation in ROpenSpain, an initiative for R and open data enthusiasts aimed at creating top quality R packages for the reuse of Spanish data of general interest.
Through which channels can you follow their news?
This community is made up of more than 500 members. The main communication channel for contacting its users is Twitter, although its local groups have their own accounts, as is the case in Malaga, the Canary Islands and Valencia, among others.
R- Ladies Madrid
R-Ladies Madrid is a local branch of R-Ladies Global -a project funded by the R Consortium-Linux Foundation- born in 2016. It is an open source community developed by women who support each other and help each other grow within the R sector.
The main activity of this community lies in the celebration of monthly meetings or meet ups where female speakers share knowledge and projects they are working on, or teach functionalities related to R. Its members range from professionals who have R as their main working tool to amateurs who are looking to learn and improve their skills.
R-Ladies Madrid is very active within the software community and supports different technological initiatives, from the creation of open source working groups to its participation in different technological events. In some of their working groups they use open data from sources such as the BOE or Open Data NASA. In addition, they have also helped to set up a working group with data on Covid-19. In previous years they have organised gender hackathons where all participating teams were made up of 50% women and proposed to work with data from non-profit organisations.
Through which channels can you follow their news?
R – Ladies Madrid is present on Twitter, as well as having a Meetup group.
This has been a first approximation, but there are more communities of developers related to the world of data in our country. These are essential not only to bring theoretical and technical knowledge to users, but also to promote the reuse of public data through various projects like the ones we have seen. Do you know of any other organisation with similar aims? Do not hesitate to write to us at dinamizacion@datos.gob.es or leave us all the information in the comments.