Blog
In 2010, following the devastating earthquake in Haiti, hundreds of humanitarian organizations arrived in the country ready to help. They encountered an unexpected obstacle: there were no updated maps. Without reliable geographic information, coordinating resources, locating isolated communities, or planning safe routes was nearly impossible.
That gap marked a turning point: it was the moment when the global OpenStreetMap (OSM) community demonstrated its enormous humanitarian potential. More than 600 volunteers from all over the world organized themselves and began mapping Haiti in record time. This gave impetus to the Humanitarian OpenStreetMap Team project.
What is Humanitarian OpenStreetMap Team?
Humanitarian OpenStreetMap Team, known by the acronym HOT, is an international non-profit organization dedicated to improving people's lives through accurate and accessible geographic data. Their work is inspired by the principles of OSM, the collaborative project that seeks to create an open, free and editable digital map for anyone.
The difference with OSM is that HOT is specifically aimed at contexts where the lack of data directly affects people's lives: it is about providing data and tools that allow more informed decisions to be made in critical situations. That is, it applies the principles of open software and data to collaborative mapping with social and humanitarian impact.
In this sense, the HOT team not only produces maps, but also facilitates technical capacities and promotes new ways of working tools, the for different actors who need precise spatial data. Their work ranges from immediate response when a disaster strikes to structural programs that strengthen local resilience to challenges such as climate change or urban sprawl.
Four priority geographical areas
While HOT is not limited to a single country or region, it has established priority areas where its mapping efforts have the greatest impact due to significant data gaps or urgent humanitarian needs. It currently works in more than 90 countries and organizes its activities through four Open Mapping Hubs (regional centers) that coordinate initiatives according to local needs:
- Asia-Pacific: challenges range from frequent natural disasters (such as typhoons and earthquakes) to access to remote rural areas with poor map coverage.
- Eastern and Southern Africa: this region faces multiple intertwined crises (droughts, migratory movements, deficiencies in basic infrastructure) so having up-to-date maps is key for health planning, resource management and emergency response.
- West Africa and North Africa: in this area, HOT promotes activities that combine local capacity building with technological projects, promoting the active participation of communities in the creation of useful maps for their environment.
- Latin America and the Caribbean: frequently affected by hurricanes, earthquakes, and volcanic hazards, this region has seen a growing adoption of collaborative mapping in both emergency response and urban development and climate resilience initiatives.
The choice of these priority areas is not arbitrary: it responds to contexts in which the lack of open data can limit rapid and effective responses, as well as the ability of governments and communities to plan their future with reliable information.
Open source tools developed by HOT
An essential part of HOT's impact lies in the open-source tools and platforms that facilitate collaborative mapping and the use of spatial data in real-world scenarios. To this end, an E2E Value Chain Mapping was developed, which is the core methodology that enables communities to move from image capture and mapping to impact. This value chain supports all of its programs, ensuring that mapping is a transformative process based on open data, education, and community empowerment.
These tools not only support HOT's work, but are available for anyone or community to use, adapt, or expand. Specifically, tools have been developed to create, access, manage, analyse and share open map data. You can explore them in the Learning Center, a training space that offers capacity building, skills strengthening and an accreditation process for interested individuals and organisations. These tools are described below:
It allows drone flights to be planned for up-to-date, high-resolution aerial imagery, which is critical when commercial imagery is too expensive. In this way, anyone with access to a drone – including low-cost and commonly used models – can contribute to a global repository of free and open imagery, democratizing access to geospatial data critical to disaster response, community resilience, and local planning.
The platform coordinates multiple operators and generates automated flight plans to cover areas of interest, making it easy to capture 2D and 3D images accurately and efficiently. In addition, it includes training plans and promotes safety and compliance with local regulations, supporting project management, data visualization and collaborative exchange between pilots and organizations.
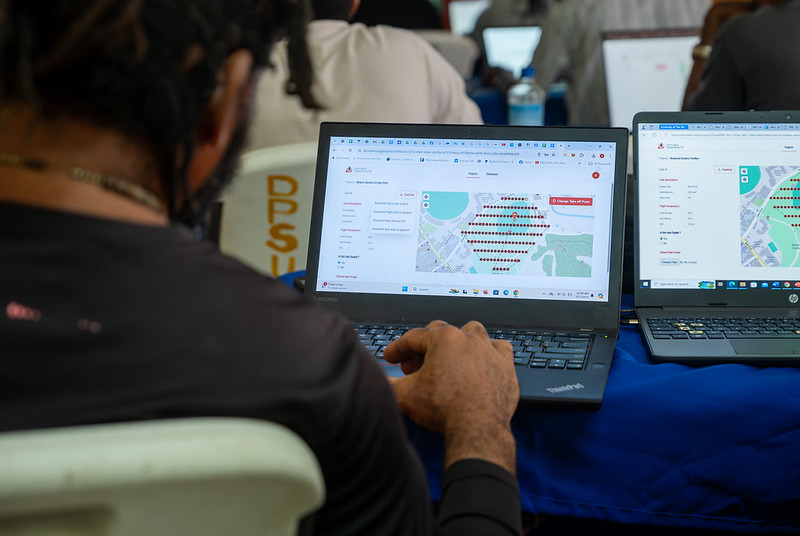
Figure 1. Drone Tasking Manager (DroneTM) screenshot. Source: Humanitarian OpenStreetMap Team (HOT).
It is an open-source platform that offers access to a community library of openly-licensed aerial imagery, obtained from satellites, drones, or other aircraft. It has a simple interface where you can zoom in on a map to search for available images. OAM allows you to both download and contribute new imagery, thus expanding a global repository of visual data that anyone can use and plot in OpenStreetMap.
All imagery hosted on OpenAerialMap is licensed under CC-BY 4.0, which means that they are publicly accessible and can be reused with attribution, facilitating their integration into geospatial analysis applications, emergency response projects, or local planning initiatives. OAM relies on the Open Imagery Network (OIN) to structure and serve these images.
It facilitates collaborative mapping in OpenStreetMap. Its main purpose is to coordinate thousands of volunteers from all over the world to aggregate geographic data in an organized and efficient way. To do this, it breaks down a large mapping project into small "tasks" that can be completed quickly by people working remotely.
The way it works is simple: projects are subdivided into grids, each assignable to a volunteer in order to map out elements such as streets, buildings, or points of interest in OSM. Each task is validated by experienced mappers to ensure data quality. The platform clearly shows which areas still need mapping or review, avoiding duplication and improving the efficiency of collaborative work.

Figure 2. Tasking Manager screenshot. Source: Humanitarian OpenStreetMap Team (HOT).
It uses artificial intelligence to assist the mapping process in OpenStreetMap for humanitarian purposes. Through computer vision models, fAIr analyzes satellite or aerial images and suggests the detection of geographical elements such as buildings, roads, watercourses or vegetation from free images such as those of OpenAerialMap. The idea is that volunteers can use these predictions as an aid to map faster and more accurately, without performing automated mass imports, always integrating human judgment into the validation of each element.
One of the most outstanding features of fAIr is that the creation and training of AI models is in the hands of the mapping communities themselves: users can generate their own training sets adjusted to their region or context, which helps reduce biases of standard models and makes predictions more relevant to local needs.
It is a mobile and web application that facilitates the coordination of mapping campaigns directly in the field. Field-TM is used in conjunction with OpenDataKit (ODK), a data collection platform on Android that allows information to be entered in the field using mobile devices themselves. Thanks to it, volunteers can enter geospatial information verified by local observation, such as the purpose of each building (whether it is a store, a hospital, etc.).
The app provides an interface to assign tasks, track progress, and ensure data consistency. Its main purpose is to improve the efficiency, organization and quality of fieldwork by enriching it with local information, as well as to reduce duplications, avoid uncovered areas and allow clear monitoring of the progress of each collaborator in a mapping campaign.
Transform conversations from instant messaging apps (like WhatsApp) into interactive maps. In many communities, especially in disaster-prone or low-tech literacy areas, people are already using chat apps to communicate and share their location. ChatMap leverages those exported messages, extracts location data along with texts, photos, and videos, and automatically renders them on a map, without the need for complex installations or advanced technical knowledge.
This solution works even in conditions of limited or offline connectivity, relying on the phone's GPS signal to record locations and store them until the information can be uploaded.

Figure 3. ChatMap screenshot. Source: OpenStreetMap Humanitarian Team (HOT).
Facilitate access to and download of up-to-date geospatial data from OpenStreetMap in useful formats for analysis and projects. Through this web platform, you can select an area of interest on the map, choose what data you want (such as roads, buildings, or services), and download that data in multiple formats, such as GeoJSON, Shapefile, GeoPackage, KML, or CSV. This allows the information to be used in GIS (Geographic Information Systems) software or integrated directly into custom applications. You can also export all the data for a zone or download data associated with a specific project from the Tasking Manager.
The tool is designed to be accessible to both technical analysts and non-GIS experts: in a matter of minutes, custom OSM extracts can be generated without the need to install specialized software. It also offers an API and data quality metrics.
It is an open-source interactive map creation platform that allows anyone to easily visualize, customize, and share geospatial data. Based on OpenStreetMap maps, uMap allows you to add custom layers, markers, lines and polygons, manage colors and icons, import data in common formats (such as GeoJSON, GPX or KML) and choose licenses for the data, without the need to install specialized software. The maps created can be embedded in websites or shared using links.
The tool offers templates and integration options with other HOT tools, such as ChatMap and OpenAerialMap, to enrich the data on the map.
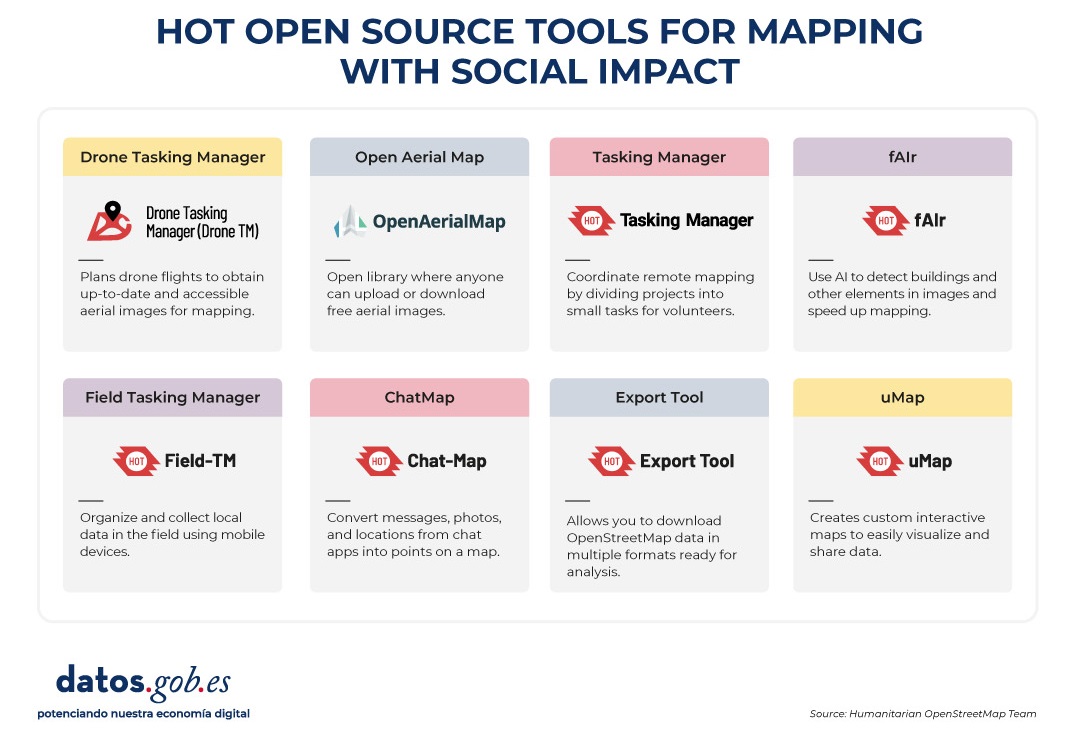
Figure 4. HOT open source tools for mapping with social impact. Source: Humanitarian OpenStreetMap Team (HOT).
All of these tools are available to local communities around the world. HOT also offers training to promote its use and improve the impact of open data in humanitarian responses.
How can you join HOT's impact?
HOT is built alongside a global community that drives the use of open data to strengthen decision-making and save lives. If you represent an organization, university, collective, public agency, or community initiative and have a project idea or interest in an alliance, the HOT team is open to exploring collaborations. You can write to partnerships@hotosm.org.
When communities have access to accurate data, open tools, and the knowledge to generate geospatial information on an ongoing basis, they become informed agents, ready to make decisions in any situation. They are better equipped to identify climate risks, respond to emergencies, solve local problems, and mobilize support. Open mapping, therefore, does not only represent territories: it empowers people to transform their reality with data that can save lives.
Application
SUBSIDIA ONERIS (Latin for “burden of subsidies”) is a library of applets that enable mass access to data from the National Subsidies Database portal directly from Excel, using PowerQuery ETL to access the official SNPSAP API. It is shared under a CC BY-NC-SA 4.0 license.
Its use requires only very basic knowledge of Excel. The available applets are as follows:
• De minimis Inspector 2.0: By entering one or multiple tax identification numbers (NIF) of beneficiaries, it returns all de minimis grants existing on the Portal on the date the query is performed, granted over the previous three years, providing transactional information on these grants as well as various aggregates and reports. Useful for checking compliance with the three-year de minimis accumulation requirements per beneficiary established in the applicable European regulations.
• State Aid (AdE) Inspector 2.1: By entering one or multiple beneficiary NIFs, it returns all State Aid grants existing on the Portal on the date the query is performed, providing transactional information on these grants as well as various aggregates and reports.
• All Grants Inspector 2.0: By entering one or multiple beneficiary NIFs, it returns all grants existing in the “All” tab of the Portal on the date the query is performed, providing transactional information on these grants as well as various aggregates and reports.
• Grants by Date Query Tool (more than 10,000) 2.1: By entering a start and end date, it returns all grants existing in the “Grants – All” tab of the Portal for the reference period on the date the query is performed, providing transactional information as well as various aggregates and reports. Time intervals should preferably not exceed one month, as the large number of grants may cause the download to fail, depending on the memory resources of the computer running Excel and the transactional load on the servers.
• Grants by Call for Proposals Query Tool (more than 10,000) 2.1: For calls for proposals that have more than 10,000 grants, this tool allows downloading all of them, up to 1,000,000 grants. Only one call code can be specified.
• State Aid by Date Query Tool (more than 10,000) 2.1: By entering a start and end date, it returns all grants existing in the “State Aid” tab of the Portal for the reference period on the date the query is performed, providing transactional information as well as various aggregates and reports. Time intervals should preferably not exceed one year, as the large number of grants may cause the download to fail, depending on the memory resources of the computer running Excel and the transactional load on the servers.
• De minimis by Date Query Tool (more than 10,000) 2.1: By entering a start and end date, it returns all grants existing in the de minimis tab of the Portal for the reference period on the date the query is performed, providing transactional information as well as various aggregates and reports. Time intervals should preferably not exceed one year, as the large number of grants may cause the download to fail, depending on the memory resources of the computer running Excel and the transactional load on the servers.
• Multi-SA State Aid Query Tool (less than 10,000) 2.0: By entering one or multiple references to State Aid measures (SA.number), it returns all State Aid grants existing on the Portal on the date the query is performed for those measures, providing transactional information as well as various aggregates and reports. If any measure (SA.number) has more than 10,000 grants, only the first 10,000 are downloaded, so it should not be used in that case. If an SA has more than 10,000 grants, the Multi-code Grants by Call Query Tool can be used instead. To do so, you must first identify the calls for proposals that have been formalized for that SA measure.
• Multi-code Grants by Call Query Tool (less than 10,000) 2.1: By entering one or multiple BDNS call codes, it returns all grants for those calls existing on the Portal on the date the query is performed, providing transactional information as well as various aggregates and reports.
If any call has more than 10,000 grants, it only downloads the first 10,000, so it should not be … (text truncated in the original).
Application
MOVACTIVA is a digital platform developed by the Department of Geography of the Universitat Autònoma de Barcelona, which works as an interactive atlas focused on active mobility, i.e. the transport of people using non-motorised means, such as walking or cycling. The atlas collects information from five Spanish cities: Barcelona, Granada, Madrid, Palma de Mallorca and Valencia.
The project maps five urban indicators that are decisive for active mobility, based on 57 georeferenced variables:
The combination of these five elements makes it possible to create an objective and standardised indicator: the Global Active Mobility Indicator.
In addition, the website also offers information on:
- Micromobility, which includes electric, small and light modes of transport (Personal Mobility Vehicles or PMVs), such as electric bicycles and scooters, hoverboards, segways and monowheels.
- Intermodality, which involves the use of two or more modes of transport within the framework of a single trip.
To bring information closer to users, it has an interactive viewer that allows geographic data to be explored visually, facilitating comparison between cities and promoting a healthier and more sustainable urban approach. The indicators are superimposed on open access base maps such as the PNOA orthophotography (from the IGN) and OpenStreetMap.
Blog
Open data has great potential to transform the way we interact with our cities. As they are available to all citizens, they allow the development of applications and tools that respond to urban challenges such as accessibility, road safety or citizen participation. Facilitating access to this information not only drives innovation, but also contributes to improving the quality of life in urban environments.
This potential becomes even more relevant if we consider the current context. Accelerated urban growth has brought with it new challenges, especially in the area of public health. According to data from the United Nations, it is estimated that by 2050 more than 68% of the world's population will live in cities. Therefore, the design of healthy urban environments is a priority in which open data is consolidated as a key tool: it allows planning more resilient, inclusive and sustainable cities, putting people's well-being at the center of decisions. In this post, we tell you what healthy urban environments are and how open data can help build and maintain them.
What are Healthy Urban Environments? Uses and examples
Healthy urban environments go beyond simply the absence of pollution or noise. According to the World Health Organization (WHO), these spaces must actively promote healthy lifestyles, facilitate physical activity, encourage social interaction, and ensure equitable access to basic services. As established in the Ministry of Health's "Guide to Planning Healthy Cities", these environments are characterized by three key elements:
-
Cities designed for walking: they must be spaces that prioritize pedestrian and cycling mobility, with safe, accessible and comfortable streets that invite active movement.
-
Incorporation of nature: they integrate green areas, blue infrastructure and natural elements that improve air quality, regulate urban temperature and offer spaces for recreation and rest.
-
Meeting and coexistence spaces: they have areas that facilitate social interaction, reduce isolation and strengthen the community fabric.
The role of open data in healthy urban environments
In this scenario, open data acts as the nervous system of smart cities, providing valuable information on usage patterns, citizen needs, and public policy effectiveness. Specifically, in the field of healthy urban spaces, data from:
-
Analysis of physical activity patterns: data on mobility, use of sports facilities and frequentation of green spaces reveal where and when citizens are most active, identifying opportunities to optimize existing infrastructure.
-
Environmental quality monitoring: urban sensors that measure air quality, noise levels, and temperature provide real-time information on the health conditions of different urban areas.
-
Accessibility assessment: public transport, pedestrian infrastructure and service distribution allow for the identification of barriers to access and the design of more inclusive solutions.
-
Informed citizen participation: open data platforms facilitate participatory processes where citizens can contribute local information and collaborate in decision-making.
The Spanish open data ecosystem has solid platforms that feed healthy urban space projects. For example, the Madrid City Council's Open Data Portal offers real-time information on air quality as well as a complete inventory of green areas. Barcelona also publishes data on air quality, including the locations and characteristics of measuring stations.
These portals not only store information, but structure it in a way that developers, researchers and citizens can create innovative applications and services.
Use Cases: Applications That Reuse Open Data
Several projects demonstrate how open data translates into tangible improvements for urban health. On the one hand, we can highlight some applications or digital tools such as:
-
AQI Air Quality Index: uses government data to provide real-time information on air quality in different Spanish cities.
-
GV Aire: processes official air quality data to generate citizen alerts and recommendations.
-
National Air Quality Index: centralizes information from measurement stations throughout the country.
-
Valencia Verde: uses municipal data to show the location and characteristics of parks and gardens in Valencia.
On the other hand, there are initiatives that combine multisectoral open data to offer solutions that improve the interaction between cities and citizens. For example:
-
Supermanzanas Program: uses maps showing air quality pollution levels and traffic data available in open formats such as CSV and GeoPackage from Barcelona Open Data and Barcelona City Council to identify streets where reducing road traffic can maximize health benefits, creating safe spaces for pedestrians and cyclists.
-
The DataActive platform: seeks to establish an international infrastructure in which researchers, public and private sports entities participate. The topics it addresses include land management, urban planning, sustainability, mobility, air quality and environmental justice. It aims to promote more active, healthy and accessible urban environments through the implementation of strategies based on open data and research.
Data availability is complemented by advanced visualization tools. The Madrid Spatial Data Infrastructure (IDEM) offers geographic viewers specialized in air quality and the National Geographic Institute (IGN) offers the national street map CartoCiudad with information on all cities in Spain.
Effective governance and innovation ecosystem
However, the effectiveness of these initiatives depends on new governance models that integrate multiple actors. To achieve proper coordination between public administrations at different levels, private companies, third sector organizations and citizens, it is essential to have quality open data.
Open data not only powers specific applications but creates an entire ecosystem of innovation. Independent developers, startups, research centers, and citizen organizations use this data to:
-
Develop urban health impact studies.
-
Create participatory planning tools.
-
Generate early warnings about environmental risks.
-
Evaluate the effectiveness of public policies.
-
Design personalized services according to the needs of different population groups.
Healthy urban spaces projects based on open data generate multiple tangible benefits:
-
Efficiency in public management: data makes it possible to optimize the allocation of resources, prioritize interventions and evaluate their real impact on citizen health.
-
Innovation and economic development: the open data ecosystem stimulates the creation of innovative startups and services that improve the quality of urban life, as demonstrated by the multiple applications available in datos.gob.es.
-
Transparency and participation: the availability of data facilitates citizen control and strengthens democratic decision-making processes.
-
Scientific evidence: Urban health data contributes to the development of evidence-based public policies and the advancement of scientific knowledge.
-
Replicability: successful solutions can be adapted and replicated in other cities, accelerating the transformation towards healthier urban environments.
In short, the future of our cities depends on our ability to integrate technology, citizen participation and innovative public policies. The examples analyzed demonstrate that open data is not just information; They are the foundation for building urban environments that actively promote health, equity, and sustainability.
Blog
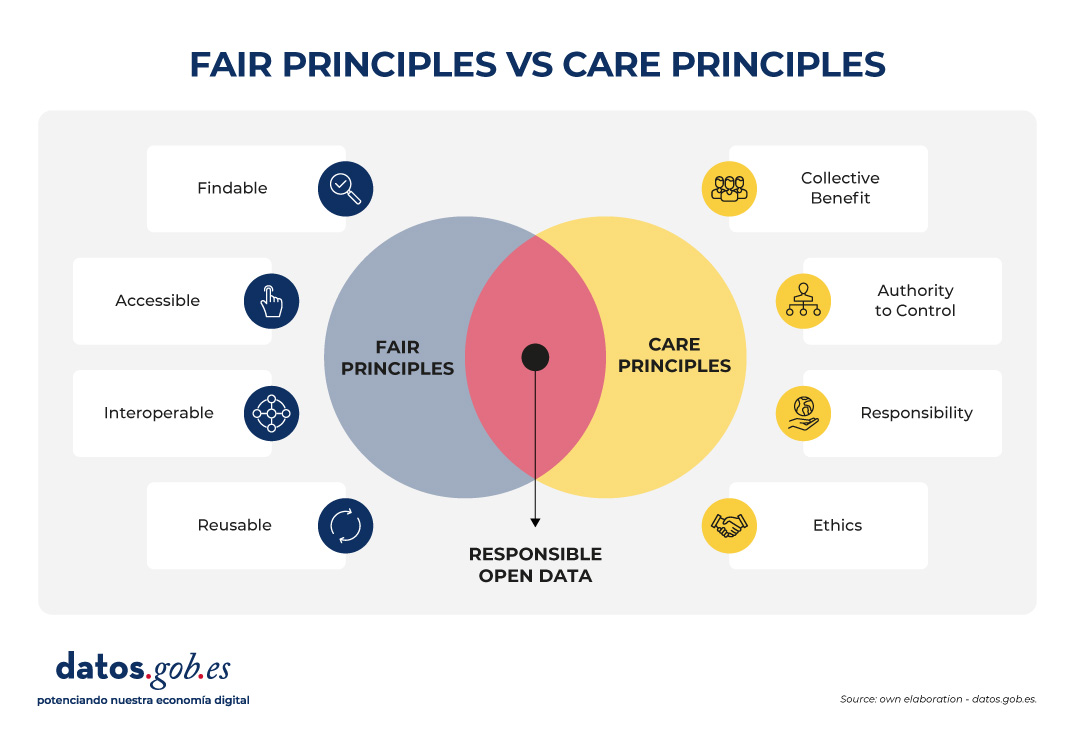
In recent years, open data initiatives have transformed the way in which both public institutions and private organizations manage and share information. The adoption of FAIR (Findable, Accessible, Interoperable, Reusable) principles has been key to ensuring that data generates a positive impact, maximizing its availability and reuse.
However, in contexts of vulnerability (such as indigenous peoples, cultural minorities or territories at risk) there is a need to incorporate an ethical framework that guarantees that the opening of data does not lead to harm or deepen inequalities. This is where the CARE principles (Collective Benefit, Authority to Control, Responsibility, Ethics), proposed by the Global Indigenous Data Alliance (GIDA), come into play, which complement and enrich the FAIR approach.
It is important to note that although CARE principles arise in the context of indigenous communities (to ensure indigenous peoples' effective sovereignty over their data and their right to generate value in accordance with their own values), these can be extrapolated to other different scenarios. In fact, these principles are very useful in any situation where data is collected in territories with some type of social, territorial, environmental or even cultural vulnerability.
This article explores how CARE principles can be integrated into open data initiatives generating social impact based on responsible use that does not harm vulnerable communities.
The CARE principles in detail
The CARE principles help ensure that open data initiatives are not limited to technical aspects, but also incorporate social, cultural and ethical considerations. Specifically, the four CARE principles are as follows:
-
Collective Benefit: data must be used to generate a benefit that is shared fairly between all parties involved. In this way, open data should support the sustainable development, social well-being and cultural strengthening of a vulnerable community, for example, by avoiding practices related to open data that only favour third parties.
-
Authority to Control: vulnerable communities have the right to decide how the data they generate is collected, managed, shared, and reused. This principle recognises data sovereignty and the need to respect one’s own governance systems, rather than imposing external criteria.
-
Responsibility: those who manage and reuse data must act responsibly towards the communities involved, recognizing possible negative impacts and implementing measures to mitigate them. This includes practices such as prior consultation, transparency in the use of data, and the creation of accountability mechanisms.
-
Ethics: the ethical dimension requires that the openness and re-use of data respects the human rights, cultural values and dignity of communities. It is not only a matter of complying with the law, but of going further, applying ethical principles through a code of ethics.
Together, these four principles provide a guide to managing open data more fairly and responsibly, respecting the sovereignty and interests of the communities to which that data relates.
CARE and FAIR: complementary principles for open data that transcend
The CARE and FAIR principles are not opposite, but operate on different and complementary levels:
-
FAIR focuses on making data consumption technically easier.
-
CARE introduces the social and ethical dimension (including cultural considerations of specific vulnerable communities).
The FAIR principles focus on the technical and operational dimensions of data. In other words, data that comply with these principles are easily locatable, available without unnecessary barriers and with unique identifiers, use standards to ensure interoperability, and can be used in different contexts for purposes other than those originally intended.
However, the FAIR principles do not directly address issues of social justice, sovereignty or ethics. In particular, these principles do not contemplate that data may represent knowledge, resources or identities of communities that have historically suffered exclusion or exploitation or of communities related to territories with unique environmental, social or cultural values. To do this, the CARE principles, which complement the FAIR principles, can be used, adding an ethical and community governance foundation to any open data initiative.
In this way, an open data strategy that aspires to be socially just and sustainable must articulate both principles. FAIR without CARE risks making collective rights invisible by promoting unethical data reuse. On the other hand, CARE without FAIR can limit the potential for interoperability and reuse, making the data useless to generate a positive benefit in a vulnerable community or territory.
An illustrative example is found in the management of data on biodiversity in a protected natural area. While the FAIR principles ensure that data can be integrated with various tools to be widely reused (e.g., in scientific research), the CARE principles remind us that data on species and the territories in which they live can have direct implications for communities who live in (or near) that protected natural area. For example, making public the exact points where endangered species are found in a protected natural area could facilitate their illegal exploitation rather than their conservation, which requires careful definition of how, when and under what conditions this data is shared.
Let's now see how in this example the CARE principles could be met:
-
First, biodiversity data should be used to protect ecosystems and strengthen local communities, generating benefits in the form of conservation, sustainable tourism or environmental education, rather than favoring isolated private interests (i.e., collective benefit principle).
-
Second, communities living near or dependent on the protected natural area have the right to decide how sensitive data is managed, for example, by requiring that the location of certain species not be published openly or published in an aggregated manner (i.e., principle of authority).
-
On the other hand, the people in charge of the management of these protected areas of the park must act responsibly, establishing protocols to avoid collateral damage (such as poaching) and ensuring that the data is used in a way that is consistent with conservation objectives (i.e. the principle of responsibility).
-
Finally, the openness of this data must be guided by ethical principles, prioritizing the protection of biodiversity and the rights of local communities over economic (or even academic) interests that may put ecosystems or the populations that depend on them at risk (principle of ethics).
Notably, several international initiatives, such as Indigenous Environmental Data Justice related to the International Indigenous Data Sovereignty Movement and the Research Data Alliance (RDA) through the Care Principles for Indigenous Data Governance, are already promoting the joint adoption of CARE and FAIR as the foundation for more equitable data initiatives.
Conclusions
Ensuring the FAIR principles is essential for open data to generate value through its reuse. However, open data initiatives must be accompanied by a firm commitment to social justice, the sovereignty of vulnerable communities, and ethics. Only the integration of the CARE principles together with the FAIR will make it possible to promote truly fair, equitable, inclusive and responsible open data practices.
Jose Norberto Mazón, Professor of Computer Languages and Systems at the University of Alicante. The contents and views reflected in this publication are the sole responsibility of the author.
Blog
Femicide, defined as the gender-based murder of women, remains one of the most extreme forms of violence. In 2023, it is estimated that approximately 85,000 women and girls were murdered in the world and of these, 60% died at the hands of intimate partners or family members, which is equivalent to 140 victims per day in their immediate environment. According to the United Nations (UN), femicide occurs in a context of inequality, discrimination and asymmetrical power relations between men and women.
However, the above figures are an estimate, since obtaining data on this subject is not easy and involves a series of challenges. In this article we are going to comment on these challenges, and present examples and good practices of citizen associations that work to promote their quality and quantity.
Challenges in collecting data on femicides
The international comparison of femicide mainly faces two major issues: the absence of a common definition and the lack of standardization.
-
Absence of a common definition
There are important legal and conceptual differences between countries in terms of the definition of femicide. In Latin America, many countries have incorporated femicide as a specific crime, although with substantial variations in the legal criteria and in the breadth of the definition. In contrast, in Europe there is still no homogeneous definition of femicide, as underlined by the European Institute for Gender Equality (EIGE). In many cases, gender-based killings of women are recorded as general homicides or domestic violence, making the phenomenon invisible and making international comparison difficult.
This absence of a common legal and conceptual definition prevents direct comparison of figures as well as regional analysis. In addition, the lack of methodological homogeneity causes femicide figures to be diluted among those of general homicides, underestimating the real magnitude of the problem and making it difficult to design effective public policies.
In this sense, an international effort is needed to standardize definitions. In this way, it will be possible to measure the true scope of the problem and combat it effectively.
-
Lack of standardization
The lack of standardization in data collection and publication generates profound differences in the availability, openness, and quality of information between countries. As in many other areas, open and standardized data on femicides could help to understand the phenomenon and facilitate the implementation of effective public policies. However, today there is disparity in data collection and publication.
Currently, the availability of data on femicide is uneven between countries. We find cases in which the data refer to different periods, or that present variations due to the different methodologies, definitions and sources:
- There are countries that offer data accessible through government platforms and/or official observatories. In these cases, the data come from public bodies such as ministries, national statistical institutes, gender-based violence observatories and supreme courts, which guarantees greater reliability and continuity in the publication of statistics, although their coverage and methodology vary widely.
- In other cases, the data are partial or come from non-governmental organizations (NGOs), independent observatories, journalistic and academic networks. These agencies usually resort to newspaper counts or media monitoring to complete institutional data. Multilateral organizations such as the Economic Commission for Latin America and the Caribbean (ECLAC), UN Women and European data journalism networks try to harmonize and compare figures, although they recognize the limitations derived from the diversity of definitions and methodologies.
This lack of a unified system generates the need for a triangulation of information and produces discrepancies in the reported figures. In addition, it makes it difficult to obtain a more complete view of the phenomenon.
Therefore, standardization in data collection is necessary to provide reliable and comparable data to know the real magnitude of the problem, evaluate the effectiveness of public policies or design effective prevention strategies.
To these challenges, we should add:
- Lack of technological infrastructure: disconnected judicial and police systems generate duplication or omissions.
- Irregular updates: very few publish quarterly data, essential for preventive policies.
Examples of citizen initiatives that collect data on femicide
In order to respond to global problems, citizen and academic initiatives have emerged that build alternative databases, making gender violence visible. To this end, feminist organizations and activists have adopted technological tools to track femicides.
One example is the Data Against Feminicide (DAF), which equips activists with email alert systems based on machine learning algorithms. The platform develops machine learning algorithms that help scan more than 50,000 daily news sources in multiple languages to identify potential cases of femicide, prioritizing activists' regions of interest and allowing them to add local sources. Unlike generic systems, DAF's approach is collaborative: participants train algorithms, review results, and correct biases, including identifying transfemicides or interpreting biased language in the media. Thus, technology does not replace human analysis, but reduces the workload and allows efforts to be focused on the verification and contextualization of cases.
Although transparency and open data are a first step, citizen projects such as those supported by the DAF operate with additional criteria that enrich the results:
- Data with memory: each record includes name, personal history and community context.
- Radical transparency: they use open-source methodologies and tools.
- Restorative justice: data feeds advocacy campaigns and accompaniment to families.
The DAF also highlights the need to protect and care for the people who collect this data, given the emotional impact of their work. Thus, the human and ethical dimension of work is also made visible with data on femicide.
Another example is Feminicidio Uruguay, which has documented cases since 2001 through press monitoring and collaboration with the Coordinator of Feminisms. Their key findings include that 78% of the aggressors were known to the victim; that 42% of femicides occurred in the home, and that only 15% of the victims had made a previous complaint. This project inspired the creation of the National Registry of Femicides of the Argentine Justice, which since 2017 has published annual open data with details of victims, aggressors and context of the cases.
In addition to country initiatives, we also find supranational initiatives that seek to unify data in various regions. Initiatives such as the Regional Femicide Data Standard (ILDA) seek to overcome these barriers by:
- Unified collection protocols.
- Collaborative technical training platforms.
- Intergovernmental partnerships for legal validation.
The case of Spain
In view of this international situation, Spain is presented as a pioneering case in the field. Since 2022, all types of femicides have been officially counted, not only those committed by partners or ex-partners, but also family, sexual, social and vicarious ones. The main Spanish portal for statistical data on femicide is the statistical portal of the Government Delegation against Gender Violence, available on a dedicated website . This space brings together official data on femicides and gender-based violence, allowing information to be consulted, cross-referenced and downloaded in different formats, and is the institutional reference for the monitoring and analysis of these crimes in Spain. This new methodology responds to compliance with the Istanbul Convention and seeks to reflect the totality of extreme violence against women.
Collaboration with civil society and experts has been key to defining typologies and improving the quality and openness of the data. Citizen access is widespread, and data is disseminated in reports, datasets, and public bulletins.
Conclusion
In short, the opening and standardization of data on femicide are not only technical tools, but also acts of justice and collective memory. Where States work with civil society, data is more complete, transparent and useful for prevention and accountability. However, the persistence of gaps and disparate methodologies in many countries continue to hinder an effective global response to femicide. Overcoming these challenges requires strengthening international collaboration, adopting common standards, and ensuring the participation of those who document and accompany victims. Only in this way can data transform outrage into action and contribute to eradicating one of the most extreme forms of gender-based violence.
Content created by Miren Gutiérrez, PhD and researcher at the University of Deusto, expert in data activism, data justice, data literacy, and gender disinformation. The content and views expressed in this publication are the sole responsibility of the author.
Blog
Cities account for more than two-thirds of Europe's population and consume around 80% of energy. In this context, climate change is having a particularly severe impact on urban environments, not only because of their density, but also because of their construction characteristics, their energy metabolism and the scarcity of vegetation in many consolidated areas. One of the most visible and worrying effects is the phenomenon known as urban heat island (UHI).
Heat islands occur when the temperature in urban areas is significantly higher than in nearby rural or peri-urban areas, especially at night. This thermal differential can easily exceed five degrees Celsius under certain conditions. The consequences of this phenomenon go beyond thermal discomfort: it directly affects health, air quality, energy consumption, urban biodiversity and social equity.
In recent years, the availability of open data—especially geospatial data—has made it possible to characterize, map, and analyze urban heat islands with unprecedented accuracy. This article explores how this data can be used to design urban solutions adapted to climate change, with heat island mitigation as its focus.
What are urban heat islands and why do they occur?
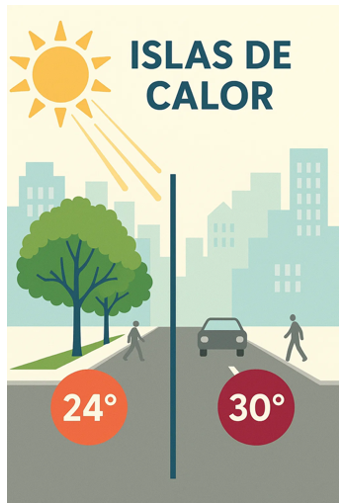
Figure 1. Illustrative element on heat islands.
To intervene effectively in heat islands, it is necessary to know where, when and how they occur. Unlike other natural hazards, the heat island effect is not visible to the naked eye, and its intensity varies depending on the time of day, time of year, and specific weather conditions. It therefore requires a solid and dynamic knowledge base, which can only be built through the integration of diverse, up-to-date and territorialized data.
At this point, open geospatial data is a critical tool. Through satellite images, urban maps, meteorological data, cadastral cartography and other publicly accessible sets, it is possible to build urban thermal models, identify critical areas, estimate differential exposures and evaluate the impact of the measures adopted.
The main categories of data that allow us to address the phenomenon of heat islands from a territorial and interdisciplinary perspective are detailed below.
Types of geoespatial data applicable to the study of the phenomenon
1. Earth observation satellite data
Thermal sensors on satellites such as Landsat 8/9 (NASA/USGS) or Sentinel-3 (Copernicus) make it possible to generate urban surface temperature maps with resolutions ranging from 30 to 1,000 metres. Although these images have spatial and temporal limitations, they are sufficient to detect patterns and trends, especially if combined with time series.
This data, accessible through platforms such as the Copernicus Open Access Hub or the USGS EarthExplorer, is essential for comparative studies between cities or for observing the temporal evolution of the same area.
2. Urban weather data
The network of AEMET stations, together with other automatic stations managed by autonomous communities or city councils, allows the evolution of air temperatures in different urban points to be analysed. In some cases, there are also citizen sensors or networks of sensors distributed in the urban space that allow real-time heat maps to be generated with high resolution.
3. Urban mapping and digital terrain models
Digital surface models (DSM), digital terrain models (DTM) and mappings derived from LIDAR allow the study of urban morphology, building density, street orientation, terrain slope and other factors that affect natural ventilation and heat accumulation. In Spain, this data is accessible through the National Center for Geographic Information (CNIG).
4. Land cover and land use databases
Databases such as Corine Land Cover of the Copernicus Programme, or land use maps at the regional level make it possible to distinguish between urbanised areas, green areas, impermeable surfaces and bodies of water. This information is key to calculating the degree of artificialization of an area and its relationship with the heat balance.
5. Inventories of urban trees and green spaces
Some municipalities publish on their open data portals the detailed inventory of urban trees, parks and gardens. These georeferenced data make it possible to analyse the effect of vegetation on thermal comfort, as well as to plan new plantations or green corridors.
6. Socioeconomic and vulnerability data
Data from the National Institute of Statistics (INE), together with the social information systems of autonomous communities and city councils, make it possible to identify the most vulnerable neighbourhoods from a social and economic point of view. Its cross-referencing with thermal data allows a climate justice dimension to be incorporated into decision-making.
Practical applications: how open data is used to act
Once the relevant data has been gathered and integrated, multiple analysis strategies can be applied to support public policies and urban projects with sustainability and equity criteria. Some of the main applications are described below.
· Heat zone mapping and vulnerability maps: Using thermal imagery, weather data, and urban layers together, heat island intensity maps can be generated at the neighborhood or block level. If these maps are combined with social, demographic and public health indicators, it is possible to build thermal vulnerability maps, which prioritize intervention in areas where high temperatures and high levels of social risk intersect. These maps allow, for example:
· Identify priority neighborhoods for urban greening.
· Plan evacuation routes or shaded areas during heat waves.
· Determine the optimal location of climate refuges.
· Assessing the impact of nature-based solutions: Open data also makes it possible to monitor the effects of certain urban actions. For example, using time series of satellite images or temperature sensors, it is possible to assess how the creation of a park or the planting of trees on a street has modified the surface temperature. This ex-post evaluation approach allows justifying public investments, adjusting designs and scaling effective solutions to other areas with similar conditions.
· Urban modelling and climate simulations: three-dimensional urban models, built from open LIDAR data or cadastral mapping, make it possible to simulate the thermal behaviour of a neighbourhood or city under different climatic and urban scenarios. These simulations, combined with tools such as ENVI-met or Urban Weather Generator, are essential to support decision-making in urban planning.
Existing studies and analysis on urban heat islands: what has been done and what we can learn
During the last decade, multiple studies have been carried out in Spain and Europe that show how open data, especially geospatial data, allow the phenomenon of urban heat islands to be characterised and analysed. These works are fundamental not only because of their specific results, but also because they illustrate replicable and scalable methodologies. Some of the most relevant are described below.
Polytechnic University of Madrid study on surface temperature in Madrid
A team from the Department of Topographic Engineering and Cartography of the UPM analysed the evolution of surface temperature in the municipality of Madrid using thermal images from the Landsat 8 satellite in the summer period. The study focused on detecting spatial changes in warmer areas and relating them to land use, urban vegetation and building density.
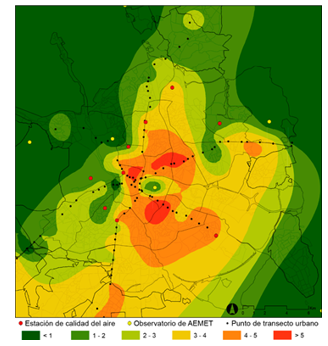
Figure 2. Illustrative image. Source: generated with AI
Methodology:
Remote sensing techniques were applied to extract the surface temperature from the TIRS thermal channel of the Landsat. Subsequently, a statistical analysis of correlation between thermal values and variables such as NDVI (vegetation index), type of land cover (CORINE data) and urban morphology was carried out.
Main results:
Areas with higher building density, such as the central and southern neighborhoods, showed higher surface temperatures. The presence of urban parks reduced the temperature of their immediate surroundings by 3 to 5 °C. It was confirmed that the heat island effect intensifies at night, especially during persistent heat waves.
This type of analysis is especially useful for designing urban greening strategies and for justifying interventions in vulnerable neighbourhoods.
Barcelona Climate Vulnerability Atlas
Barcelona City Council, in collaboration with experts in public health and urban geography, developed a Climate Vulnerability Atlas which includes detailed maps of heat exposure, population sensitivity, and adaptive capacity. The objective was to guide municipal policies against climate change, especially in the field of health and social services.

Figure 3. Image containing fence, exterior, buildings and grass. Source: generated with AI
Methodology:
The atlas was developed by combining open and administrative data at the census tract level. Three dimensions were analysed: exposure (air temperature and surface data), sensitivity (advanced age, density, morbidity) and adaptive capacity (access to green areas, quality of housing, facilities). The indicators were normalized and combined through multi-criteria spatial analysis to generate a climate vulnerability index. The result made it possible to locate the neighbourhoods most at risk from extreme heat and to guide municipal measures.
Main results:
Based on the atlas, the network of "climate shelters" was designed, which includes libraries, civic centers, schools and conditioned parks, activated during episodes of extreme heat. The selection of these spaces was based directly on the atlas data.
Multitemporal analysis of the heat island effect in Seville
Researchers from the University of Seville used satellite data from Sentinel-3 and Landsat 8 to study the evolution of the heat island phenomenon in the city between 2015 and 2022. The aim was to evaluate the effectiveness of certain urban actions – such as the "Green your neighbourhood" plan – and to anticipate the effects of climate change on the city.
Methodology:
Thermal imaging and NDVI data were used to calculate temperature differences between urban areas and surrounding rural areas. Supervised classification techniques were also applied to identify land uses and their evolution. Open data from tree inventories and urban shade maps were used to interpret the results.
Main results:
Specific renaturation actions have a very positive local impact, but their effect on the city as a whole is limited if they are not integrated into a metropolitan-scale strategy. The study concluded that a continuous network of vegetation and bodies of water is more effective than isolated actions.
European comparison of the Urban Heat Island Atlas (Copernicus) project
Although it is not a Spanish study, the viewer developed by Copernicus for the European Urban Atlas programme offers a comparative analysis between European cities.
Methodology:
The viewer integrates Sentinel-3 thermal imagery, land cover data, and urban mapping to assess the severity of the heat island effect.

Figure 4. Illustration: Infographic showing the main factors causing the urban heat island effect (UHI). Urban areas retain heat due to tall buildings, impermeable surfaces and heat-retaining materials, while green areas are cooler Source: Urban heat islands.
Main results:
This type of tool allows smaller cities to have a first approximation of the phenomenon without the need to develop their own models. As it is based on open and free data, the viewer allows direct consultations by technicians and citizens.
Current limitations and challenges
Despite progress in opening up data, there are still significant challenges:
-
Territorial inequality: not all cities have the same quality and quantity of data.
-
Irregular update: Some sets are released on a one-off basis and are not updated regularly.
-
Low granularity: Data is often aggregated by districts or census tracts, making street-scale interventions difficult.
-
Lack of technical capacities: Many local governments do not have staff specialized in geospatial analysis.
- Little connection with citizens: the knowledge generated from data does not always translate into visible or understandable actions for the population.
Conclusion: building climate resilience from geoespatial data
Urban heat islands are not a new phenomenon, but in the context of climate change they take on a critical dimension. Cities that do not plan based on data will be increasingly exposed to episodes of extreme heat, with unequal impacts among their populations.
Open data—and in particular geospatial data—offers a strategic opportunity to transform this threat into a lever for change. With them we can identify, anticipate, intervene and evaluate. But for this to happen, it is essential to:
· Consolidate accessible, up-to-date and quality data infrastructures.
· To promote collaboration between levels of government, research centres and citizens.
· Train municipal technicians in the use of geospatial tools.
· Promote a culture of evidence-based decision-making and climate sensitivity.
Data does not replace politics, but it allows it to be founded, improved and made more equitable. In a global warming scenario, having open geospatial data is a key tool to make our cities more livable and better prepared for the future.
Content prepared by Mayte Toscano, Senior Consultant in Data Economy Technologies. The contents and points of view reflected in this publication are the sole responsibility of the author.
Blog
Artificial intelligence is no longer a thing of the future: it is here and can become an ally in our daily lives. From making tasks easier for us at work, such as writing emails or summarizing documents, to helping us organize a trip, learn a new language, or plan our weekly menus, AI adapts to our routines to make our lives easier. You don't have to be tech-savvy to take advantage of it; while today's tools are very accessible, understanding their capabilities and knowing how to ask the right questions will maximize their usefulness.
AI Passive and Active Subjects
The applications of artificial intelligence in everyday life are transforming our daily lives. AI already covers multiple fields of our routines. Virtual assistants, such as Siri or Alexa, are among the most well-known tools that incorporate artificial intelligence, and are used to answer questions, schedule appointments, or control devices.
Many people use tools or applications with artificial intelligence on a daily basis, even if it operates imperceptibly to the user and does not require their intervention. Google Maps, for example, uses AI to optimize routes in real time, predict traffic conditions, suggest alternative routes or estimate the time of arrival. Spotify applies it to personalize playlists or suggest songs, and Netflix to make recommendations and tailor the content shown to each user.
But it is also possible to be an active user of artificial intelligence using tools that interact directly with the models. Thus, we can ask questions, generate texts, summarize documents or plan tasks. AI is no longer a hidden mechanism but a kind of digital co-pilot that assists us in our day-to-day lives. ChatGPT, Copilot or Gemini are tools that allow us to use AI without having to be experts. This makes it easier for us to automate daily tasks, freeing up time to spend on other activities.
AI in Home and Personal Life
Virtual assistants respond to voice commands and inform us what time it is, the weather or play the music we want to listen to. But their possibilities go much further, as they are able to learn from our habits to anticipate our needs. They can control different devices that we have in the home in a centralized way, such as heating, air conditioning, lights or security devices. It is also possible to configure custom actions that are triggered via a voice command. For example, a "good morning" routine that turns on the lights, informs us of the weather forecast and the traffic conditions.
When we have lost the manual of one of the appliances or electronic devices we have at home, artificial intelligence is a good ally. By sending a photo of the device, you will help us interpret the instructions, set it up, or troubleshoot basic issues.
If you want to go further, AI can do some everyday tasks for you. Through these tools we can plan our weekly menus, indicating needs or preferences, such as dishes suitable for celiacs or vegetarians, prepare the shopping list and obtain the recipes. It can also help us choose between the dishes on a restaurant's menu taking into account our preferences and dietary restrictions, such as allergies or intolerances. Through a simple photo of the menu, the AI will offer us personalized suggestions.
Physical exercise is another area of our personal lives in which these digital co-pilots are very valuable. We may ask you, for example, to create exercise routines adapted to different physical conditions, goals and available equipment.
Planning a vacation is another of the most interesting features of these digital assistants. If we provide them with a destination, a number of days, interests, and even a budget, we will have a complete plan for our next trip.
Applications of AI in studies
AI is profoundly transforming the way we study, offering tools that personalize learning. Helping the little ones in the house with their schoolwork, learning a language or acquiring new skills for our professional development are just some of the possibilities.
There are platforms that generate personalized content in just a few minutes and didactic material made from open data that can be used both in the classroom and at home to review. Among university students or high school students, some of the most popular options are applications that summarize or make outlines from longer texts. It is even possible to generate a podcast from a file, which can help us understand and become familiar with a topic while playing sports or cooking.
But we can also create our applications to study or even simulate exams. Without having programming knowledge, it is possible to generate an application to learn multiplication tables, irregular verbs in English or whatever we can think of.
How to Use AI in Work and Personal Finance
In the professional field, artificial intelligence offers tools that increase productivity. In fact, it is estimated that in Spain 78% of workers already use AI tools in the workplace. By automating processes, we save time to focus on higher-value tasks. These digital assistants summarize long documents, generate specialized reports in a field, compose emails, or take notes in meetings.
Some platforms already incorporate the transcription of meetings in real time, something that can be very useful if we do not master the language. Microsoft Teams, for example, offers useful options through Copilot from the "Summary" tab of the meeting itself, such as transcription, a summary or the possibility of adding notes.
The management of personal finances has also evolved thanks to applications that use AI, allowing you to control expenses and manage a budget. But we can also create our own personal financial advisor using an AI tool, such as ChatGPT. By providing you with insights into income, fixed expenses, variables, and savings goals, it analyzes the data and creates personalized financial plans.
Prompts and creation of useful applications for everyday life
We have seen the great possibilities that artificial intelligence offers us as a co-pilot in our day-to-day lives. But to make it a good digital assistant, we must know how to ask it and give it precise instructions.
A prompt is a basic instruction or request that is made to an AI model to guide it, with the aim of providing us with a coherent and quality response. Good prompting is the key to getting the most out of AI. It is essential to ask well and provide the necessary information.
To write effective prompts we have to be clear, specific, and avoid ambiguities. We must indicate what the objective is, that is, what we want the AI to do: summarize, translate, generate an image, etc. It is also key to provide it with context, explaining who it is aimed at or why we need it, as well as how we expect the response to be. This can include the tone of the message, the formatting, the fonts used to generate it, etc.
Here are some tips for creating effective prompts:
- Use short, direct and concrete sentences. The clearer the request, the more accurate the answer. Avoid expressions such as "please" or "thank you", as they only add unnecessary noise and consume more resources. Instead, use words like "must," "do," "include," or "list." To reinforce the request, you can capitalize those words. These expressions are especially useful for fine-tuning a first response from the model that doesn't meet your expectations.
- It indicates the audience to which it is addressed. Specify whether the answer is aimed at an expert audience, inexperienced audience, children, adolescents, adults, etc. When we want a simple answer, we can, for example, ask the AI to explain it to us as if we were ten years old.
- Use delimiters. Separate the instructions using a symbol, such as slashes (//) or quotation marks to help the model understand the instruction better. For example, if you want it to do a translation, it uses delimiters to separate the command ("Translate into English") from the phrase it is supposed to translate.
- Indicates the function that the model should adopt. Specifies the role that the model should assume to generate the response. Telling them whether they should act like an expert in finance or nutrition, for example, will help generate more specialized answers as they will adapt both the content and the tone.
- Break down entire requests into simple requests. If you're going to make a complex request that requires an excessively long prompt, it's a good idea to break it down into simpler steps. If you need detailed explanations, use expressions like "Think by step" to give you a more structured answer.
- Use examples. Include examples of what you're looking for in the prompt to guide the model to the answer.
- Provide positive instructions. Instead of asking them not to do or include something, state the request in the affirmative. For example, instead of "Don't use long sentences," say, "Use short, concise sentences." Positive instructions avoid ambiguities and make it easier for the AI to understand what it needs to do. This happens because negative prompts put extra effort on the model, as it has to deduce what the opposite action is.
- Offer tips or penalties. This serves to reinforce desired behaviors and restrict inappropriate responses. For example, "If you use vague or ambiguous phrases, you will lose 100 euros."
- Ask them to ask you what they need. If we instruct you to ask us for additional information we reduce the possibility of hallucinations, as we are improving the context of our request.
- Request that they respond like a human. If the texts seem too artificial or mechanical, specify in the prompt that the response is more natural or that it seems to be crafted by a human.
- Provides the start of the answer. This simple trick is very useful in guiding the model towards the response we expect.
- Define the fonts to use. If we narrow down the type of information you should use to generate the answer, we will get more refined answers. It asks, for example, that it only use data after a specific year.
- Request that it mimic a style. We can provide you with an example to make your response consistent with the style of the reference or ask you to follow the style of a famous author.
While it is possible to generate functional code for simple tasks and applications without programming knowledge, it is important to note that developing more complex or robust solutions at a professional level still requires programming and software development expertise. To create, for example, an application that helps us manage our pending tasks, we ask AI tools to generate the code, explaining in detail what we want it to do, how we expect it to behave, and what it should look like. From these instructions, the tool will generate the code and guide us to test, modify and implement it. We can ask you how and where to run it for free and ask for help making improvements.
As we've seen, the potential of these digital assistants is enormous, but their true power lies in large part in how we communicate with them. Clear and well-structured prompts are the key to getting accurate answers without needing to be tech-savvy. AI not only helps us automate routine tasks, but it expands our capabilities, allowing us to do more in less time. These tools are redefining our day-to-day lives, making it more efficient and leaving us time for other things. And best of all: it is now within our reach.
Blog
The European Union is at the forefront of the development of safe, ethical and people-centred artificial intelligence (AI). Through a robust regulatory framework, based on human rights and fundamental values, the EU is building an AI ecosystem that simultaneously benefits citizens, businesses and public administrations. As part of its commitment to the proper development of this technology, the European Commission has proposed a set of actions to promote its excellence.
In this regard, a pioneering piece of legislation that establishes a comprehensive legal framework stands out: the AI Act. It classifies artificial intelligence models according to their level of risk and establishes specific obligations for providers regarding data and data governance. In parallel, the Coordinated Plan on AI updated in 2021 sets out a roadmap to boost investment, harmonise policies and encourage the uptake of AI across the EU.
Spain is aligned with Europe in this area and therefore has a strategy to accelerate its development and expansion.. In addition, the transposition of the AI law has recently been approved, with the preliminary draft law for an ethical, inclusive and beneficial use of artificial intelligence.
European projects transforming key sectors
In this context, the EU is funding numerous projects that use artificial intelligence technologies to solve challenges in various fields. Below, we highlight some of the most innovative ones, some of which have already been completed and some of which are underway:
Agriculture and food sustainability
Projects currently underway:
-
ANTARES: develops smart sensor technologies and big data to help farmers produce more food in a sustainable way, benefiting society, farm incomes and the environment.
Examples of other completed projects:
-
Pantheon: developed a control and data acquisition system, equivalent to industrial SCADA, for precision farming in large hazelnut orchards, increasing production, reducing chemical inputs and simplifying management.
-
Trimbot2020: researched robotics and vision technologies to create the first outdoor gardening robot, capable of navigating varied terrain and trimming rose bushes, hedges and topiary.
Industry and manufacturing
Projects currently underway:
-
SERENA: applies AI techniques to predict maintenance needs of industrial equipment, reducing costs and time, and improving the productivity of production processes..
-
SecondHands: has developed a robot capable of proactively assisting maintenance technicians by recognising human activity and anticipating their needs, increasing efficiency and productivity in industrial environments.
Examples of other completed projects:
-
QU4LITY: combined data and AI to increase manufacturing sustainability, providing a data-shared, SME-friendly, standardised and transformative zero-defect manufacturing model.
-
KYKLOS 4.0: explored how cyber-physical systems, product lifecycle management, augmented reality and AI can transform circular manufacturing through seven large-scale pilot projects.
Transport and mobility
Projects currently underway
-
VI-DAS: A project by a Spanish company working on advanced driver assistance systems and navigation aids, combining traffic understanding with consideration of the driver's physical, mental and behavioural state to improve road safety.
-
PILOTING: adapts, integrates and demonstrates robotic solutions in an integrated platform for the inspection and maintenance of refineries, bridges and tunnels.. One of its focuses is on boosting production and access to inspection data.
Examples of other completed projects:
- FABULOS: has developed and tested a local public transport system using autonomous minibuses, demonstrating its viability and promoting the introduction of robotic technologies in public infrastructure.
Social impact research
Projects currently underway:
-
HUMAINT: provides a multidisciplinary understanding of the current state and future evolution of machine intelligence and its potential impact on human behaviour, focusing on cognitive and socio-emotional capabilities.
-
AI Watch: monitors industrial, technological and research capacity, policy initiatives in Member States, AI adoption and technical developments, and their impact on the economy, society and public services.
Examples of other completed projects:
-
TECHNEQUALITY: examined the potential social consequences of the digital age, looking at how AI and robots affect work and how automation may impact various social groups differently.
Health and well-being
Projects currently underway:
-
DeepHealth: develops advanced tools for medical image processing and predictive modelling, facilitating the daily work of healthcare personnel without the need to combine multiple tools..
-
BigO: collects and analyses anonymised data on child behaviour patterns and their environment to extract evidence on local factors involved in childhood obesity.
Examples of other completed projects:
-
PRIMAGE: has created a cloud-based platform to support decision making for malignant solid tumours, offering predictive tools for diagnosis, prognosis and monitoring, using imaging biomarkers and simulation of tumour growth..
-
SelfBACK: provided personalised support to patients with low back pain through a mobile app, using sensor-collected data to tailor recommendations to each user.
-
EYE-RISK: developed tools that predict the likelihood of developing age-related eye diseases and measures to reduce this risk, including a diagnostic panel to assess genetic predisposition.
- Solve-RD: improved diagnosis of rare diseases by pooling patient data and advanced genetic methods.
The future of AI in Europe
These examples, both past and present, are very interesting use cases of the development of artificial intelligence in Europe. However, the EU's commitment to AI is also forward-looking. And it is reflected in an ambitious investment plan: the Commission plans to invest EUR 1 billion per year in AI, from the Digital Europe and Horizon Europe programmes, with the aim of attracting more than EUR 20 billion of total AI investment per year during this decade..
The development of an ethical, transparent and people-centred IA is already an EU objective that goes beyond the legal framework. With a hands-on approach, the European Union funds projects that not only drive technological innovation, but also address key societal challenges, from health to climate change, building a more sustainable, inclusive and prosperous future for all European citizens.