Application
ContratosMenores.es is a website that provides information on minor contracts carried out in Spain since January 2022. Through this application you can locate the contracts according to their classification in the Common Procurement Vocabulary (CPV), following the hierarchical tree of public procurement bodies, with a free text search, or from different rankings, for example, of most expensive contracts, most frequent awardees and others.
In the file of each organization and of each awardee, details are given of their outstanding relations with other entities, the most frequent categories of their contracts, similar companies, duration of the contracts, amount, and much more.
In the case of the awarded companies, a map is drawn with the location of the contracts they have received.
The website is completely free, does not require registration, and is updated daily, starting with more than one million registered minor contracts.
Blog
The Spanish Federation of Municipalities and Provinces (FEMP) approved at the end of 2023 two model ordinances that address progress in two key areas: transparency and data governance. Both documents will not only improve the quality of processes, but also facilitate access, management and re-use of data. In this post, we will analyse the second ordinance drafted within the FEMP's Network of Entities for Transparency and Citizen Participation in its quest to define common reference models. In particular, the ordinance on data governance.
The usefulness and good work of the Model Ordinance on Data Governance in Local Entities has been highlighted by the Multisectoral Association of Information (ASEDIE), which awarded it the prize in the category 'Promoting data literacy' at its 15th ASEDIE International Conference.
Under this premise, the document addresses all elements related to the collection, management and exploitation of data in order to approach them as a commongood, i.e. ensuring their openness, accessibility and re-use. This is a relevant objective for local administrations, as it enables them to improve their functioning, service delivery and decision-making. Data governance is the framework that guides and guarantees this process and this ordinance proposes a flexible regulatory framework that different administrations can adapt according to their specific needs.
What is data governance?
Data Governance comprehensively addresses all aspects related to the collection, management and exploitation of data, as well as its openness and re-use by society as a whole on an equal basis. Itcan therefore bedefined as an organisational function responsible for being accountable for the effective, efficient and acceptable use of databy the organisation, which is necessary to deliver the business strategy. This is described in the specifications UNE 0077:2023 on Data Governance and UNE 78:2023 on Data Management, which include standardised processes to guide organisations in the establishment of approved and validated mechanisms that provide organisational support to aspects related to the opening and publication of data, for subsequent use by citizens and other institutions.
How was the FEMP Data Governance Ordinance developed?
In order to develop the Model Ordinance on Data Governance in the Local Entity, a multidisciplinary working group was set up in 2022, which included workers from the Public Administrations, private companies, representatives of the infomediary sector, the Data Office, universities, etc. This team set out two main objectives that would mark the content of the document:
- Develop guidelines for municipalities and other public authorities defining the strategy to be followed in order to implement an open data project.
- Create a reference model of datasets common to all public administrations to facilitate the re-use of information.
With these two challenges in mind, in early 2023 the FEMP working group started to establish aspects, structure, contents and work plan. During the following months, work was carried out to draft, elaborate and reach consensus on a single draft.
In addition, a participatory process was organised on the Idea Zaragoza platform to nurture the document with contributions from experts from all over the country and FEMP partners.
The result of all the work was based on the Open Data Charter (ODC), the recommendations issued by the Spanish Government's Data Office and the existing European and national regulations on this matter.
New features and structure of the Data Governance Ordinance
The FEMP's Model Ordinance on Data Governance is in line with the context in which it has been presented, i.e. it recognises relevant aspects of the current moment we are living in. One of the document's salient features is the premise of guaranteeing and enhancing the rights of both natural and legal persons and respecting the General Data Protection Regulation. The regulation places particular emphasis on the proportionality of anonymisation to ensure the privacy of individuals.
Another novel aspect of the standard is that it brings the vision of high-value data defined by the European Commission from the perspective of local government. In addition, the Model Ordinance recognises a single regime for access and re-use of public information, in accordance with Law 19/2013 of 9 December on transparency, access to public information and good governance, and Law 37/2007 on the re-use of public sector information.
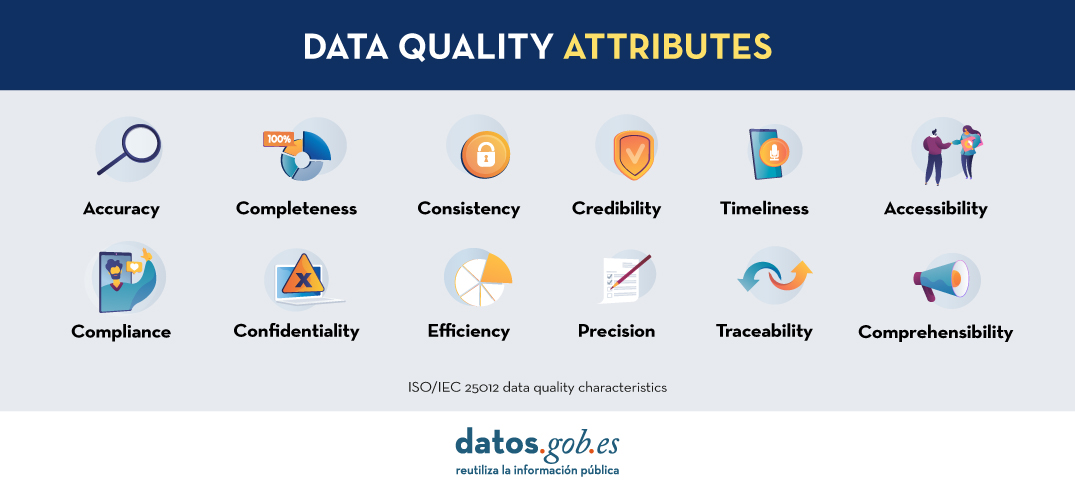
Beyond ensuring the legal and regulatory framework, the FEMP Ordinance also addresses the data associated with artificial intelligence, a cutting-edge technological synergy that every day offers great innovative solutions. For an artificial intelligence to function properly, it is necessary to have quality data to help train it. In relation to this point, the ordinance defines quality requirements (Article 18) and metrics for their assessment that are adapted to each specific context and address issues such as accuracy, portability or confidentiality, among others. The document establishes guarantees that the use of the data will be carried out in a way that respects the rights of individuals.
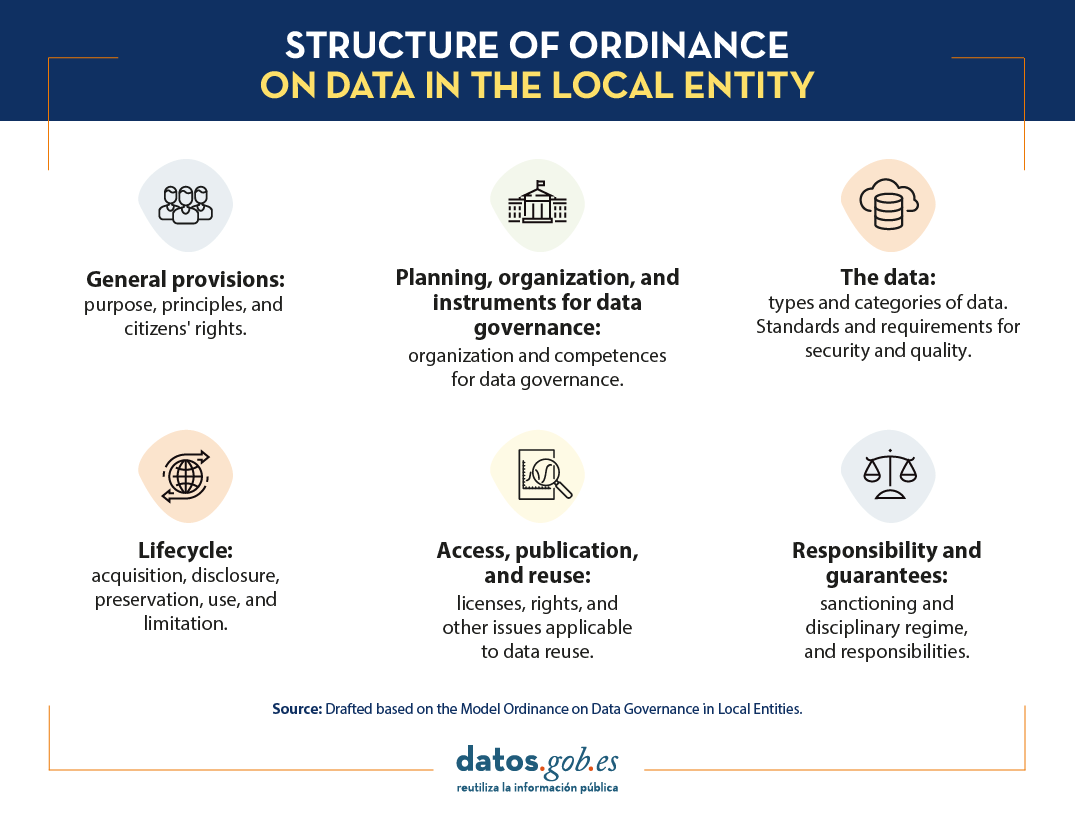
All these new aspects are part of the FEMP's Model Ordinance on Data Governance for Local Entities, which is organised in the following structure:
- General provisions: This first section presents data as the main digital asset of Public Administrations as a strategic asset, and the object, principles and right of citizenship.
- Planning, organisation and tools for data governance: Here the organisation and competencies for data governance are defined. In addition, the importance of maintaining an inventory of datasets and information sources is stressed (Article 9).
- The data: This chapter recognises the publication requirements and security standards, the importance of the use of reference vocabularies, and the categories of datasets whose openness should be prioritised, namely the 80 typologies referred to by FEMP as most relevant.
- Life cycle: This section highlights, on the one hand, the collection, opening, storage and use of data; and, on the other hand, the limits, deletion and destruction of data when these actions are required. when these actions are required.
- Access, publication and re-use: The fifth chapter deals with issues related to the exploitation of data such as the use of specific licences, exclusive rights, payment for re-use or prior request for access to certain datasets.
- Liability and guarantees: The last point describes the sanctioning and disciplinary regime and the civil and criminal liabilities of the re-user.
In short, the publication of the Ordinance on Data Governance in Local Entities provides local administrations with a flexible regulation and defines administrative structures that seek to improve management, reuse and the promotion of a data-driven society.
You can access the full document here: Standard Ordinance on Data Governance in the Local Entity
Noticia
The Centre de documentació i biblioteca del Institut Català d'Arqueologia Clàssica (ICAC) has the repository Open Science ICAC. This website is a space where science is shared in an accessible and inclusive way. The space introduces recommendations and advises on the process of publishing content. Also, on how to make the data generated during the research process available for future research work.
The website, in addition to being a repository of scientific research texts, is also a place to find tools and tips on how to approach the research data management process in each of its phases: before, during and at the time of publication.
- Before you begin: create a data management plan to ensure that your research proposal is as robust as possible. The Data Management Plan (DMP) is a methodological document that describes the life cycle of the data collected, generated and processed during a research project, a doctoral thesis, etc.
- During the research process: at this point it points out the need to unify the nomenclature of the documents to be generated before starting to collect files or data, in order to avoid an accumulation of disorganised content that will lead to lost or misplaced data. In addition, this section provides information on directory structure, folder names and file names, the creation of a txt file (README) describing the nomenclatures or the use of short, descriptive names such as project name/acronym, file creation date, sample number or version number. Recommendations on how to structure each of these fields so that they are reusable and easily searchable can also be found on the website.
- Publication of research data: in addition to the results of the research itself in the form of a thesis, dissertation, paper, etc., it recommends the publication of the data generated by the research process itself. The ICAC itself points out that research data remains valuable after the research project for which it was generated has ended, and that sharing data can open up new avenues of research without future researchers having to recreate and collect identical data. Finally, it outlines how, when and what to consider when publishing research data.
Graphical content for improving the quality of open data
Recently, the ICAC has taken a further step to encourage good practice in the use of open data. To this end, it has developed a series of graphic contents based on the "Practical guide for the improvement of the quality of open data"produced by datos.gob.es. Specifically, the cultural body has produced four easy-to-understand infographics, in Catalan and English, on good practices with open data in working with databases and spreadsheets, texts and docs and CSV format.
All the infographics resulting from the adaptation of the guide are available to the general public and also to the centre's research staff at Recercat, Catalonia's research repository. Soon it will also be available on the Open Science website of the Institut Català d'Arqueologia Clàssica (ICAC)open Science ICAC.
The infographics produced by the ICAC review various aspects. The first ones contain general recommendations to ensure the quality of open data, such as the use of standardised character encoding, such as UTF-8, or naming columns correctly, using only lowercase letters and avoiding spaces, which are replaced by hyphens. Among the recommendations for generating quality data, they also include how to show the presence of null or missing data or how to manage data duplication, so that data collection and processing is centralised in a single system so that, in case of duplication, it can be easily detected and eliminated.
The latter deal with how to set the format of thenumerical figures and other data such as dates, so that they follow the ISO standardised system, as well as how to use dots as decimals. In the case of geographic information, as recommended by the Guide, its materials also include the need to reserve two columns for inserting the longitude and latitude of the geographic points used.
The third theme of these infographics focuses on the development of good databases or spreadsheets databases or spreadsheetsso that they are easily reusable and do not generate problems when working with them. Among the recommendations that stand out are consistency in generating names or codes for each item included in the data collection, as well as developing a help guide for the cells that are coded, so that they are intelligible to those who need to reuse them.
In the section on texts and documents within these databases, the infographics produced by the Institut Català d'Arqueologia Clàssica include some of the most important recommendations for creating texts and ensuring that they are preserved in the best possible way. Among them, it points to the need to save attachments to text documents such as images or spreadsheets separately from the text document. This ensures that the document retains its original quality, such as the resolution of an image, for example.
Finally, the fourth infographic that has been made available contains the most important recommendations for working with CSV format working with CSV format (comma separated value) format, such as creating a CSV document for each table and, in the case of working with a document with several spreadsheets, making them available independently. It also notes in this case that each row in the CSV document has the same number of columns so that they are easily workable and reusable, without the need for further clean-up.
As mentioned above, all infographics follow the recommendations already included in the Practical guide for improving the quality of open data.
The guide to improving open data quality
The "Practical guide for improving the quality of open data" is a document produced by datos.gob.es as part of the Aporta Initiative and published in September 2022. The document provides a compendium of guidelines for action on each of the defining characteristics of quality, driving quality improvement. In turn, this guide takes the data.europe.eu data quality guide, published in 2021 by the Publications Office of the European Union, as a reference and complements it so that both publishers and re-users of data can follow guidelines to ensure the quality of open data.
In summary, the guide aims to be a reference framework for all those involved in both the generation and use of open data so that they have a starting point to ensure the suitability of data both in making it available and in assessing whether a dataset is of sufficient quality to be reused in studies, applications, services or other.
Blog
Digital technology and algorithms have revolutionised the way we live, work and communicate. While promising efficiency, accuracy and convenience, these technologies can exacerbate prejudice and social inequalities exacerbate prejudice and social inequalities and create new forms of exclusion and create new forms of exclusion. Thus, invisibilisation and discrimination, which have always existed, take on new forms in the age of algorithms.
Lack of interest and data leads to algorithmic invisibilisation, leading to two types of algorithmic neglect. The first of these is among the world's underserved, which includes the millions who do not have a smartphone or a bank account millions who do not have a smartphone or a bank account, and are thus on the margins of the platform economy and who are therefore on the margins of the platform economy and, for algorithms, do not exist. The second type of algorithmic abandonment includes individuals or groups who are victims of the failure of the algorithmic system, as was the case with SyRI(Systeem Risico Indicatie)SyRI(Systeem Risico Indicatie) in the Netherlands that unfairly singled out some 20,000 families from low socio-economic backgrounds for tax fraud, leading many to ruin by 2021. The algorithm, which the algorithm, which was declared illegal by a court in The Hague months later, was applied in the country's poorest neighbourhoodsthe algorithm, which was declared illegal by a court in The Hague months later, was applied in the country's poorest neighbourhoods the algorithm, which was declared illegal by a court in The Hague months later, was applied in the poorest neighbourhoods of the country and blocked many families with more than one nationality from receiving the social benefits to which they were entitled because of their socio-economic status.
Beyond the example in the Dutch public system, invisibilisation and discrimination can also originate in the private sector. One example is Amazon's amazon's job posting algorithm which showed a bias against women by learning from historical data - i.e. incomplete data because it did not include a large and representative universe - leading Amazon to abandon the project. which showed a bias against women by learning from historical data - i.e. incomplete data because it did not include a large and representative universe - leading Amazon to abandon the project. Another example is Apple Card, a credit card backed by Goldman Sachs, which was also singled out when its algorithm was found to offer more favourable credit limits to men than to women.
In general, invisibility and algorithmic discrimination, in any field, can lead to unequal access to resources and exacerbate social and economic exclusion.
Making decisions based on algorithms
Data and algorithms are interconnected components in computing and information processing. Data serve as a basis, but can be unstructured, with excessive variability and incompleteness. Algorithms are instructions or procedures designed to process and structure this data and extract meaningful information, patterns or results.
The quality and relevance of the data directly impacts the effectiveness of the algorithms, as they rely on the data inputs to generate results. Hence, the principle "rubbish in, rubbish out"which summarises the idea that if poor quality, biased or inaccurate data enters a system or process, the result will also be of poor quality or inaccurate. On the other hand, well-designed well-designed algorithms can enhance the value of data by revealing hidden relationships or making by revealing hidden relationships or making predictions.
This symbiotic relationship underscores the critical role that both data and algorithms play in driving technological advances, enabling informed decision making, and This symbiotic relationship underscores the critical role that both data and algorithms play in driving technological advances, enabling informed decision making, and fostering innovation.
Algorithmic decision making refers to the process of using predefined sets of instructions or rules to analyse data and make predictions to aid decision making. Increasingly, it is being applied to decisions that have to do with social welfare social welfare and the provision of commercial services and products through platforms. This is where invisibility or algorithmic discrimination can be found.
Increasingly, welfare systems are using data and algorithms to help make decisions on issues such as who should receive what kind of care and who is at risk. These algorithms consider different factors such as income, family or household size, expenditures, risk factors, age, sex or gender, which may include biases and omissions.
That is why the That is why the Special Rapporteur on extreme poverty and human rights, Philip Alston, warned in a report to the UN General Assembly that the uncautious adoption of these can lead to dystopian social welfare dystopian social welfare. In such a dystopian welfarestate , algorithms are used to reduce budgets, reduce the number of beneficiaries, eliminate services, introduce demanding and intrusive forms of conditionality, modify behaviour, impose sanctions and "reverse the notion that the state is accountable".
Algorithmic invisibility and discrimination: Two opposing concepts
Although data and algorithms have much in common, algorithmic invisibility and discrimination are two opposing concepts. Algorithmic invisibility refers to gaps in data sets or omissions in algorithms, which result in inattentions in the application of benefits or services. In contrast, algorithmic discrimination speaks to hotspots that highlight specific communities or biased characteristics in datasets, generating unfairness.
That is, algorithmic invisibilisation occurs when individuals or groups are absent from datasets, making it impossible to address their needs. For example, integrating data on women with disabilities into social decision-making can be vital for the inclusion of women with disabilities in society. Globally, women are more vulnerable to algorithmic invisibilisation than men, as they have less access to digital technology have less access to digital technology and leave fewer digital traces.
Opaque algorithmic systems that incorporate stereotypes can increase invisibilisation and discrimination by hiding or targeting vulnerable individuals or populations. An opaque algorithmic system is one that does not allow access to its operation.
On the other hand, aggregating or disaggregating data without careful consideration of the consequences can result in omissions or errors result in omissions or errors. This illustrates the double-edged nature of accounting; that is, the ambivalence of technology that quantifies and counts, and that can serve to improve people's lives, but also to harm them.
Discrimination can arise when algorithmic decisions are based on historical data, which usually incorporate asymmetries, stereotypes and injustices, because more inequalities existed in the past. The "rubbish in, rubbish out" effect occurs if the data is skewed, as is often the case with online content. Also, biased or incomplete databases can be incentives for algorithmic discrimination. Selection biases may arise when facial recognition data, for example, is based on the features of white men, while the users are dark-skinned women, or on online content generated by a minority of agentswhich makes generalisation difficult.
As can be seen, tackling invisibility and algorithmic discrimination is a major challenge that can only be solved through awareness-raising and collaboration between institutions, campaigning organisations, businesses and research.
Content prepared by Miren Gutiérrez, PhD and researcher at the University of Deusto, expert in data activism, data justice, data literacy and gender disinformation.
The contents and views reflected in this publication are the sole responsibility of the author.
Blog
The UNESCO (United Nations Educational, Scientific and Cultural Organization) is a United Nations agency whose purpose is to contribute to peace and security in the world through education, science, culture and communication. In order to achieve its objective, this organisation usually establishes guidelines and recommendations such as the one published on 5 July 2023 entitled 'Open data for AI: what now?'
In the aftermath of the COVID-19 pandemic the UNESCO highlights a number of lessons learned:
- Policy frameworks and data governance models must be developed, supported by sufficient infrastructure, human resources and institutional capacities to address open data challenges, in order to be better prepared for pandemics and other global challenges.
- The relationship between open data and AI needs to be further specified, including what characteristics of open data are necessary to make it "AI-Ready".
- A data management, collaboration and sharing policy should be established for research, as well as for government institutions that hold or process health-related data, while ensuring data privacy through anonymisation and anonymisation data privacy should be ensured through anonymisation and anonymisation.
- Government officials who handle data that are or may become relevant to pandemics may need training to recognise the importance of such data, as well as the imperative to share them.
- As much high quality data as possible should be collected and collated. The data needs to come from a variety of credible sources, which, however, must also be ethical, i.e. it must not include data sets with biases and harmful content, and it must be collected only with consent and not in a privacy-invasive manner. In addition, pandemics are often rapidly evolving processes, so continuous updating of data is essential.
- These data characteristics are especially mandatory for improving inadequate AI diagnostic and predictive tools in the future. Efforts are needed to convert the relevant data into a machine-readable format, which implies the preservation of the collected data, i.e. cleaning and labelling.
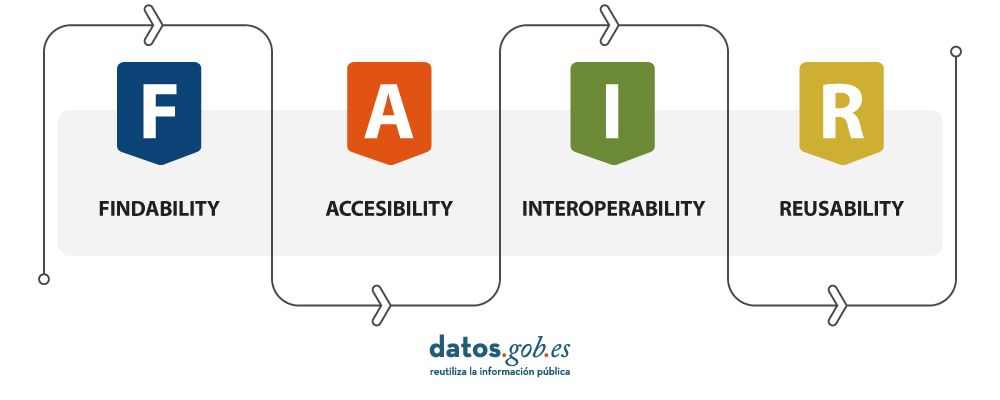
- A wide range of pandemic-related data should be opened up, adhering to the FAIR principles.
- The target audience for pandemic-related open data includes research and academia, decision-makers in governments, the private sector for the development of relevant products, but also the public, all of whom should be informed about the available data.
- Pandemic-related open data initiatives should be institutionalised rather than ad hoc, and should therefore be put in place for future pandemic preparedness. These initiatives should also be inclusive and bring together different types of data producers and users.
- The beneficial use of pandemic-related data for AI machine learning techniques should also be regulated to prevent misuse for the development of artificial pandemics, i.e. biological weapons, with the help of AI systems.
The UNESCO builds on these lessons learned to establish Recommendations on Open Science by facilitating data sharing, improving reproducibility and transparency, promoting data interoperability and standards, supporting data preservation and long-term access.
As we increasingly recognise the role of Artificial Intelligence (AI), the availability and accessibility of data is more crucial than ever, which is why UNESCO is conducting research in the field of AI to provide knowledge and practical solutions to foster digital transformation and build inclusive knowledge societies.
Open data is the main focus of these recommendations, as it is seen as a prerequisite for planning, decision-making and informed interventions. The report therefore argues that Member States must share data and information, ensuring transparency and accountability, as well as opportunities for anyone to make use of the data.
UNESCO provides a guide that aims to raise awareness of the value of open data and specifies concrete steps that Member States can take to open their data. These are practical, but high-level steps on how to open data, based on existing guidelines. Three phases are distinguished: preparation, data opening and follow-up for re-use and sustainability, and four steps are presented for each phase.
It is important to note that several of the steps can be carried out simultaneously, i.e. not necessarily consecutively.
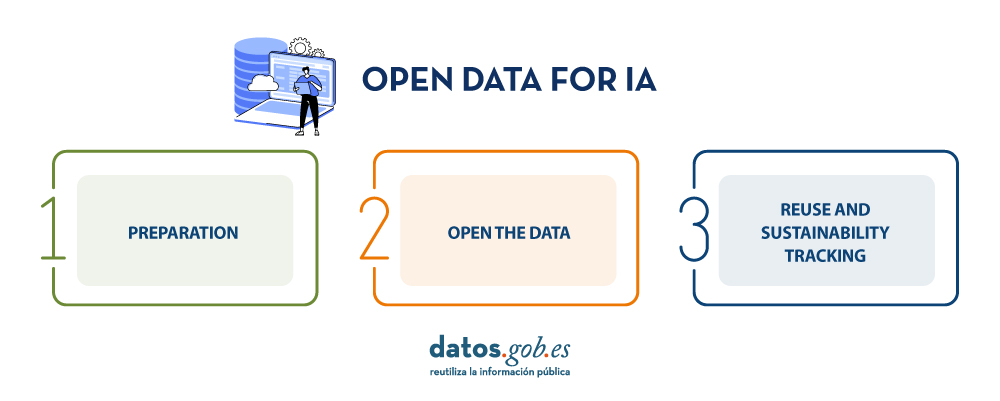
Step 1: Preparation
- Develop a data management and sharing policy: A data management and sharing policy is an important prerequisite for opening up data, as such a policy defines the governments' commitment to share data. The Open Data Institute suggests the following elements of an open data policy:
- A definition of open data, a general statement of principles, an outline of the types of data and references to any relevant legislation, policy or other guidance.
- Governments are encouraged to adhere to the principle "as open as possible, as closed as necessary". If data cannot be opened for legal, privacy or other reasons, e.g. personal or sensitive data, this should be clearly explained.
In addition, governments should also encourage researchers and the private sector in their countries to develop data management and sharing policies that adhere to the same principles.
- Collect and collate high quality data: Existing data should be collected and stored in the same repository, e.g. from various government departments where it may have been stored in silos. Data must be accurate and not out of date. Furthermore, data should be comprehensive and should not, for example, neglect minorities or the informal economy. Data on individuals should be disaggregated where relevant, including by income, sex, age, race, ethnicity, migration status, disability and geographic location.
- Develop open data capabilities: These capacities address two groups:
- For civil servants, it includes understanding the benefits of open data by empowering and enabling the work that comes with open data.
- For potential users, it includes demonstrating the opportunities of open data, such as its re-use, and how to make informed decisions.
- Prepare data for AI: If data is not only to be used by humans, but can also feed AI systems, it must meet a few more criteria to be AI-ready.
- The first step in this regard is to prepare the data in a machine-readable format.
- Some formats are more conducive to readability by artificial intelligence systems than others.
- Data must also be cleaned and labelled, which is often time-consuming and therefore costly.
The success of an AI system depends on the quality of the training data, including its consistency and relevance. The required amount of training data is difficult to know in advance and must be controlled by performance checks. The data should cover all scenarios for which the AI system has been created.
Step 2: Open the data
- Select the datasets to be opened: The first step in opening the data is to decide which datasets are to be opened. The criteria in favour of openness are:
- If there have been previous requests to open these data
- Whether other governments have opened up this data and whether this has led to beneficial uses of the data.
Openness of data must not violate national laws, such as data privacy laws.
- Open the datasets legally: Before opening the datasets, the relevant government has to specify exactly under which conditions, if any, the data can be used. In publishing the data, governments may choose the license that best suits their objectives, such as the creative Commons and Open. To support the licence selection the European Commission makes available JLA - Compatibility Checkera tool that supports this decision
- Open the datasets technically: The most common way to open the data is to publish it in electronic format for download on a website, and APIs must be in place for the consumption of this data, either by the government itself or by a third party.
Data should be presented in a format that allows for localisation, accessibility, interoperability and re-use, thus complying with the FAIR principles.
In addition, the data could also be published in a data archive or repository, which should be, according to the UNESCO Recommendation, supported and maintained by a well-established academic institution, learned society, government agency or other non-profit organisation dedicated to the common good that allows for open access, unrestricted distribution, interoperability and long-term digital archiving and preservation.
- Create a culture driven by open data: Experience has shown that, in addition to legal and technical openness of data, at least two other things need to be achieved to achieve an open data culture:
- Government departments are often not used to sharing data and it has been necessary to create a mindset and educate them to this end.
- Furthermore, data should, if possible, become the exclusive basis for decision-making; in other words, decisions should be based on data.
- In addition, cultural changes are required on the part of all staff involved, encouraging proactive disclosure of data, which can ensure that data is available even before it is requested.
Step 3: Monitoring of re-use and sustainability
- Support citizen participation: Once the data is open, it must be discoverable by potential users. This requires the development of an advocacy strategy, which may include announcing the openness of the data in open data communities and relevant social media channels.
Another important activity is early consultation and engagement with potential users, who, in addition to being informed about open data, should be encouraged to use and re-use it and to stay involved.
- Supporting international engagement: International partnerships would further enhance the benefits of open data, for example through south-south and north-south collaboration. Particularly important are partnerships that support and build capacity for data reuse, whether using AI or not.
- Support beneficial AI participation: Open data offers many opportunities for AI systems. To realise the full potential of data, developers need to be empowered to make use of it and develop AI systems accordingly. At the same time, the abuse of open data for irresponsible and harmful AI applications must be avoided. A best practice is to keep a public record of what data AI systems have used and how they have used it.
- Maintain high quality data: A lot of data quickly becomes obsolete. Therefore, datasets need to be updated on a regular basis. The step "Maintain high quality data" turns this guideline into a loop, as it links to the step "Collect and collate high quality data".
Conclusions
These guidelines serve as a call to action by UNESCO on the ethics of artificial intelligence. Open data is a necessary prerequisite for monitoring and achieving sustainable development monitoring and achieving sustainable development.
Due to the magnitude of the tasks, governments must not only embrace open data, but also create favourable conditions for beneficial AI engagement that creates new insights from open data for evidence-based decision-making.
If UNESCO Member States follow these guidelines and open their data in a sustainable way, build capacity, as well as a culture driven by open data, we can achieve a world where data is not only more ethical, but where applications on this data are more accurate and beneficial to humanity.
References
https://www.unesco.org/en/articles/open-data-ai-what-now
Author : Ziesche, Soenke , ISBN : 978-92-3-100600-5
Content prepared by Mayte Toscano, Senior Consultant in Data Economy Technologies. The contents and points of view reflected in this publication are the sole responsibility of its author.
Blog
In the era dominated by artificial intelligence that we are just beginning, open data has rightfully become an increasingly valuable asset, not only as a support for transparency but also for the progress of innovation and technological development in general.
The opening of data has brought enormous benefits by providing public access to datasets that promote government transparency initiatives, stimulate scientific research, and foster innovation in various sectors such as health, education, agriculture, and climate change mitigation.
However, as data availability increases, so does concern about privacy, as the exposure and mishandling of personal data can jeopardize individuals' privacy. What tools do we have to strike a balance between open access to information and the protection of personal data to ensure people's privacy in an already digital future?
Anonymization and Pseudonymization
To address these concerns, techniques like anonymization and pseudonymization have been developed, although they are often confused. Anonymization refers to the process of modifying a dataset to eliminate a reasonable probability of identifying an individual within it. It is important to note that, in this case, after processing, the anonymized dataset would no longer fall under the scope of the General Data Protection Regulation (GDPR). This data.gob.es report analyzes three general approaches to data anonymization: randomization, generalization, and pseudonymization.
On the other hand, pseudonymization is the process of replacing identifiable attributes with pseudonyms or fictitious identifiers in a way that data cannot be attributed to the individual without using additional information. Pseudonymization generates two new datasets: one containing pseudonymized information and the other containing additional information that allows the reversal of anonymization. Pseudonymized datasets and the linked additional information fall under the scope of the General Data Protection Regulation (GDPR). Furthermore, this additional information must be separated and subject to technical and organizational measures to ensure that personal data cannot be attributed to an individual.
Consent
Another key aspect of ensuring privacy is the increasingly prevalent "unambiguous" consent of individuals, where people express awareness and agreement on how their data will be treated before it is shared or used. Organizations and entities that collect data need to provide clear and understandable privacy policies, but there is also a growing need for more education on data handling to help people better understand their rights and make informed decisions.
In response to the growing need to properly manage these consents, technological solutions have emerged that seek to simplify and enhance the process for users. These solutions, known as Consent Management Platforms (CMPs), originally emerged in the healthcare sector and allow organizations to collect, store, and track user consents more efficiently and transparently. These tools offer user-friendly and visually appealing interfaces that facilitate understanding of what data is being collected and for what purpose. Importantly, these platforms provide users with the ability to modify or withdraw their consent at any time, giving them greater control over their personal data.
Artificial Intelligence Training
Training artificial intelligence (AI) models is becoming one of the most challenging areas in privacy management due to the numerous dimensions that need to be considered. As AI continues to evolve and integrate more deeply into our daily lives, the need to train models with large amounts of data increases, as evidenced by the rapid advances in generative AI over the past year. However, this practice often faces profound ethical and privacy dilemmas because the most valuable data in some scenarios is not open at all.
Advancements in technologies like federated learning, which allows AI algorithms to be trained through a decentralized architecture composed of multiple devices containing their own local and private data, are part of the solution to this challenge. This way, explicit data exchange is avoided, which is crucial in applications such as healthcare, defense, or pharmacy.
Additionally, techniques like differential privacy are gaining traction. Differential privacy ensures, through the addition of random noise and mathematical functions applied to the original data, that there is no loss of utility in the results obtained from the data analysis to which this technique is applied.
Web3
But if any advancement promises to revolutionize our interaction on the internet, providing greater control and ownership of user data, it would be web3. In this new paradigm, privacy management is inherent in its design. With the integration of technologies like blockchain, smart contracts, and decentralized autonomous organizations (DAOs), web3 seeks to give individuals full control over their identity and all their data, eliminating intermediaries and potentially reducing privacy vulnerabilities.
Unlike current centralized platforms where user data is often "owned" or controlled by private companies, web 3.0 aspires to make each person the owner and manager of their own information. However, this decentralization also presents challenges. Therefore, while this new era of the web unfolds, robust tools and protocols must be developed to ensure both freedom and privacy for users in the digital environment.
Privacy in the era of open data, artificial intelligence, and web3 undoubtedly requires working with delicate balances that are often unstable. Therefore, a new set of technological solutions, resulting from collaboration between governments, companies, and citizens, will be essential to maintain this balance and ensure that, while enjoying the benefits of an increasingly digital world, we can also protect people's fundamental rights.
Content prepared by Jose Luis Marín, Senior Consultant in Data, Strategy, Innovation & Digitalization.
The content and views reflected in this publication are the sole responsibility of the author.
Application
The UNA Women application offers a personalized dashboard with training options for young women according to their socioeconomic circumstances.
The main objective of the project is to contribute to reducing the gender employment gap. For this purpose, the company ITER IDEA has used more than 6 million lines of data processed from different sources, such as data.europa.eu, Eurostat, Censis, Istat (Italian National Institute of Statistics) or NUMBEO.
In terms of user experience, the application first asks the user to fill in a form to find out key data about the person seeking information: age, education or professional sector, training budget, etc. Once the data has been collected, the app offers an interactive map with all the training options in Europe. Each city has a panel that shows interesting data about studies, cost of living in the city, etc.
Blog
The "Stories of Use Cases" series, organized by the European Open Data portal (data.europe.eu), is a collection of online events focused on the use of open data to contribute to common European Union objectives such as consolidating democracy, boosting the economy, combating climate change, and driving digital transformation. The series comprises four events, and all recordings are available on the European Open Data portal's YouTube channel. The presentations used to showcase each case are also published.
In a previous post on datos.gob.es, we explained the applications presented in two of the series' events, specifically those related to the economy and democracy. Now, we focus on use cases related to climate and technology, as well as the open datasets used for their development.
Open data has enabled the development of applications offering diverse information and services. In terms of climate, some examples can trace waste management processes or visualize relevant data about organic agriculture. Meanwhile, the application of open data in the technological sphere facilitates process management. Discover the highlighted examples by the European Open Data portal!
Open Data for Fulfilling the European Green Deal
The European Green Deal is a strategy by the European Commission aiming to achieve climate neutrality in Europe by 2050 and promote sustainable economic growth. To reach this objective, the European Commission is working on various actions, including reducing greenhouse gas emissions, transitioning to a circular economy, and improving energy efficiency. Under this common goal and utilizing open datasets, three applications have been developed and presented in one of the webinars of the series on data.europe.eu use cases: Eviron Mate, Geofluxus, and MyBioEuBuddy.
- Eviron Mate: It's an educational project aimed at raising awareness among young people about climate change and related data. To achieve this goal, Eviron Mate utilizes open data from Eurostat, the Copernicus Program and data.europa.eu.
- Geofluxus: This initiative tracks waste from its origin to its final destination to promote material reuse and reduce waste volume. Its main objective is to extend material lifespan and provide businesses with tools for better waste management decisions. Geofluxus uses open data from Eurostat and various national open data portals.
- MyBioEuBuddy is a project offering information and visualizations about sustainable agriculture in Europe, using open data from Eurostat and various regional open data portals.
The Role of Open Data in Digital Transformation
In addition to contributing to the fight against climate change by monitoring environment-related processes, open data can yield interesting outcomes in other digitally-operating domains. The combination of open data with innovative technologies provides valuable results, such as natural language processing, artificial intelligence, or augmented reality.
Another online seminar from the series, presented by the European Data Portal, delved into this theme: driving digital transformation in Europe through open data. During the event, three applications that combine cutting-edge technology and open data were presented: Big Data Test Infrastructure, Lobium, and 100 Europeans.
- "Big Data Test Infrastructure (BDTI)": This is a European Commission tool featuring a cloud platform to facilitate the analysis of open data for public sector administrations, offering a free and ready-to-use solution. BDTI provides open-source tools that promote the reuse of public sector data. Any public administration can request the free advisory service by filling out a form. BDTI has already aided some public sector entities in optimizing procurement processes, obtaining mobility information for service redesign, and assisting doctors in extracting knowledge from articles.
- Lobium: A website assisting public affairs managers in addressing the complexities of their tasks. Its aim is to provide tools for campaign management, internal reporting, KPI measurement, and government affairs dashboards. Ultimately, its solution leverages digital tools' advantages to enhance and optimize public management.
- 100 Europeans: An application that simplifies European statistics, dividing the European population into 100 individuals. Through scrolling navigation, it presents data visualizations with figures related to healthy habits and consumption in Europe.
These six applications are examples of how open data can be used to develop solutions of societal interest. Discover more use cases created with open data in this article we have published on datos.gob.es

Learn more about these applications in their seminars -> Recordings here
Blog
Open data is a valuable tool for making informed decisions that encourage the success of a process and enhance its effectiveness. From a sectorial perspective, open data provides relevant information about the legal, educational, or health sectors. All of these, along with many other areas, utilize open sources to measure improvement compliance or develop tools that streamline work for professionals.
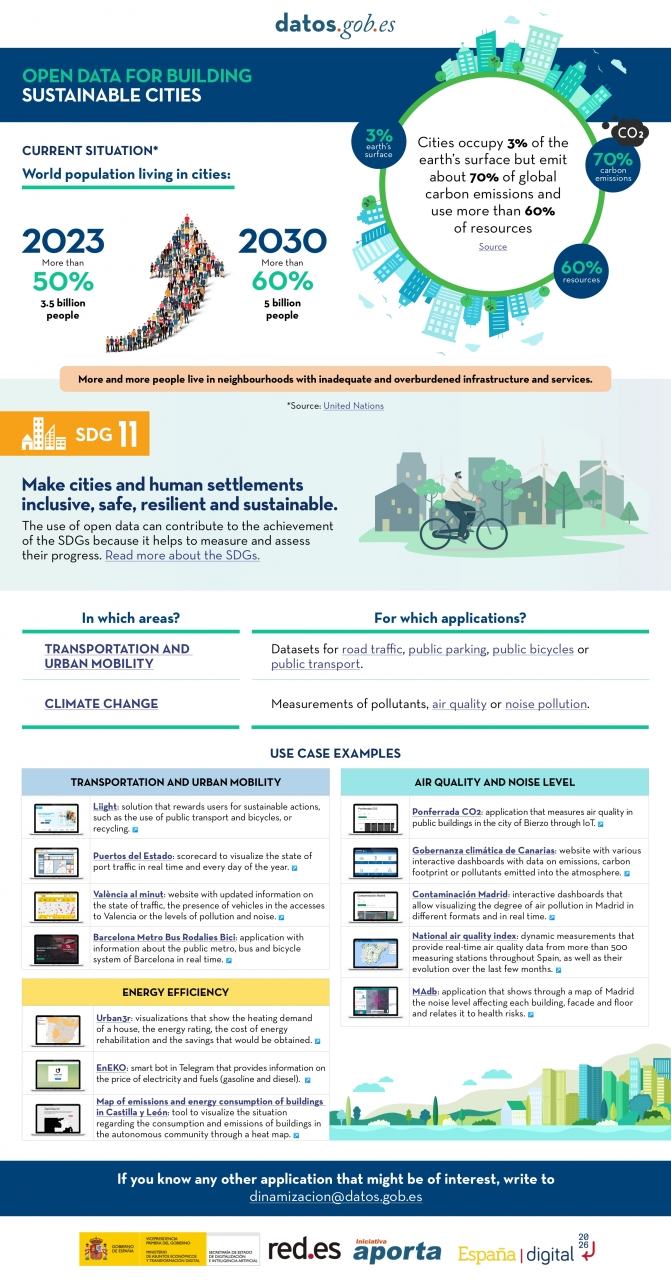
The benefits of using open data are extensive, and their variety goes hand in hand with technological innovation: every day, more opportunities arise to employ open data in the development of innovative solutions. An example of this can be seen in urban development aligned with the sustainability values advocated by the United Nations (UN).
Cities cover only 3% of the Earth's surface; however, they emit 70% of carbon emissions and consume over 60% of the world's resources, according to the UN. In 2023, more than half of the global population lives in cities, and this figure is projected to keep growing. By 2030, it is estimated that over 5 billion people would live in cities, meaning more than 60% of the world's population.
Despite this trend, infrastructures and neighborhoods do not meet the appropriate conditions for sustainable development, and the goal is to "Make cities and human settlements inclusive, safe, resilient, and sustainable," as recognized in Sustainable Development Goal (SDG) number 11. Proper planning and management of urban resources are significant factors in creating and maintaining sustainability-based communities. In this context, open data plays a crucial role in measuring compliance with this SDG and thus achieving the goal of sustainable cities.
In conclusion, open data stands as a fundamental tool for the strengthening and progress of sustainable city development.
In this infographic, we have gathered use cases that utilize sets of open data to monitor and/or enhance energy efficiency, transportation and urban mobility, air quality, and noise levels. Issues that contribute to the proper functioning of urban centers.
Click on the infographic to view it in full size.
Blog
As more of our daily lives take place online, and as the importance and value of personal data increases in our society, standards protecting the universal and fundamental right to privacy, security and privacy - backed by frameworks such as the Universal Declaration of Human Rights or the European Declaration on Digital Rights - become increasingly important.
Today, we are also facing a number of new challenges in relation to our privacy and personal data. According to the latest Lloyd's Register Foundation report, at least three out of four internet users are concerned that their personal information could be stolen or otherwise used without their permission. It is therefore becoming increasingly urgent to ensure that people are in a position to know and control their personal data at all times.
Today, the balance is clearly tilted towards the large platforms that have the resources to collect, trade and make decisions based on our personal data - while individuals can only aspire to gain some control over what happens to their data, usually with a great deal of effort.
This is why initiatives such as MyData Global, a non-profit organisation that has been promoting a human-centred approach to personal data management for several years now and advocating for securing the right of individuals to actively participate in the data economy, are emerging. The aim is to redress the balance and move towards a people-centred view of data to build a more just, sustainable and prosperous digital society, the pillars of which would be:
- Establish relationships of trust and security between individuals and organisations.
- Achieve data empowerment, not only through legal protection, but also through measures to share and distribute the power of data.
- Maximising the collective benefits of personal data, sharing it equitably between organisations, individuals and society.
And in order to bring about the changes necessary to bring about this new, more humane approach to personal data, the following principles have been developed:
1 - People-centred control of data.
It is individuals who must have the power of decision in the management of everything that concerns their personal lives. They must have the practical means to understand and effectively control who has access to their data and how it is used and shared.
Privacy, security and minimal use of data should be standard practice in the design of applications, and the conditions of use of personal data should be fairly negotiated between individuals and organisations.
2 - People as the focal point of integration
The value of personal data grows exponentially with its diversity, while the potential threat to privacy grows at the same time. This apparent contradiction could be resolved if we place people at the centre of any data exchange, always focusing on their own needs above all other motivations.
Any use of personal data must revolve around the individual through deep personalisation of tools and services.
3 - Individual autonomy
In a data-driven society, individuals should not be seen solely as customers or users of services and applications. They should be seen as free and autonomous agents, able to set and pursue their own goals.
Individuals should be able to securely manage their personal data in the way they choose, with the necessary tools, skills and support.
4 - Portability, access and re-use
Enabling individuals to obtain and reuse their personal data for their own purposes and in different services is the key to moving from silos of isolated data to data as reusable resources.
Data portability should not merely be a legal right, but should be combined with practical means for individuals to effectively move data to other services or on their personal devices in a secure and simple way.
5 - Transparency and accountability
Organisations using an individual's data must be transparent about how they use it and for what purpose. At the same time, they must be accountable for their handling of that data, including any security incidents.
User-friendly and secure channels must be created so that individuals can know and control what happens to their data at all times, and thus also be able to challenge decisions based solely on algorithms.
6 - Interoperability
There is a need to minimise friction in the flow of data from the originating sources to the services that use it. This requires incorporating the positive effects of open and interoperable ecosystems, including protocols, applications and infrastructure. This will be achieved through the implementation of common norms and practices and technical standards.
The MyData community has been applying these principles for years in its work to spread a more human-centred vision of data management, processing and use, as it is currently doing for example through its role in the Data Spaces Support Centre, a reference project that is set to define the future responsible use and governance of data in the European Union.
And for those who want to delve deeper into people-centric data use, we will soon have a new edition of the MyData Conference, which this year will focus on showcasing case studies where the collection, processing and analysis of personal data primarily serves the needs and experiences of human beings.
Content prepared by Carlos Iglesias, Open data Researcher and consultant, World Wide Web Foundation.
The contents and views expressed in this publication are the sole responsibility of the author.