Description
Last November, Red.es, in collaboration with the Secretary of State for Digitalisation and Artificial Intelligence launched the 4th edition of the Aporta Challenge. Under the slogan "The value of data for health and well-being of citizens", the competition seeks to identify new services and solutions, based on open data, that drive improvements in this field.
The challenge is divided into two phases: an ideas competition, followed by a second phase where finalists have to develop and present a prototype. We are now at the halfway point of the competition. Phase I has come to an end and it is time to find out who are the 10 finalists who will move on to phase II.
After analysing the diverse and high-quality proposals submitted, the jury has determined a series of finalists, as reflected the resolution published on the Red.es website.
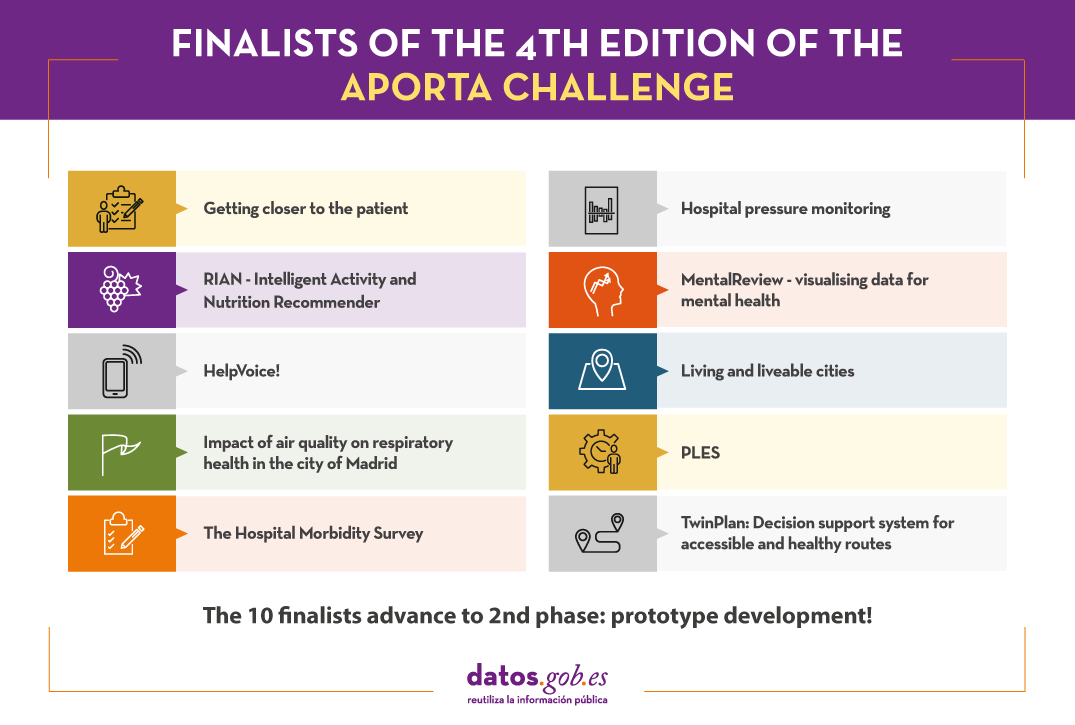
Let us look at each candidacy in detail:
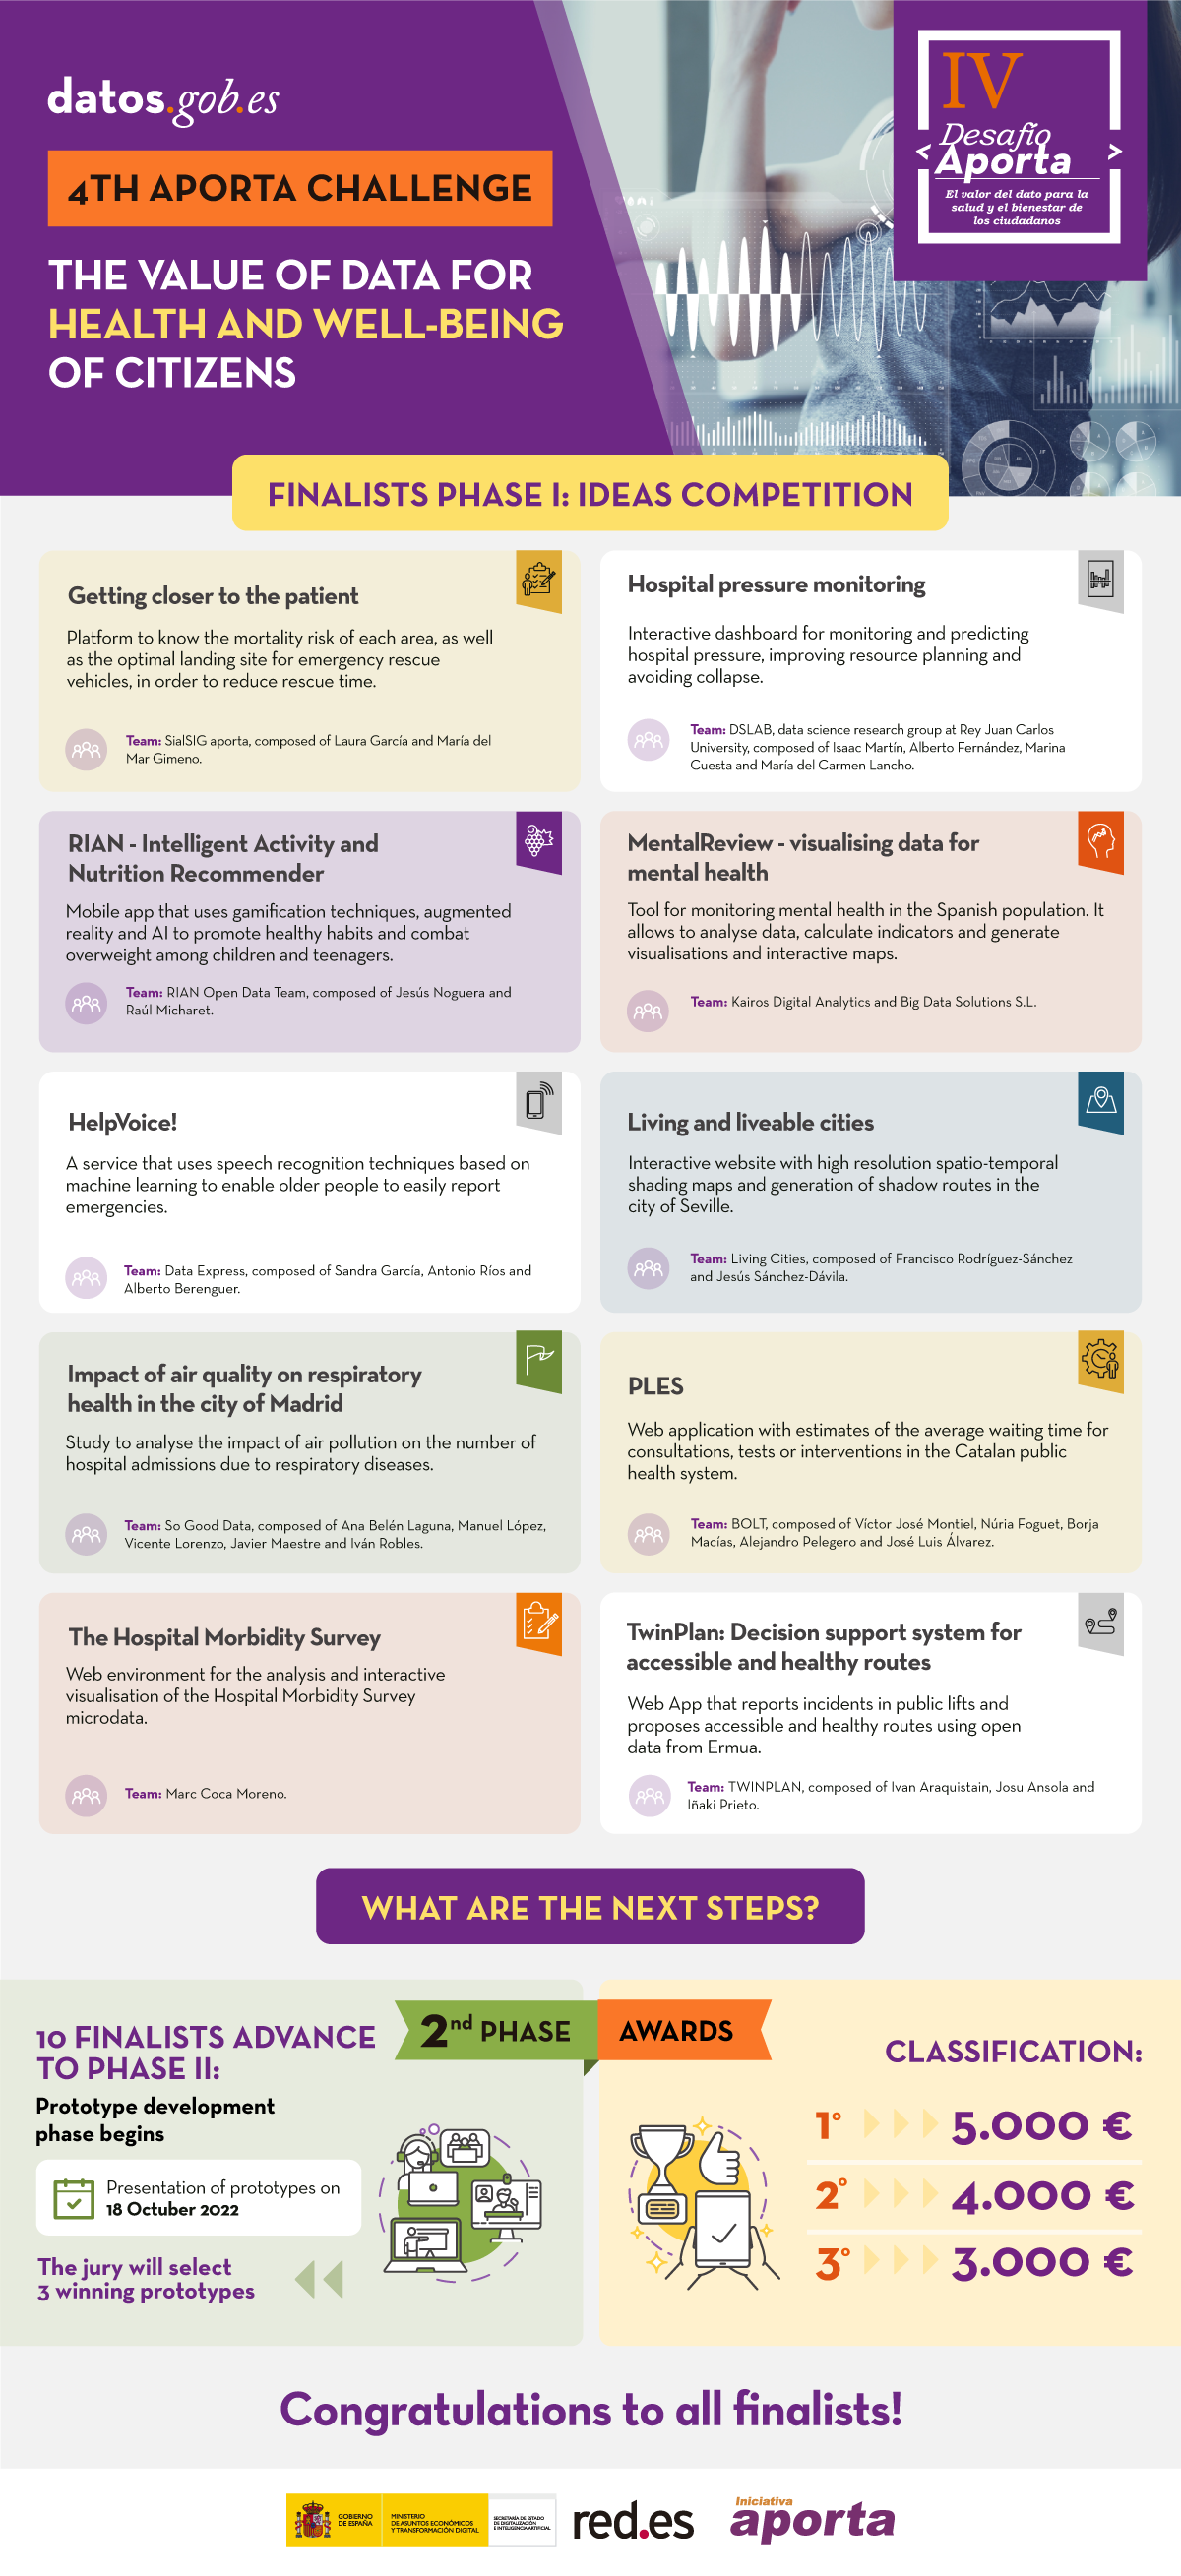
Getting closer to the patient
- Team:
SialSIG aporta, composed of Laura García and María del Mar Gimeno.
- What does it consist of?
A platform will be built to reduce rescue time and optimise medical care in the event of an emergency. Parameters will be analysed to categorise areas by defining the risk of mortality and identifying the best places for aerial rescue vehicles to land. This information will also make available which areas are the most isolated and vulnerable to medical emergencies, information of great value for defining strategies for action that will lead to an improvement in the management and resources to be used.
- Data
The platform seeks to integrate information from all the autonomous communities, including population data (census, age, sex, etc.), hospital and heliport data, land use and crop data, etc. Specifically, data will be obtained from the municipal census of the National Statistics Institute (INE), the boundaries of provinces and municipalities, the land use classification of the National Geographic Institute (IGN) and data from the SIGPAC (MAPA), among others.
Hospital pressure monitoring
- Team:
DSLAB, data science research group at Rey Juan Carlos University, composed of Isaac Martín, Alberto Fernández, Marina Cuesta and María del Carmen Lancho.
- What does it consist of?
With the aim of improving hospital management, the DSLAB proposes an interactive and user-friendly dashboard that allows:
- Monitor hospital pressure
- Evaluate the actual load and saturation of healthcare centres
- Forecast the evolution of this pressure
This will enable better resource planning, anticipate decision making and avoid possible collapses.
- Data
To realise the tool's potential, the prototype will be created with open data relating to COVID in the Autonomous Community of Castilla y León, such as bed occupancy or the epidemiological situation by hospital and province. However, the solution is scalable and can be extrapolated to any other territory with similar data.
RIAN - Intelligent Activity and Nutrition Recommender
- Team:
RIAN Open Data Team, composed of Jesús Noguera y Raúl Micharet.
- What does it consist of?
RIAN was created to promote healthy habits and combat overweight, obesity, sedentary lifestyles and poor nutrition among children and adolescents. It is an application for mobile devices that uses gamification techniques, as well as augmented reality and artificial intelligence algorithms to make recommendations. Users have to solve personalised challenges, individually or collectively, linked to nutritional aspects and physical activities, such as gymkhanas or games in public green spaces.
- Data
The pilot uses data relating to green areas, points of interest, greenways, activities and events from the cities of Málaga, Madrid, Zaragoza and Barcelona. These data are combined with nutritional recommendations (food data and nutritional values and branded food products) and data for food image recognition from Tensorflow or Kaggle, among others.
MentalReview - visualising data for mental health
- Team:
Kairos Digital Analytics and Big Data Solutions S.L.
- What does it consist of?
MentalReview is a mental health monitoring tool to support health and social care management and planning, enabling institutions to improve citizen care services. The tool will allow the analysis of information extracted from open databases, the calculation of indicators and, finally, the visualisation of the information through graphs and an interactive map. This will allow us to know the current state of mental health in the Spanish population, identify trends or make a study of its evolution.
- Data
For its development, data from the INE, the Sociological Research Centre, the Mental Health Services of the different autonomous regions, the Spanish Agency for Medicines and Health Products or EUROSTAT, among others, will be used. Some specific examples of datasets to be used are: anxiety problems in young people, the suicide mortality rate by autonomous community, age, sex and period or the consumption of anxiolytics.
HelpVoice!
- Team:
Data Express, composed of Sandra García, Antonio Ríos and Alberto Berenguer.
- What does it consist of?
HelpVoice! is a service that helps our elderly through voice recognition techniques based on automatic learning. In an emergency situation, the user only need to click on a device that can be an emergency button, a mobile phone or home automation tools and tell about their symptoms. The system will send a report with the transcript and predictions to the nearest hospital, speeding up the response of the healthcare workers. In parallel, HelpVoice! will also recommend to the patient what to do while waiting for the emergency services.
- Data
Among other open data, the map of hospitals in Spain will be used. Speech and sentiment recognition data will also be used in the text.
Living and liveable cities: creating high-resolution shadow maps to help cities adapt to climate change
- Team:
Living Cities, composed of Francisco Rodríguez-Sánchez and Jesús Sánchez-Dávila.
- What does it consist of?
In the current context of rising temperatures, the Living Cities team proposes to develop open software to promote the adaptation of cities to climate change, facilitating the planning of urban shading. Using spatial analysis, remote sensing and modelling techniques, this software will allow to know the level of insolation (or shading) with high spatio-temporal resolution (every hour of the day at every square metre of land) for any municipality in Spain. The team will particularly analyse the shading situation in the city of Seville, offering its results publicly through a web application that will allow consultation of the insolation maps and to obtain shade routes between different points in the city.
- Data
Living Cities is based on the use of open remote sensing data (LiDAR) from the National Aerial Orthophotography Programme (PNOA), the Seville city trees and spatial data from OpenStreetMap.
Impact of air quality on respiratory health in the city of Madrid
- Team:
So Good Data, composed of Ana Belén Laguna, Manuel López, Vicente Lorenzo, Javier Maestre and Iván Robles.
- What does it consist of?
So Good Data is proposing a study to analyse the impact of air pollution on the number of hospital admissions for respiratory diseases. It will also determine which pollutant particles are likely to be most harmful. With this information, it would be possible to predict the number of admissions a hospital will face depending on air pollution on a given date, in order to take the necessary measures in advance and reduce mortality.
- Data
Among other datasets, hospitalisations due to respiratory diseases, air quality, tobacco sales or atmospheric pollen in the Community of Madrid will be used for the study.
PLES
- Team:
BOLT, composed of Víctor José Montiel, Núria Foguet, Borja Macías, Alejandro Pelegero and José Luis Álvarez.
- What does it consist of?
The BOLT team will create a web application that allows the user to obtain an estimate of the average waiting time for consultations, tests or interventions in the public health system of Catalonia. The time series prediction models will be developed using Python with statistical and machine learning techniques. The user only need to indicate the hospital and the type of consultation, operation or test for which he/she is waiting. In addition to improving transparency with patients, the website can also be used by healthcare professionals to better manage their resources.
- Datos
The Project will use data from the public waiting lists in Catalonia published by CatSalut on a monthly basis. Specifically, monthly data on waiting lists for surgery, specialised outpatient consultations and diagnostic tests will be used from at least 2019 to the present. In the future, the idea could be adapted to other Autonomous Communities.
The Hospital Morbidity Survey: Proposal for the development of a MERN+Python web environment for its analysis and graphical visualisation.
- Team:
Marc Coca Moreno
- What does it consist of?
This is a web environment based on MERN, Python and Pentaho tools for the analysis and interactive visualisation of the Hospital Morbidity Survey microdata. The entire project will be developed with open source and free tools. Both the code and the final product will be openly accessible.
Specifically, it offers 3 major analyses with the aim of improving health planning:
o Descriptive: hospital discharge counts and time series.
o KPIs: standardised rates and indicators for comparison and benchmarking of provinces and communities.
o Flows: count and analysis of discharges from a hospital region and patient origin.
All data will be filterable according to dataset variables (age, sex, diagnoses, circumstance of admission and discharge, etc.).
- Data
In addition to the microdata from the INE's Hospital Morbidity Survey, it will also integrate Statistics from the Continuous Register (also from the INE), data from the Ministry of Health's catalogues of ICD10 diagnoses and from the catalogues and indicators of the Agency for Healthcare Research and Quality (AHRQ) and of the Autonomous Communities, such as Catalonia: catalogues and stratification tools.
TWINPLAN: Decision support system for accessible and healthy routes
- Team:
TWINPLAN, composed of Ivan Araquistain, Josu Ansola and Iñaki Prieto
- What does it consist of?
This is a web App to facilitate accessibility for people with mobility problems and promote healthy exercise for all citizens. The tool assesses whether your route is affected by any incidents in public lifts and, if so, proposes an alternative accessible route, also indicating the level of traffic (noise) in the area, air quality and cardioprotection points. It also provides contact details for nearby means of transport.
This web App can also be used by public administrations to monitor the use and planning of new accessible infrastructures.
- Data
The prototype will be developed using data from the Digital Twin of Ermua's public lifts, although the model is scalable to other territories. This data is complemented with other public data from Ermua such as the network of environmental sensors, traffic and LurData, among other sources.
These 10 proposals now have several months to develop their proposals, which will be presented on 18 October. The three prototypes best valued by the jury will receive €5,000, €4,000 and €3,000, respectively.
Good luck to all the finalists!
(You can download the accessible version in word here)
Documentation
| Download the infographic in accessible version (word) | 2.74 MB | DOCX |
|
| Download the infographic in pdf | 808.98 KB | PNG |

|


Comments