4 posts found
Collecting and analysing data to improve humanitarian assistance and restore damage during the Ukrainian war
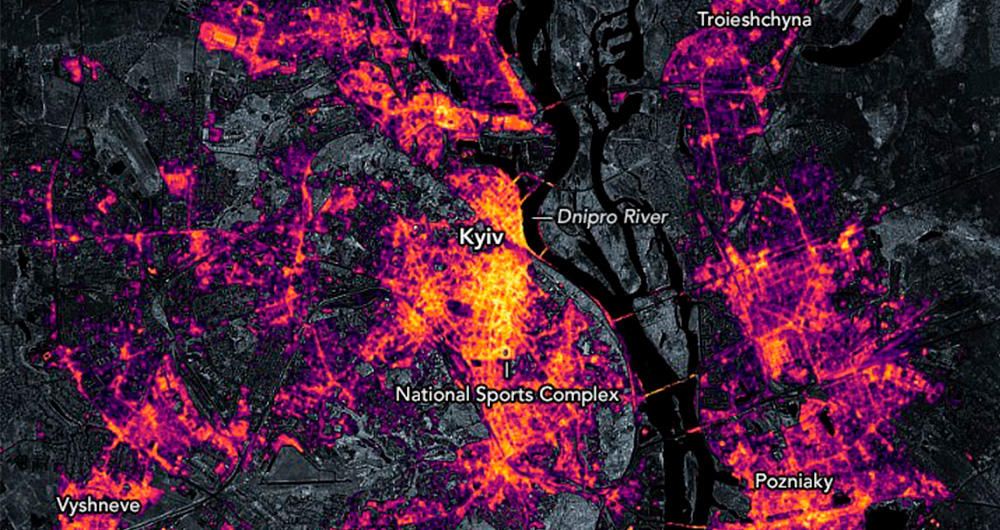
On 24 February Europe entered a scenario that not even the data could have predicted: Russia invaded Ukraine, unleashing the first war on European soil so far in the 21st century.
Almost five months later, on 26 September, the United Nations (UN) published its official figures: 4,889 dead and 6,263…
Different approaches to identifying high-value data
Since the publication of Directive (EU) 2019/1024 on open data and re-use of public sector information, the European Commission is undertaking a number of actions to develop the concept of high-value data that this directive introduced as an important novelty in June 2019.
We recall that high-value…

What is an interactive display? Here is an example
The visual representation of data helps our brain to digest large amounts of information quickly and easily. Interactive visualizations make it easier for non-experts to analyze complex situations represented as data.
As we introduced in our last post on this topic, graphical data visualization is a…

How open data can help in the refugee crisis
According to the United Nations Agency for Refugees (UNHCR), we are currently witnessing the highest levels of displacement of people registered in recent history. In 2019, it is estimated that more than 70 million people have been forced to leave their homes, including 25.9 million legal refugees,…
