6 posts found
High value statistical datasets foreseen in the National Statistical Plan 2021-2024
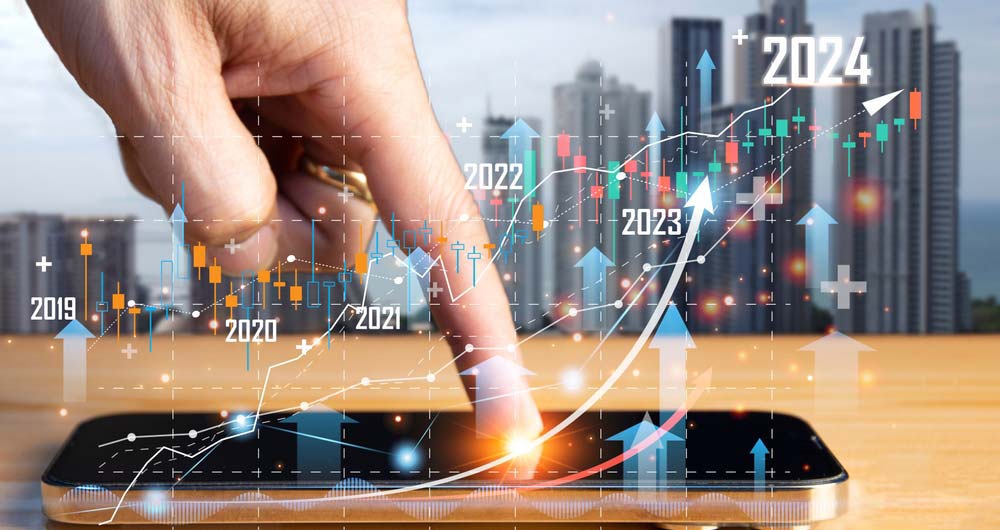
The year 2023 was undoubtedly the year of artificial intelligence. This has brought data, and therefore open data, back to the forefront, as it is the raw material that fuels this technology, which is key to value creation in our increasingly digital economy.
Perhaps that is why 2023 has also l…
Data visualization: the best charts for representing comparisons
Data is a valuable source of knowledge for society. Public commitment to achieving data openness, public-private collaboration on data, and the development of applications with open data are actions that are part of the data economy, which seeks the innovative, ethical, and practical use of data to…

Open data in transport and urban mobility research projects
Open data portals are experiencing a significant growth in the number of datasets being published in the transport and mobility category. For example, the EU's open data portal already has almost 48,000 datasets in the transport category or Spain's own portal datos.gob.es, which has around 2,000 dat…

Laboratories for innovation in data management
Current approaches to public policy-making that respond quickly to changing trends in technology are too often unsuccessful. Policy makers are often pressured to develop and adopt laws or guidelines without the evidence needed to do so safely and without the opportunity to consult affected experts a…

Responsible management of data concerning minors
Young people have consolidated in recent years as the most connected demographic group in the world and are now also the most relevant actors in the new digital economy. One in three internet users across the planet is a child. Furthermore, this trend has been accelerating even more in the current…

What is an interactive display? Here is an example
The visual representation of data helps our brain to digest large amounts of information quickly and easily. Interactive visualizations make it easier for non-experts to analyze complex situations represented as data.
As we introduced in our last post on this topic, graphical data visualization is a…
