3 posts found
Open Data Editor: discover the free and open source tool for processing data
How many times have you had a dataset in your hands that you needed to analyze, but you've run into errors, inconsistencies, or formatting issues that have caused you to lose hours of work? The reality is that, although we have more data available every day, we do not always have the necessary tools…
Benefits and opportunities of public initiatives for open data visualisation
Imagine you want to know how many terraces there are in your neighbourhood, how the pollen levels in the air you breathe every day are evolving or whether recycling in your city is working well. All this information exists in your municipality's databases, but it sits in spreadsheets and technical d…
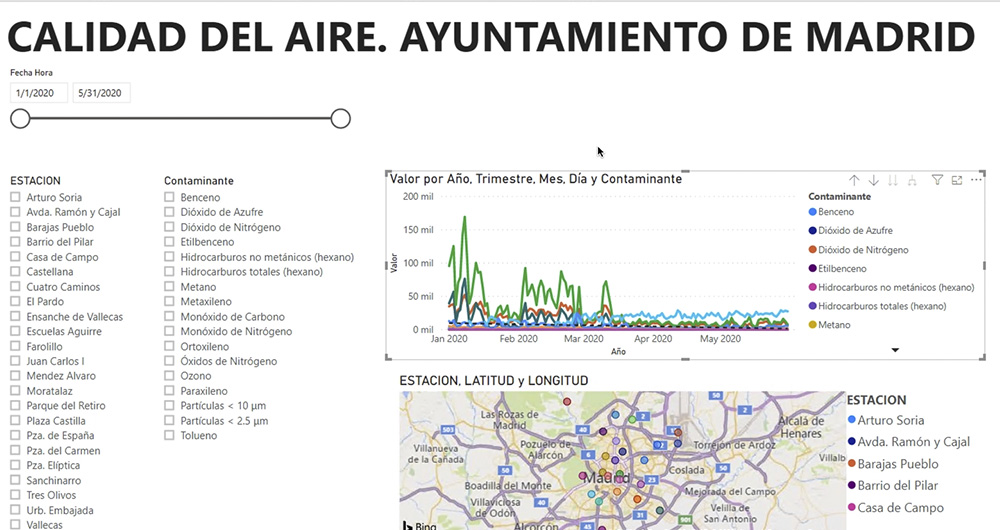
What is an interactive display? Here is an example
The visual representation of data helps our brain to digest large amounts of information quickly and easily. Interactive visualizations make it easier for non-experts to analyze complex situations represented as data.
As we introduced in our last post on this topic, graphical data visualization is a…


