Publication date
12/06/2024
Update date
13/06/2024

Description
What is data profiling?
Data profiling is the set of activities and processes aimed at determining the metadata about a particular dataset. This process, considered as an indispensable technique during exploratory data analysis, includes the application of different statistics with the main objective of determining aspects such as the number of null values, the number of distinct values in a column, the types of data and/or the most frequent patterns of data values. Its ultimate goal is to provide a clear and detailed understanding of the structure, content and quality of the data, which is essential prior to its use in any application.
Types of data profiling
There are different alternatives in terms of the statistical principles to be applied during data profiling, as well as their typology. For this article, a review of various approaches by different authors has been carried out. On this basis, it is decided to focus the article on the typology of data profiling techniques on three high-level categories: single-column profiling, multi-column profiling and dependency profiling. For each category, possible techniques and uses are identified, as discussed below.
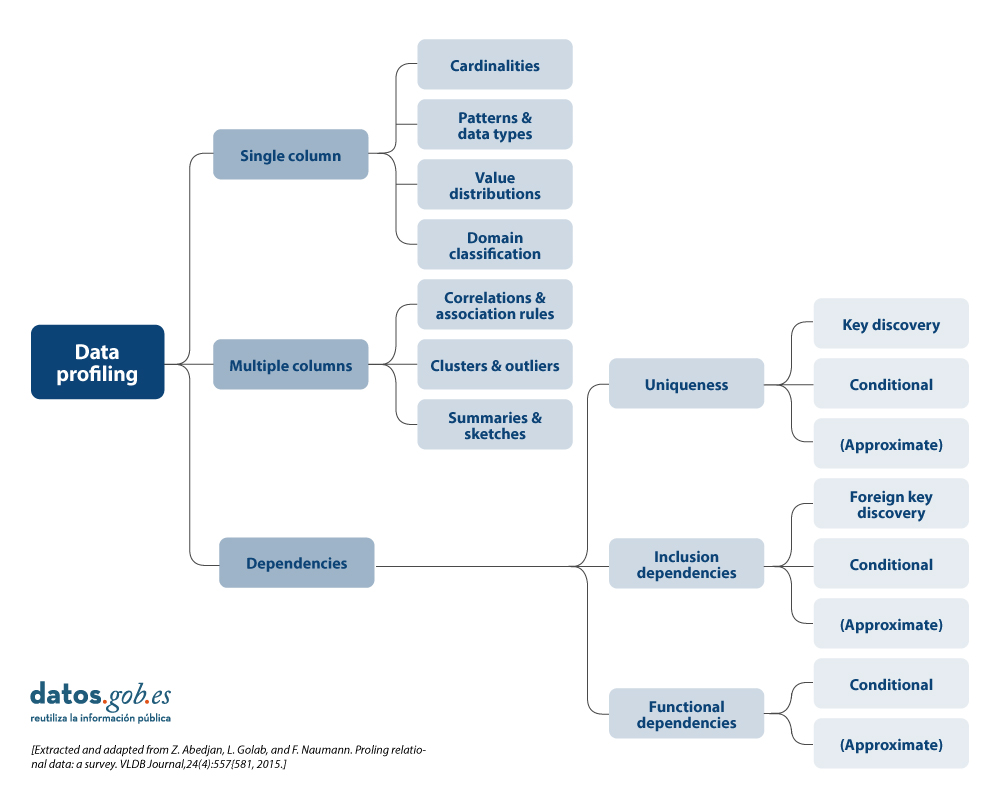
More detail on each of the categories and the benefits they bring is presented below.
1. Profiling of a column
Single-column profiling focuses on analysing each column of a dataset individually. This analysis includes the collection of descriptive statistics such as:
-
Count of distinct values, to determine the exact number of unique records in a list and to be able to sort them. For example, in the case of a dataset containing grants awarded by a public body, this task will allow us to know how many different beneficiaries there are for the beneficiaries column, and whether any of them are repeated.
-
Distribution of values (frequency), which refers to the analysis of the frequency with which different values occur within the same column. This can be represented by histograms that divide the values into intervals and show how many values are in each interval. For example, in an age column, we might find that 20 people are between 25-30 years old, 15 people are between 30-35 years old, and so on.
-
Counting null or missing values, which involves counting the number of null or empty values in each column of a dataset. It helps to determine the completeness of the data and can point to potential quality problems. For example, in a column of email addresses, 5 out of 100 records could be empty, indicating 5% missing data.
- Minimum, maximum and average length of values (for text columns), which is oriented to calculate what is the length of the values in a text column. This is useful for identifying unusual values and for defining length restrictions in databases. For example, in a column of names, we might find that the shortest name is 3 characters, the longest is 20 characters, and the average is 8 characters.
The main benefits of using this data profiling include:
- Anomaly detection: allows the identification of unusual or out-of-range values.
- Improved data preparation: assists in normalising and cleaning data prior to use in more advanced analytics or machine learningmodels.
2. Multi-column profiling
Multi-column profiling analyses the relationship between two or more columns within the same data set. This type of profiling may include:
-
Correlation analysis, used to identify relationships between numerical columns in a data set. A common technique is to calculate pairwise correlations between all numerical columns to discover patterns of relationships. For example, in a table of researchers, we might find that age and number of publications are correlated, indicating that as the age of researchers and their category increases, their number of publications tends to increase. A Pearson correlation coefficient could quantify this relationship.
- Outliers, which involves identifying data that deviate significantly from other data points. Outliers may indicate errors, natural variability or interesting data points that merit further investigation. For example, in a column of budgets for annual R&D projects, a value of one million euros could be an outlier if most of the income is between 30,000 and 100,000 euros. However, if the amount is represented in relation to the duration of the project, it could be a normal value if the 1 million project has 10 times the duration of the 100,000 euro project.
- Frequent value combination detection, focused on finding sets of values that occur together frequently in the data. They are used to discover associations between elements, as in transaction data. For example, in a shopping dataset, we might find that the products "nappies" and "baby formula" are frequently purchased together. An association rule algorithm could generate the rule {breads} → {formula milk}, indicating that customers who buy bread also tend to buy butter with a high probability.
The main benefits of using this data profiling include:
- Trend detection: allows the identification of significant relationships and correlations between columns, which can help in the detection of patterns and trends.
- Improved data consistency: ensures that there is referential integrity and that, for example, similar data type formats are followed between data across multiple columns.
- Dimensionality reduction: allows to reduce the number of columns containing redundant or highly correlated data.
3. Profiling of dependencies
Dependency profiling focuses on discovering and validating logical relationships between different columns, such as:
- Foreign key discovery, which is aimed at establishing which values or combinations of values from one set of columns also appear in the other set of columns, a prerequisite for a foreign key. For example, in the Investigator table, the ProjectID column contains the values [101, 102, 101, 103]. To set ProjectID as a foreign key, we verify that these values are also present in the ProjectID column of the Project table [101, 102, 103]. As all values match, ProjectID in Researcher can be a foreign key referring to ProjectID in Project.
- Functional dependencies, which establishes relationships in which the value of one column depends on the value of another. It is also used for the validation of specific rules that must be complied with (e.g. a discount value must not exceed the total value).
The main benefits of using this data profiling include:
- Improved referential integrity: ensures that relationships between tables are valid and maintained correctly.
- Consistency validation between values: allows to ensure that the data comply with certain constraints or calculations defined by the organisation.
- Data repository optimisation: allows to improve the structure and design of databases by validating and adjusting dependencies.
Uses of data profiling
The above-mentioned statistics can be used in many areas in organisations. One use case would be in data science and data engineering initiatives where it allows for a thorough understanding of the characteristics of a dataset prior to analysis or modelling.
- By generating descriptive statistics, identifying outliers and missing values, uncovering hidden patterns, identifying and correcting problems such as null values, duplicates and inconsistencies, data profiling facilitates data cleaning and data preparation, ensuring data quality and consistency.
- It is also crucial for the early detection of problems, such as duplicates or errors, and for the validation of assumptions in predictive analytics projects.
- It is also essential for the integration of data from multiple sources, ensuring consistency and compatibility.
- In the area of data governance, management and quality, profiling can help establish sound policies and procedures, while in compliance it ensures that data complies with applicable regulations.
- Finally, in terms of management, it helps optimiseExtract, Transform and Load ( ETL) processes, supports data migration between systems and prepares data sets for machine learning and predictive analytics, improving the effectiveness of data-driven models and decisions.
Difference between data profiling and data quality assessment
This term data profiling is sometimes confused with data quality assessment. While data profiling focuses on discovering and understanding the metadata and characteristics of the data, data quality assessment goes one step further and focuses for example on analysing whether the data meets certain requirements or quality standards predefined in the organisation through business rules. Likewise, data quality assessment involves verifying the quality value for different characteristics or dimensions such as those included in the UNE 0081 specification: accuracy, completeness, consistency or timeliness, etc., and ensuring that the data is suitable for its intended use in the organisation: analytics, artificial intelligence, business intelligence, etc.
Data profiling tools or solutions
Finally, there are several outstanding open source solutions (tools, libraries, or dependencies) for data profiling that facilitate the understanding of the data. These include:
- Pandas Profiling and YData Profiling offering detailed reporting and advanced visualisations in Python
- Great Expectations and Dataprep to validate and prepare data, ensuring data integrity throughout the data lifecycle
- R dtables that allows the generation of detailed reports and visualisations for exploratory analysis and data profiling for the R ecosystem.
In summary, data profiling is an important part of exploratory data analysis that provides a detailed understanding of the structure, contents, etc. and is recommended to be taken into account in data analysis initiatives. It is important to dedicate time to this activity, with the necessary resources and tools, in order to have a better understanding of the data being handled and to be aware that it is one more technique to be used as part of data quality management, and that it can be used as a step prior to data quality assessment
Content elaborated by Dr. Fernando Gualo, Professor at UCLM and Data Governance and Quality Consultant The content and the point of view reflected in this publication are the sole responsibility of its author.


Comments