Publication date
29/05/2026
Update date
01/06/2026

Description
Imagine that you have to cross-reference air quality data with municipal register, satellite images and a map of flood zones. Each source arrives in its own reference system, its own grid, its own format, and its own scale. Before you can analyze anything, you spend hours—sometimes weeks—redesigning, aligning, simplifying, and reconciling geometries. It is an invisible job that consumes a good part of the resources of any project with spatial data. Now imagine that all those sources speak the same language from the beginning: that of a global, hierarchical, interoperable cell system that covers the entire Earth. That is, in essence, what a DGGS proposes.
DGGS stands for Discrete Global Grid System. In recent years they have gone from being an academic concept to becoming an operational infrastructure, thanks to the boost of standards such as ISO 19170-1 (2021) and the recent OGC API — DGGS, approved as an official standard in 2025. For those of us who are dedicated to data governance, this is not a technical curiosity: it is a new lever to guarantee interoperability, quality and traceability on geospatial information. In this article, we explain what exactly a DGGS is, why its properties are relevant to the data, and how initiatives like OGC's AI-DGGS pilot are proving its value.
What exactly is a DGGS
The simplest way to imagine a DGGS is to think of a ball covered by a mosaic of cells that fit perfectly together, with no gaps or overlaps. The difference with the latitude-longitude grid we know is in how these cells are constructed: instead of simply cutting the globe into "grids" on the map, a DGGS starts from a regular geometric figure – usually an icosahedron, a polyhedron with 20 triangular faces – that fits on the earth's sphere. Each face is then subdivided into hexagonal, triangular or quadrangular cells, and the result is a homogeneous tessellation that avoids the classic deformation of plane maps.
From this approach derive the four properties that characterise any DGGS according to the standard:
- Global and comprehensive coverage. The cells cover the entire earth's surface. Any point on the planet falls into one and only one cell.
- Approximately equal area. All cells at the same level have equivalent areas, without the distortion of traditional geographic grids (where a cell near the equator can take up several times more surface area than a cell at high latitudes).
- Unique identifiers. Each cell is associated with a unique code (Cell ID) that uniquely identifies it throughout the system. Instead of saying "lat 40.4168, lon -3.7038" to locate the Puerta del Sol, a DGGS would say something like "cell 8a3969a05a07fff".
- Nested hierarchy. Each cell is subdivided into a fixed number of daughter cells (4, 7, or 9, depending on the DGGS) that cover exactly the original cell. That allows you to navigate between levels of resolution without recalculating anything.
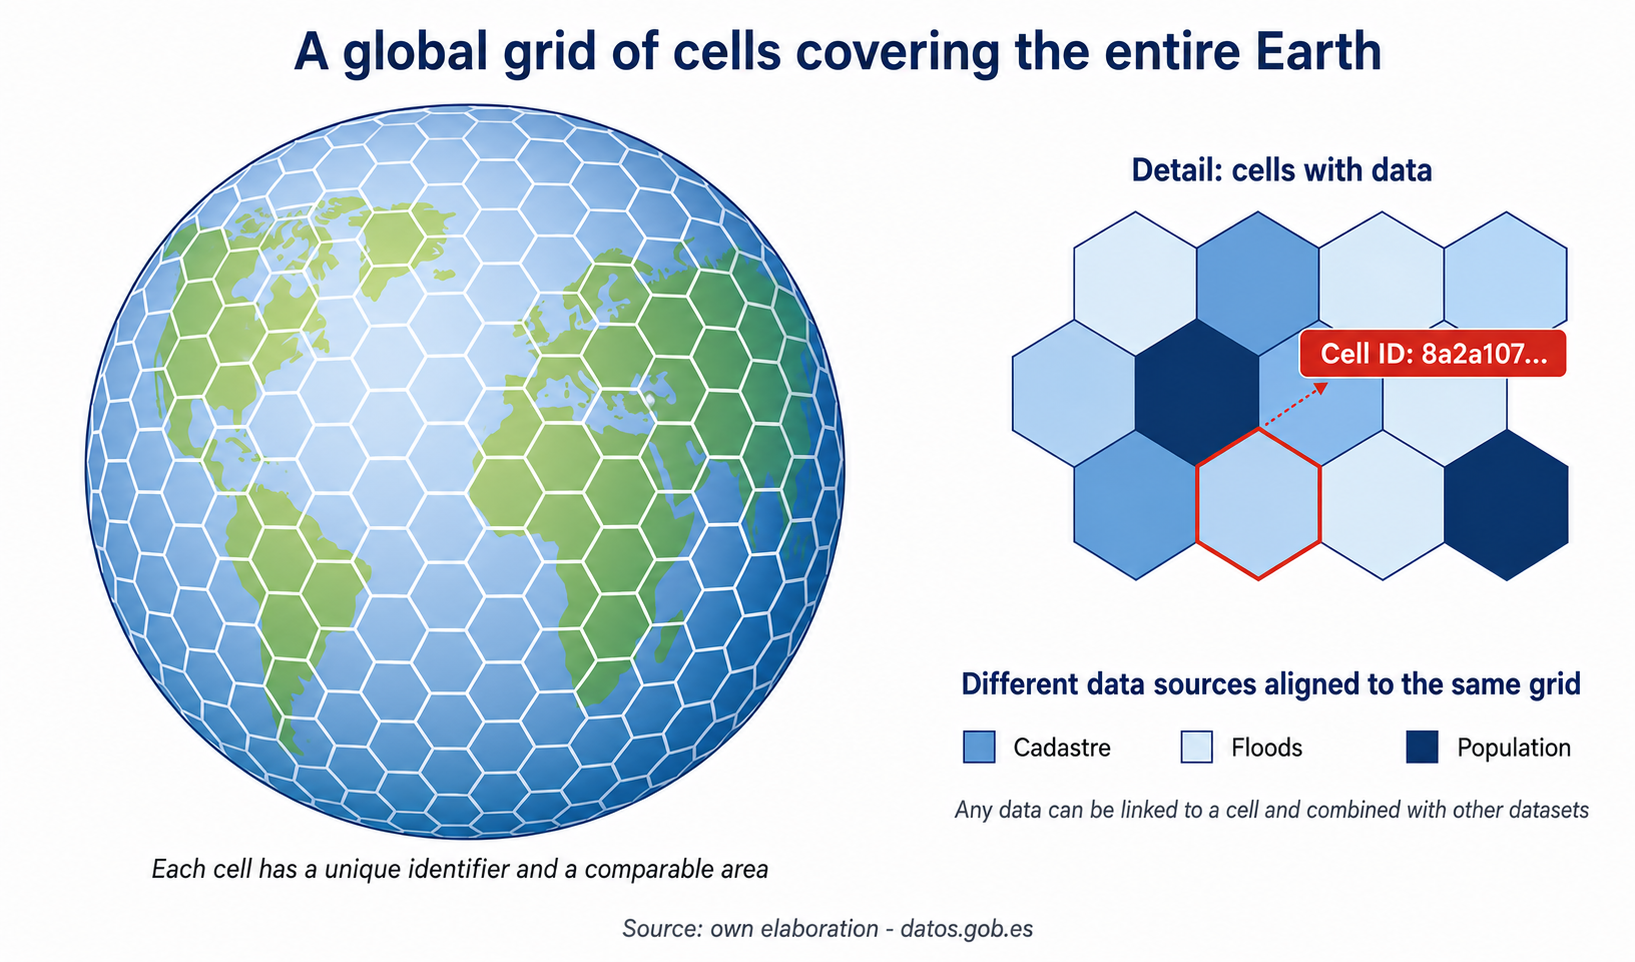
Figure 1. A DGGS grid divides the Earth into comparable cells with their own identifier. Any piece of data – cadastre, floods, population – can be associated with a cell and cross-referenced with the rest. Source: own elaboration · datos.gob.es
The conceptual difference with respect to a classical coordinate system is important. The coordinates are continuous: there is an infinity of pairs (lat, lon) between any two points. A DGGS, on the other hand, is discrete: the set of cells at a given level is finite and enumerable. That makes it especially efficient for storing, indexing, and querying large volumes of data in massive databases and processes. It also simplifies many common operations that are no longer geometric calculations but can be used to become searches on identifiers such as "what is around this point?", "what areas overlap?" or "what added value does this region have?", which become searches and operations on identifiers.
The most well-known implementations are H3 (from Uber, based on hexagons), S2 (from Google, based on squares on a cube), rHEALPix (of astronomical origin) and the DGGAL open library that uses OGC's own AI-DGGS pilot. Each one makes different decisions about cell shape, subdivision factor and projection, but they all share the essential idea of the "hierarchical tesserae of the planet".
Three game-changing properties
From the above properties, three characteristics are derived that have very practical consequences for those who work with geospatial data:
1. Multiscale hierarchy
Each cell has a father on the upper level, a fixed number of daughters on the lower level, and well-defined neighbors on the same level. This pyramidal structure allows you to move up or down in resolution simply by going through the hierarchy, without recalculating any geometry. Adding neighborhoods to obtain a municipal figure, or disaggregating a provincial indicator to the block detail, is to follow the hierarchy up or down.
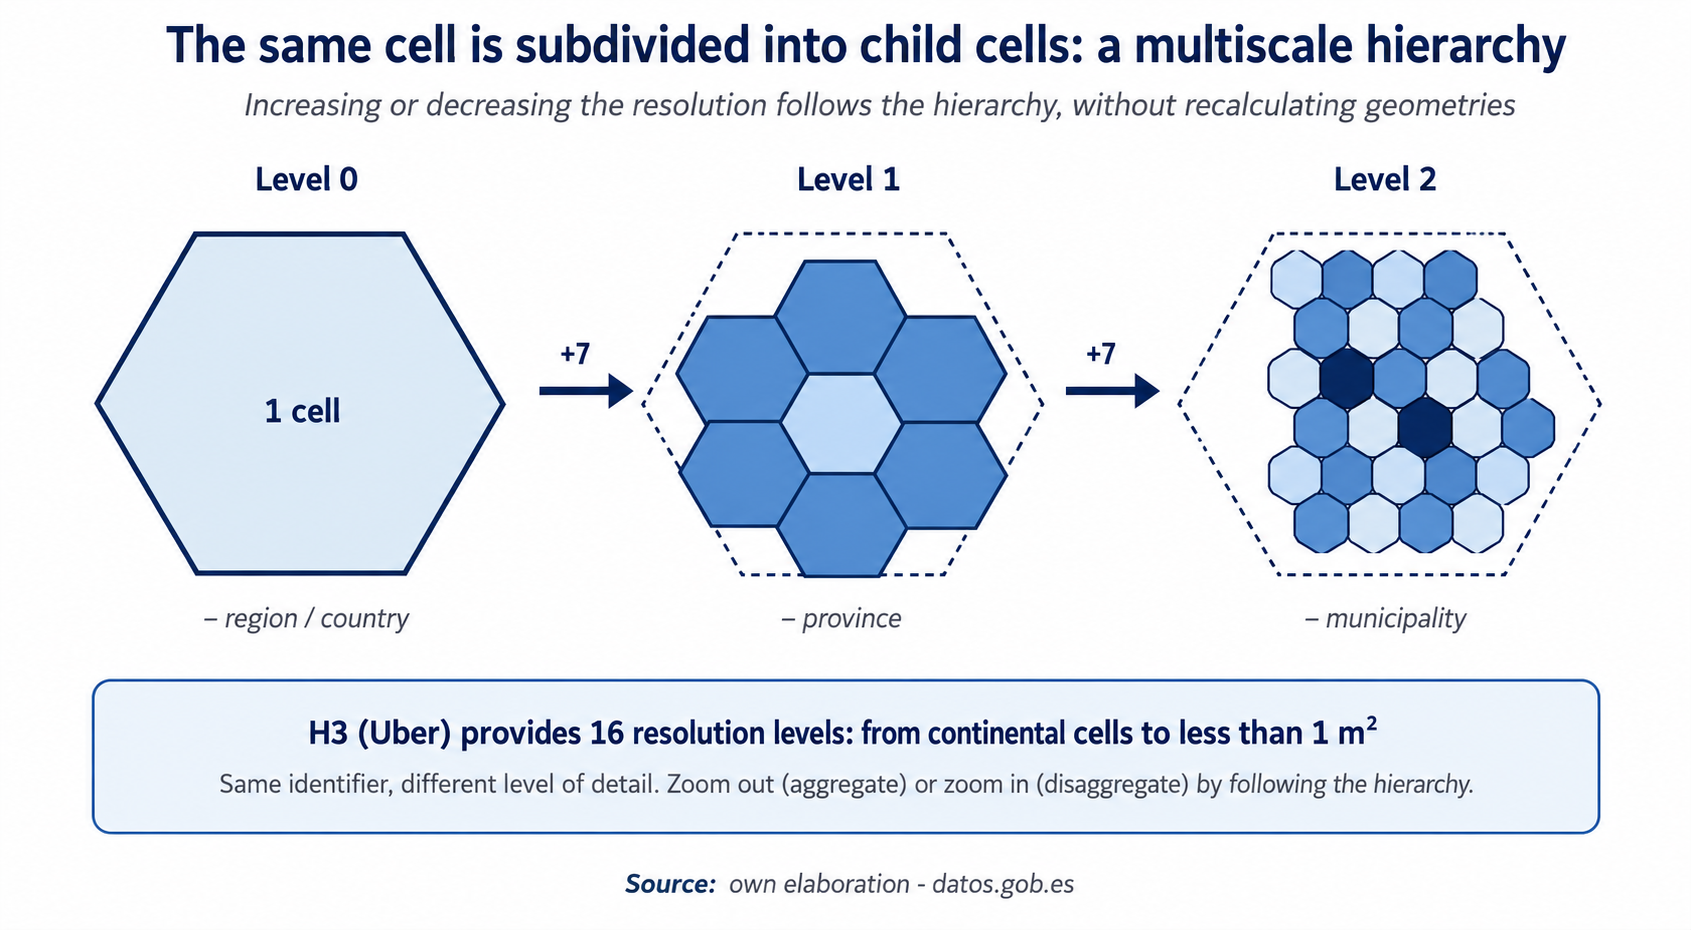
Figure 2. A cell is subdivided into daughter cells, which in turn are subdivided again. Same stable identifier, different level of detail. Source: own elaboration · datos.gob.es
The practical consequence is direct: with a DGGS you can go from cells of several kilometers to cells of less than one square meter simply by changing the level of resolution, while maintaining the same reference system. H3, for example, offers 16 different levels. Most importantly, data is not duplicated: the same dataset can be consumed at the appropriate resolution for each use case—operational, management, or strategic—without maintaining separate replicas.
2. (Approximately) equal area
This property seems technical, but it is decisive. In traditional lat-long grids, a cell at the equator can have several times more surface area than a cell in Scandinavia. When a population density, a concentration of pollutants or a traffic intensity are calculated, this difference in area distorts the results and forces corrections to be applied. With cells of equivalent area, the computations are comparable between regions of the planet without ad hoc adjustments.
3. Identifiers as a reference system
Here is the most powerful idea of the OGC standard, the identifier of each cell works as an address. Let's think about something everyday: when we send a package, we don't write the GPS coordinates of the recipient's door; we type in a zip code and a street. Everyone—the sender, the courier, the mail carrier—understands that address and uses it without the need to do any calculations. Something similar happens with a DGGS: instead of using coordinates to locate things, we use the cell code. And, most importantly, that same code is valid to locate the data, to ask for it and to combine it with data from other sources. If two different organizations say that something is in cell 8a3969a05a07fff, they are talking about the same piece of territory without the possibility of confusion. That saves a lot of the previous work of "putting the data on the same page" before it can be analyzed.
Why does this matter in data governance?
Data governance pursues three main objectives: that data is findable, reliable and reusable. To achieve this, organizations invest in catalogs, quality policies, lineage frameworks, business glossaries, and access control mechanisms. When data has a geospatial dimension, all that gets complicated: each dataset may have been captured in a different projection, with a different detail and under a different update model. DGGS do not solve all of these problems, but they do attack several of the most costly ones.
- Real interoperability between domains. Cadastre, environment, mobility, health, energy and emergencies traditionally work with their own formats, scales and projections. When an organization has to cross-reference, for example, air quality data from a network of sensors with the municipal register and with the public transport network, it dedicates a substantial part of the effort to homogenizing geometries. Encoding the information about the same DGGS turns that crossing into a join on identifiers, which is the most basic and efficient operation that exists in any database.
- Quality and spatial consistency. The classic problems of geographic information—minimal overlaps, imperceptible gaps, invalid geometries, small differences between versions of the same administrative boundary—disappear or are greatly reduced when geometry is fixed to stable, familiar cells. The cell identifier acts as a canonical key: two systems that assign a piece of data to the same cell are talking, unambiguously, about the same piece of territory.
- Lineage and traceability. Knowing how an indicator has been calculated is essential in any data governance process. With a DGGS, the lineage of a spatial data can be expressed in a very compact way: "this indicator was calculated at H3 level 9, on these specific cells, aggregating these sources". That information fits into standard catalog metadata and is trivial to audit over time.
- Multiscale analytics without duplicating data. Administrations usually maintain the same information for several resolutions – one version for the citizen website, another for municipal management, another for the open data catalogue – with the maintenance cost that this implies. With DGGS, the same dataset can be consumed at the appropriate level in each case, adding or disaggregating on the fly.
- Privacy and aggregation by design. Upsizing is a natural mechanism of anonymization by aggregation. In health, mobility or consumption data, adding to a larger cell reduces the risk of re-identification while maintaining analytical utility. And, unlike other approaches, this aggregation is reproducible: any analyst starting from the same cell level will get the same numbers.
- Better fit with modern analytics and AI. Today's data architectures—data lakes, columnar stores, engines like BigQuery or Snowflake—work especially well with short identifiers as partition keys. And, as we'll see later, AI models also benefit from being able to reason about cells rather than complex geometries.
DGGS in practice: who is using them
While DGGS may seem like a recent standard, several organizations have been using these systems in production for years with very concrete results. Some illustrative examples:
- Uber with H3. H3 was born within Uber to solve a very specific problem: calculating dynamic prices and matching supply and demand in each city. The company groups the millions of daily events (trips, requests, driver positions) in hexagonal cells and, on that grid, calculates rates, predicts demand and optimizes dispatches. The library has been open source since 2018 and has become a de facto standard in many industries.
- Foursquare and the "Hex Tiles". Foursquare's location intelligence service stores and serves your data on points of interest, visits, and mobility using Hex Tiles, an H3-based tile system. This allows them to offer data enrichment to their customers – retail chains, advertising platforms, urban planners – with a single key to join datasets that were originally heterogeneous.
- Geoscience Australia and AusPIX. The Australian government has developed AusPIX, an implementation of rHEALPix aimed at referencing statistical, environmental and infrastructure data on a single grid. The initiative is part of its Loc-I (Location Index) strategy and allows linking census information, environmental indicators, and sectoral data as aligned layers on comparable cells – a paradigmatic case of spatial data governance on a national scale.
- Research in digital agriculture. Spanish research teams, such as the Advanced Information Systems Laboratory of the University of Zaragoza, are exploring DGGS as a support infrastructure for the digital transformation of the agricultural sector, where data of very different resolutions coexist: cadastral plots, Sentinel images, sensor measurements and climate models.
- Methane emissions inventories. Recent work proposes DGGS grids as a basis for inventorying methane emissions from the oil and gas sector, where spatial traceability and comparability between regions are critical for international regulation.
The common pattern in all cases is the same: when several heterogeneous data sources have to be combined at scale (continental, national or global) and the cost of keeping everything "in its own format" becomes prohibitive, DGGS appears as the piece that simplifies integration.
OGC's AI-DGGS pilot: when AI needs a "spatial brain"
One of the most illustrative developments to understand the practical scope of DGGS is the OGC AI-DGGS for Disaster Management Pilot, developed between 2025 and 2026 with the sponsorship of Natural Resources Canada and the US USGS, among others. The pilot focused on flood management in the Red River basin in Manitoba, Canada, a high-risk corridor between Winnipeg and the U.S. border.
The starting question was not trivial: in an emergency, those responsible have too much data, but too little actionable information. Satellite images, hydraulic models, layers of critical infrastructures and population censuses speak different formats. Is it possible for a user to ask questions in natural language—such as "which roads in Winnipeg can be cut off?" — and get traceable and accurate answers?
The pilot's approach is based on two pieces. The first is a digital fabric built on DGGS: different servers publish their data – hydrology, flood models, buildings, road networks – aligned on the same global grid, accessible via the OGC API – DGGS. The second is an AI layer with RAG (Retrieval-Augmented Generation) architecture: the language model builds the response by retrieving authoritative content from the DGGS itself.
The key is that the AI does not calculate "where the water is": it simply looks for the Cell IDs labeled as flooded and crosses them with the Cell IDs of roads or population. Spatial reasoning is reduced to operations on identifiers, which makes answers faster, more explainable and, above all, more auditable.
The result documented by OGC was a demonstration with four independent AI clients and six DGGS servers operating as a single interoperable engine. Beyond the specific case of floods, what is relevant for data governance is the pattern: DGGS provide AI systems with a stable, multiscale and traceable representation of the territory, which is precisely what avoids the so-called "spatial hallucinations" and allows us to explain where each response comes from. All the driver's documentation, protocols and demonstrators are still available on its official website.
However, DGGS is not a substitute for traditional coordinates or GIS. They live with them and, in many cases, they are built on top of them. What they bring is a common axis on which to support integration, especially as the volume of data grows and use cases diversify.
For a data governance office, the interesting conversation is not "do we migrate everything to DGGS?", but rather: in which domains of our organization does it make sense to start using DGGS identifiers as an integration key? What catalogues, indicators or derivative products would gain in consistency if they were also published referenced on a grid? What quality and lineage policies do we want to apply on this common grid?
The good news is that the ecosystem is maturing fast: the abstract standard is consolidated, there is an official API, there are open implementations—H3, S2, DGGAL, rHEALPix—and pilots like AI-DGGS demonstrate that the piece fits with modern data and AI architectures. The conversation has simply begun, and it is up to data governance offices to lead it in their organizations.
Find out more
Standards and Specifications
- OGC Abstract Specification Topic 21 — Discrete Global Grid Systems: https://docs.ogc.org/as/20-040r3/20-040r3.html
- ISO 19170-1:2021 — Geographic information — Discrete Global Grid Systems: https://www.iso.org/standard/82327.html
- OGC API — Discrete Global Grid Systems — Part 1: Core (2025): https://docs.ogc.org/is/21-038r1/21-038r1.html
OGC AI-DGGS Pilot
- OGC Pilot Page: https://www.ogc.org/initiatives/ai-dggs-pilot/
- Technical results and demonstrators: https://aidggs-pilot.hartis.org/
Reference Implementations
- H3 (Uber, hexagonal): https://h3geo.org/
- S2 (Google, cuadrangular): https://s2geometry.io/
- AusPIX (Geoscience Australia, rHEALPix): https://github.com/GeoscienceAustralia/AusPIX_DGGS
Content prepared by Mayte Toscano, Senior Consultant in Data Economy Technologies. The content and views expressed in this publication are the sole responsibility of the author.


Comments