12 documents found
Technical Guide: Implementing SHACL
The adoption of the new DCAT-AP-ES profile aligns Spain with the application profile in Europe (DCAT-AP), facilitating automatic federation between data catalogs defined in RDF (Resource Description Framework).
In this RDF graph environment where flexibility is the norm, the absence of traditional…
- Guides

New Trends and Challenges in the World of Data
The digital ecosystem around data has evolved rapidly in recent years. While the debate once focused mainly on volume and speed, today we face a far more complex landscape in which generative artificial intelligence, governance, ethics, and interoperability have become central priorities.
This…
- Guides

Public sector data reuser´s decalogue
The "Public Sector Data Re-User´s Decalogue" (2025 edition), offers an updated guide to facilitate the access, reuse and enhancement of public sector information in the current context marked by the data economy, artificial intelligence and new European regulatory frameworks. It maintains its…
- Guides

Technical guide: Data version control
Data possesses a fluid and complex nature: it changes, grows, and evolves constantly, displaying a volatility that profoundly differentiates it from source code. To respond to the challenge of reliably managing this evolution, we have developed the new 'Technical Guide: Data Version Control'.
This…
- Guides
Data Scientist's Decalogue
Data science has become a pillar of evidence-based decision-making in the public and private sectors. In this context, there is a need for a practical and universal guide that transcends technological fads and provides solid and applicable principles. This guide offers a decalogue of good practices…
- Guides

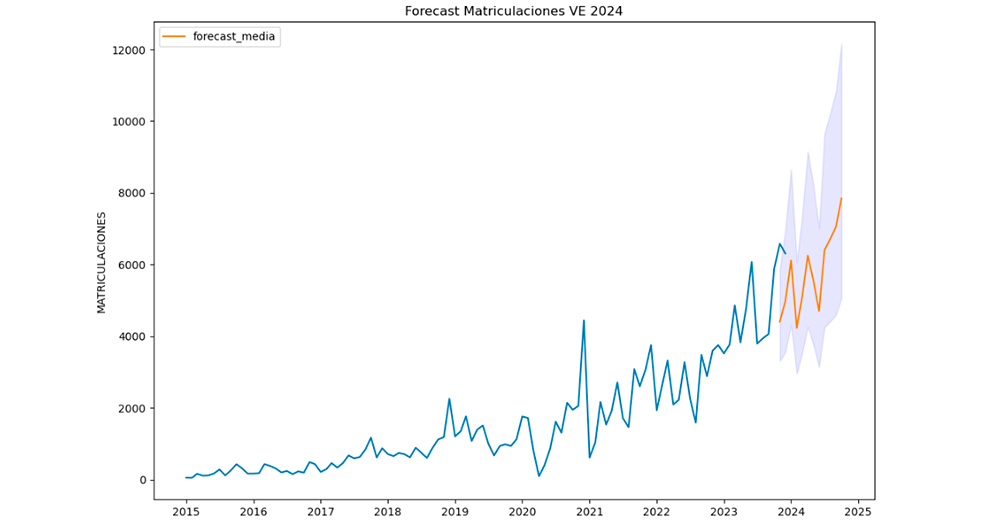
Road to electrification: Deciphering electric vehicle growth in Spain through data analytics
1. Introduction
Visualisations are graphical representations of data that allow to communicate, in a simple and effective way, the information linked to the data. The visualisation possibilities are very wide ranging, from basic representations such as line graphs, bar charts or relevant metrics,…
- Data exercises
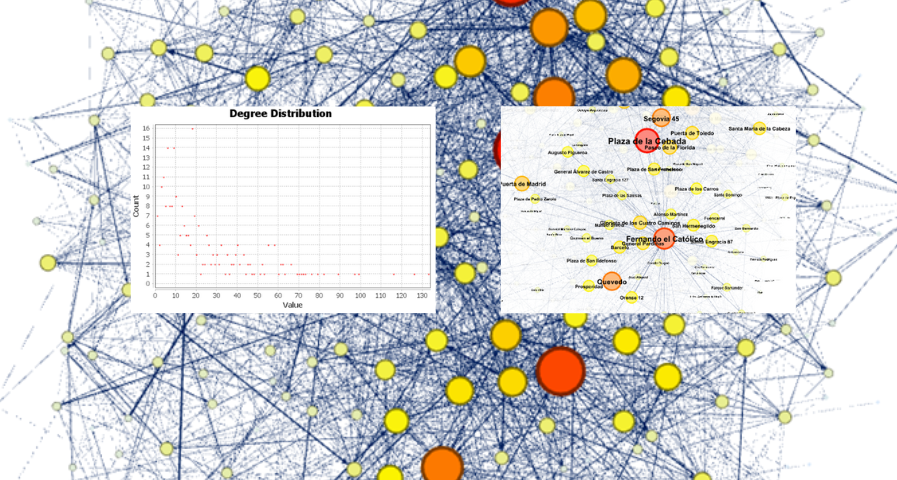
Analysis of travel networks in BICIMAD
1. Introduction
Visualizations are graphical representations of data that allow the information linked to them to be communicated in a simple and effective way. The visualization possibilities are very wide, from basic representations, such as line, bar or sector graphs, to visualizations…
- Data exercises
Analysis of toxicological findings in road traffic accidents
1. Introduction
Visualizations are graphical representations of data that allows comunication in a simple and effective way the information linked to it. The visualization possibilities are very wide, from basic representations, such as a graph of lines, bars or sectors, to visualizations…
- Data exercises

Share-PSI 2.0: Las mejores prácticas para compartir información del sector público
Iniciativa Aporta – Datos.gob.es ha actualizado y enriquecido las 56 mejores prácticas para compartir información del sector público que fueron recopiladas por la red temática Share-PSI 2.0. El repositorio de Share-PSI 2.0. concebido para servir de orientación a todas las organizaciones públicas a…
- Guías

Estudios de Caracterización del Sector Infomediario 2014
En el marco del Proyecto Aporta se ha lanzado la tercera edición del Estudio de Caracterización del Sector Infomediario el cual identifica y clasifica la actividad empresarial basada en productos y/o servicios que reutilizaban la información del sector público en España; teniendo en cuenta tanto a…
- Informes y estudios