4 documents found
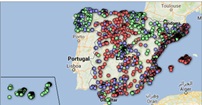
Design and visualize road accident rates using D3.js
Introduction
Every year there are tens of thousands of accidents in Spain, in which thousands of people are injured of varying degrees, and which occur in very different circumstances, both in terms of the type of road and the type of accident.
Many of the statistics related to these parameters are…
- Data exercises

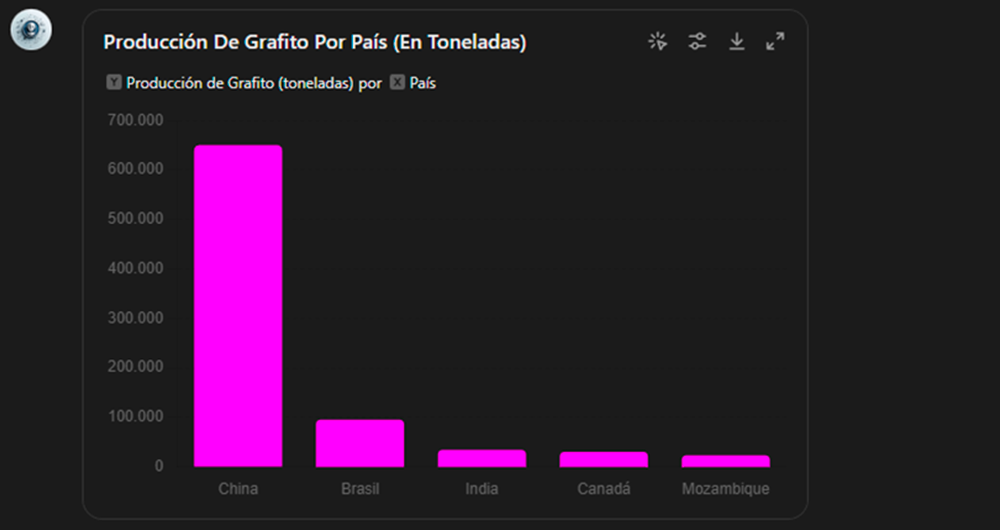
How to Create an Expert Assistant with Open Data: Building GPT to Answer the Critical Minerals Challenge
1. Introduction
In the information age, artificial intelligence has proven to be an invaluable tool for a variety of applications. One of the most incredible manifestations of this technology is GPT (Generative Pre-trained Transformer), developed by OpenAI. GPT is a natural language model…
- Data exercises
Data processing and visualization tools
Visualization is critical for data analysis. It provides a first line of attack, revealing intricate structures in data that cannot be absorbed otherwise. We discover unimaginable effects and question those that have been imagined."
William S. Cleveland (de Visualizing Data, Hobart Press)
Over the…
- Reports and studies
Data visualization: definition, technologies and tools
There is increasingly more information, to such extent that the current society lives surrounded by data. Nevertheless, one of the most common criticisms of this mass of information is its lack of usability. It is not only a matter of publishing data on the web, but we should focus on their …
- Reports and studies