70 documents found
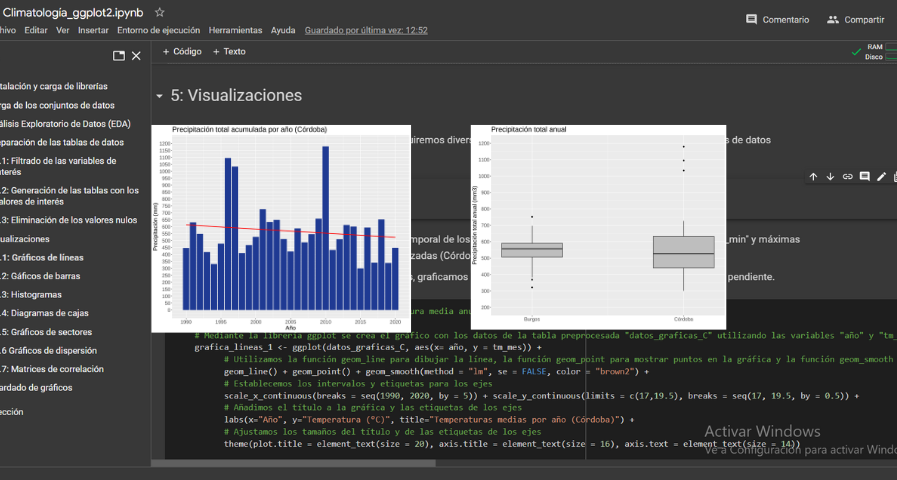
Analysis of meteorological data using the "ggplot2" library
1. Introduction
Visualizations are graphical representations of data that allow the information linked to them to be communicated in a simple and effective way. The visualization possibilities are very wide, from basic representations, such as a line chart, bars or sectors, to visualizations…
- Data exercises
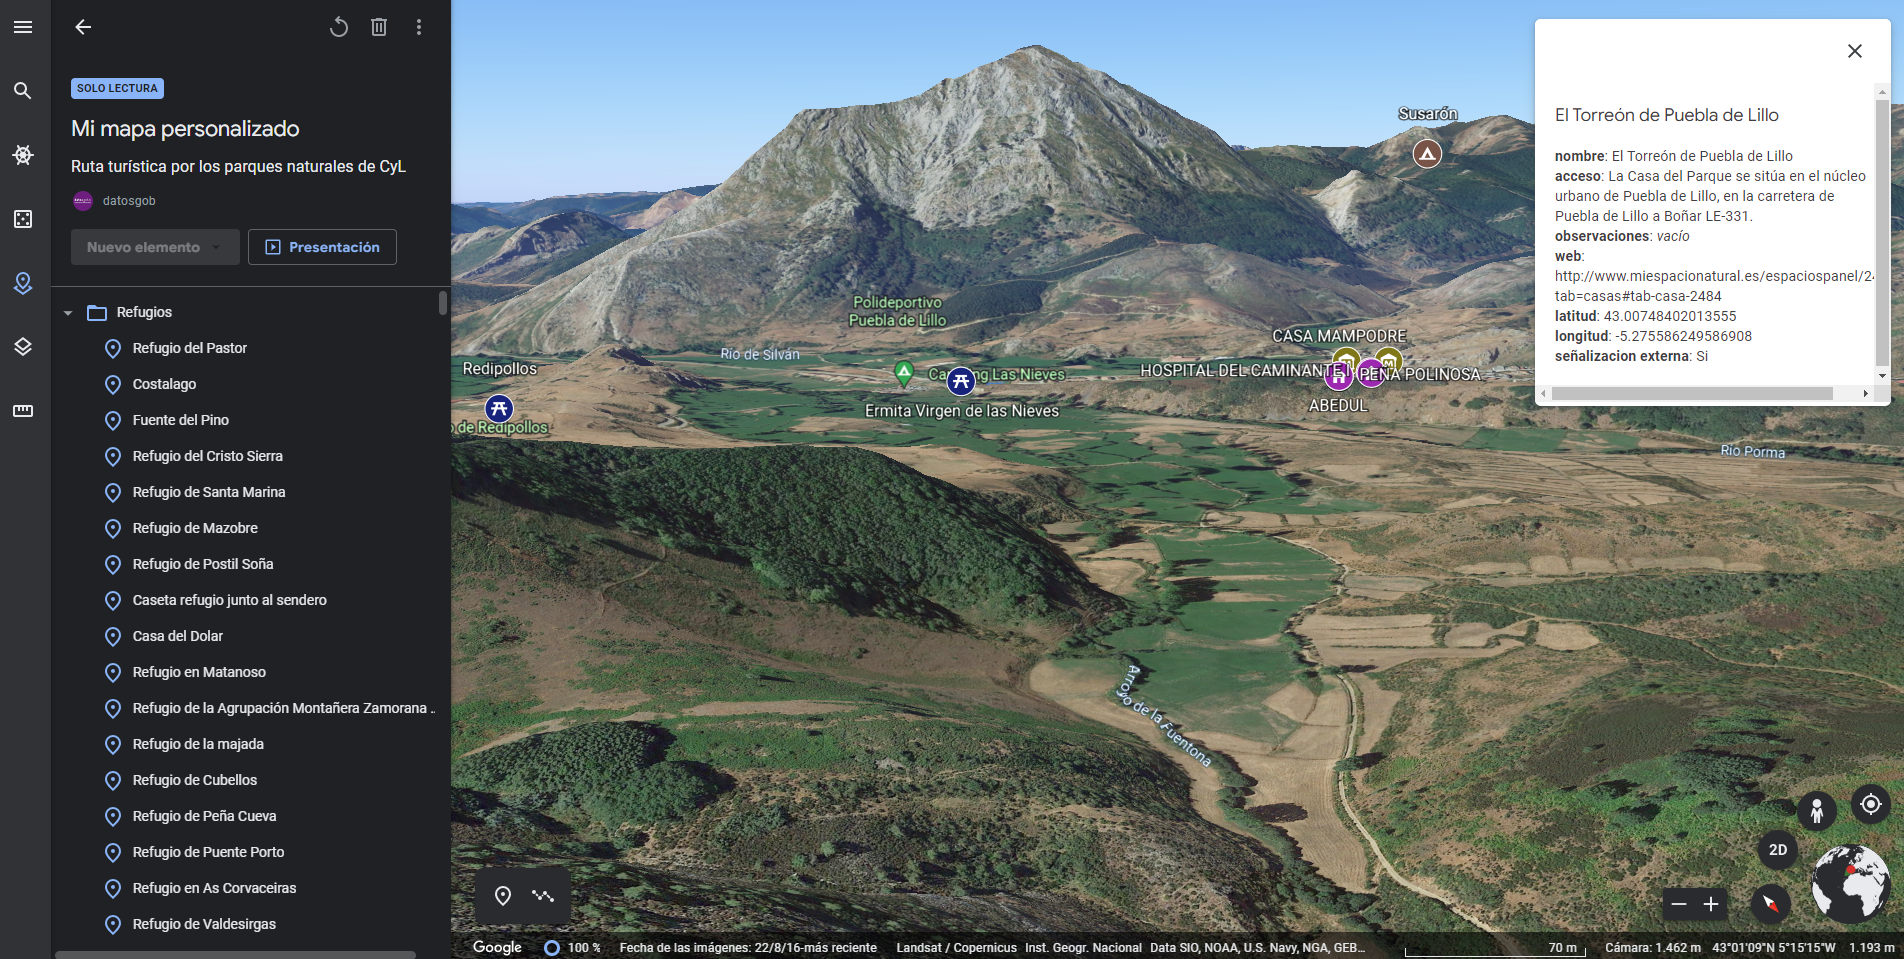
Generating personalized tourist map with "Google My Maps"
1. Introduction
Visualizations are graphical representations of the data allowing to transmit in a simple and effective way related information. The visualization capabilities are extensive, from basic representations, such as a line chart, bars or sectors, to visualizations configured on control…
- Data exercises
Tendencias geoespaciales 2022: Oportunidades para data.europa.eu a partir de las tendencias emergentes en la comunidad geoespacial
Este informe recoge varias temáticas relevantes para la comunidad europea de datos geoespaciales.
Por un lado, el capítulo dedicado a la "modernización INSPIRE y avance hacia los datos abiertos" trata la evaluación realizada por la Comisión Europea de la directiva INSPIRE y cómo ésta debe avanzar…
- Informes y estudios
Analysis of toxicological findings in road traffic accidents
1. Introduction
Visualizations are graphical representations of data that allows comunication in a simple and effective way the information linked to it. The visualization possibilities are very wide, from basic representations, such as a graph of lines, bars or sectors, to visualizations…
- Data exercises

Emerging technologies and open data: introduction to data science applied to image analysis
We present a new report in the series 'Emerging Technologies and Open Data', by Alejandro Alija. The aim of these reports is to help the reader understand how various technologies work, what is the role of open data in them and what impact they will have on our society. This series includes…
- Reports and studies

Observatorio de casos de uso: seguimiento de 3 años de 30 casos de reutilización para comprender el impacto económico, gubernamental, social y medioambiental de los datos abiertos (Volumen I)
Medir el impacto de los datos abiertos es uno de los retos que tienen por delante las iniciativas de datos abiertos. En este contexto, el Portal de Datos Europeo ha puesto en marcha un observatorio de casos de uso que constará de diversos informes.
En el primer informe se presenta la…
- Informes y estudios
Data.europa.eu and citizen-generated data
This report published by the European Data Portal explores the so-called Citizen Generated Data (CGD). This category of data refers to those generated by citizens. There is a lack of this type of data within European open data portals, mainly due to the lack of publication and management of CGDs by…
- Reports and studies
Analysis of the state and evolution of the national water reservoirs
1. Introduction
Visualizations are graphical representations of data that allow the information linked to them to be communicated in a simple and effective way. The visualization possibilities are very broad, from basic representations such as line, bar or pie chart, to visualizations configured on…
- Data exercises

Copernicus data for the open data community
This report published by the European Data Portal (EDP) aims to help open data users in harnessing the potential of the data generated by the Copernicus program.
The Copernicus project generates high-value satellite data, generating a large amount of Earth observation data, this is in line…
- Reports and studies
Measuring data demand in the public sector
This report published by the European Data Portal (EDP) covers the following topics.
What are the needs of open data re-users of public sector institutions in Europe? This question is key to facilitate the publication of open data and support for re-users of EU institutions and Member…
- Reports and studies