70 documents found
High-Value Data Sets: Understanding the Data Providers' Perspective
This report published by the European Data Portal (EDP) covers the following topics.
Making data available as open data in all EU Member States is vital to harnessing its potential for European society and economy. In order to increase impact effectively, efforts must target the datasets that…
- Reports and studies
Data.europa.eu and European Data Pools: a report on challenges and opportunities
This report published by the European Data Portal (EDP) explores existing and emerging developments and initiatives around data sharing using data spaces.
The objective is twofold: to identify the owners of open data involved in the implementation of data spaces and to reflect on the role…
- Reports and studies
Principles and recommendations to make data.europa.eu data more reusable
This report published by the European Data Portal (EDP) aims to advance the debate on the medium and long-term sustainability of open data portal infrastructures.
It provides recommendations to open data publishers and data publishers on how to make open data available and how to promote its…
- Reports and studies
How to facilitate data collaboration to solve societal problems
Data are fundamental to solving the social and economic challenges we face today. It allows us to understand the causes behind a given situation and the factors that influence it, to estimate how it is evolving and to make informed decisions for change.
The problem is that solving such challenges…
- Reports and studies

Characteristics of the Spanish University students and most demanded degrees
1. Introduction
Visualizations are graphical representations of data that allow to transmit in a simple and effective way the information linked to them. The visualization potential is very wide, from basic representations, such as a graph of lines, bars or sectors, to visualizations configured on…
- Data exercises

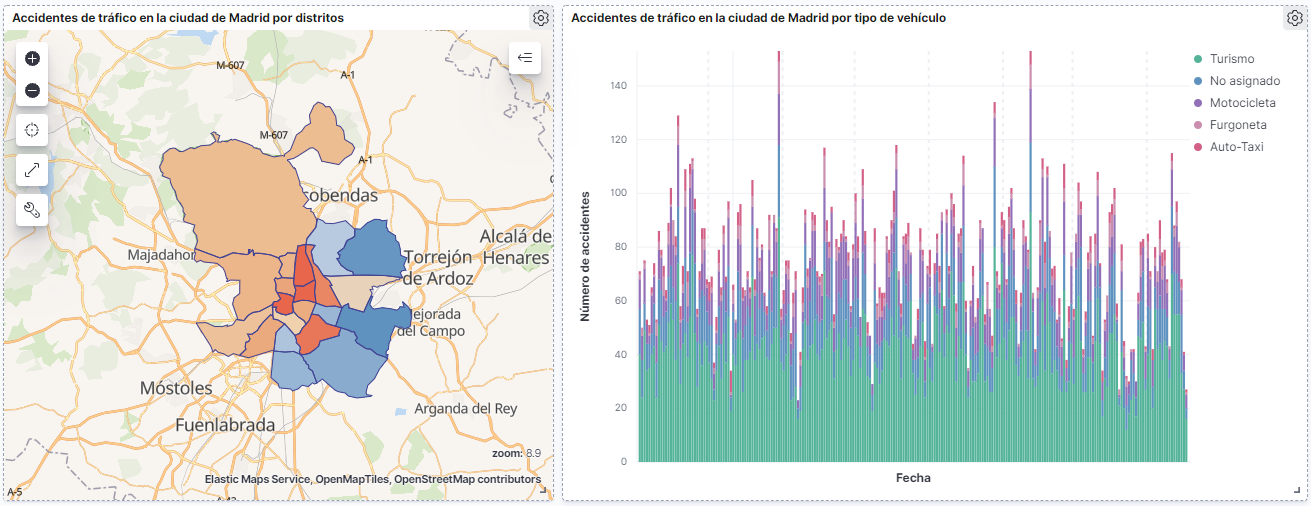
How many accidents occur in the city of Madrid?
1. Introduction
Data visualization is a task linked to data analysis that aims to graphically represent underlying data information. Visualizations play a fundamental role in the communication function that data possess, since they allow to drawn conclusions in a visual and understandable way,…
- Data exercises
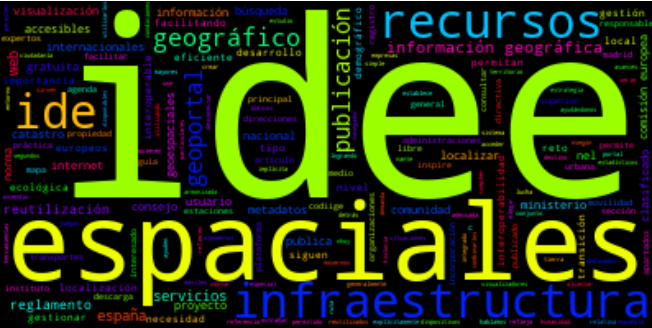
Creating word clouds from the text data with NLP techniques
1. Introduction
Visualizations are a graphic representation that allow us to comprehend in a simple way the information that the data contains. Thanks to visual elements, such as graphs, maps or word clouds, visualizations also help to explain trends, patterns, or outliers that data may present.…
- Data exercises
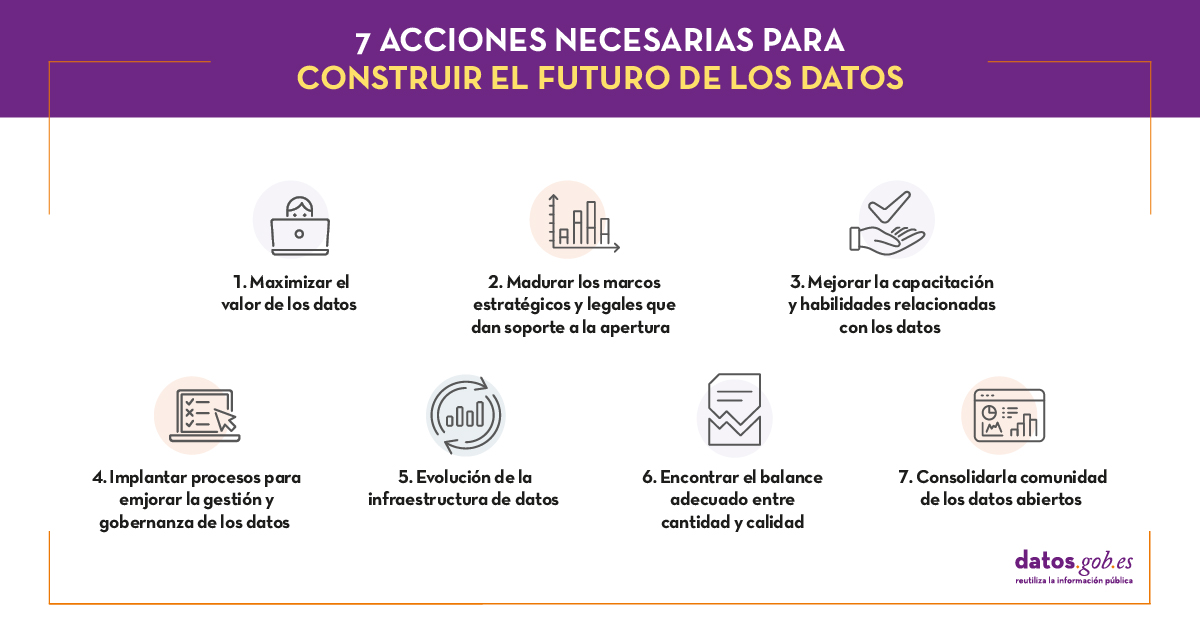
The future of open data
"Information and data are more valuable when they are shared and the opening of government data could allow [...] to examine and use public information in a more transparent, collaborative, efficient and productive way". This was, in general terms, the idea that revolutionized more than ten years…
- Reports and studies
Characterization of the employment demand and registered contracting in Spain
1. Introduction
Data visualization is a task linked to data analysis that aims to represent graphically the underlying information. Visualizations play a fundamental role in data communication, since they allow to draw conclusions in a visual and understandable way, also allowing detection of…
- Data exercises

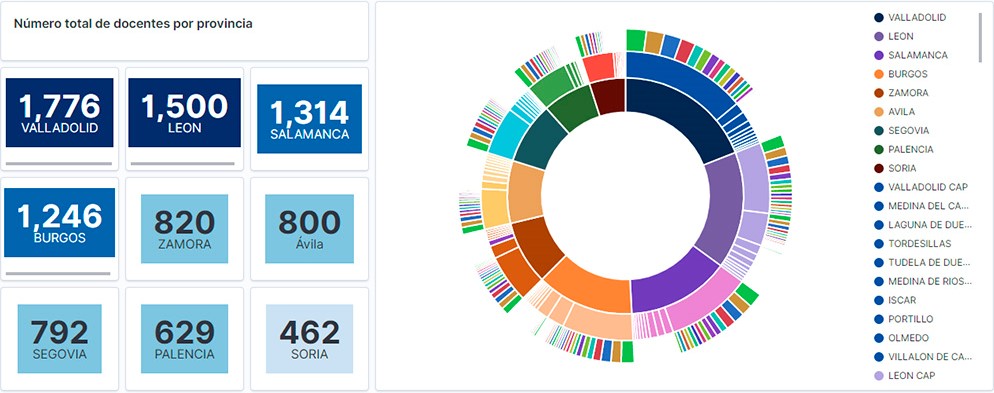
Teachers of public schools in Castilla y León
1. Introduction
Data visualization is a task linked to data analysis that aims to graphically represent underlying data information. Visualizations play a fundamental role in the communication function that data possess, since they allow to drawn conclusions in a visual and understandable way,…
- Data exercises