70 documents found
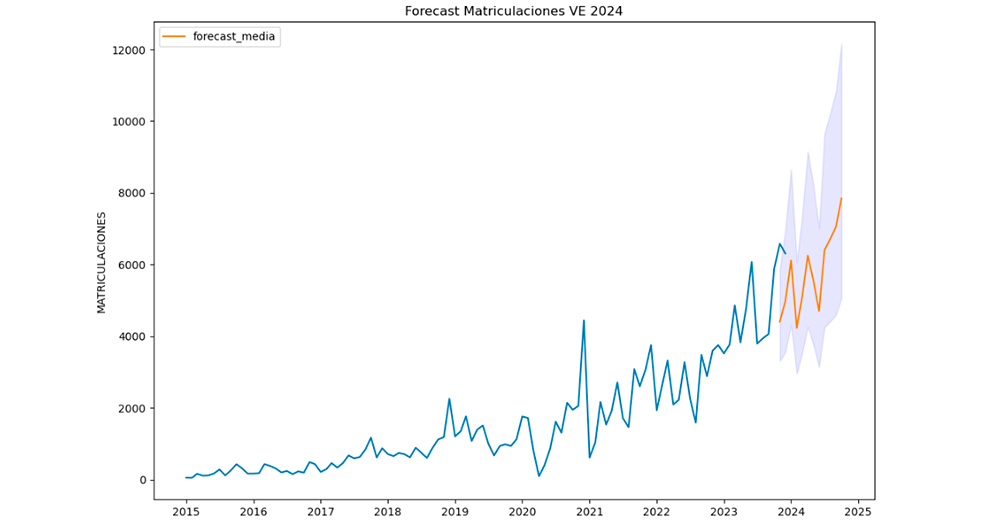
Road to electrification: Deciphering electric vehicle growth in Spain through data analytics
1. Introduction
Visualisations are graphical representations of data that allow to communicate, in a simple and effective way, the information linked to the data. The visualisation possibilities are very wide ranging, from basic representations such as line graphs, bar charts or relevant metrics,…
- Data exercises
Open data to achieve the Sustainable Development Goals
The Sustainable Development Goals (SDGs) are a set of targets adopted by the international community aimed at addressing the most pressing challenges of our time. These goals were born simultaneously with the Global Partnership for Sustainable Development Data and the International Open Data…
- Reports and studies

European Data Portal shares report with some standards for homogenising high-value data
In order to comply with Directive (EU) 2019/1024 and its subsequent implementing regulation, EU member states are working on making available so-called high-value datasets (HVD). The aim is to enable citizens and businesses to access such data under technical requirements that favour its re-…
- Reports and studies

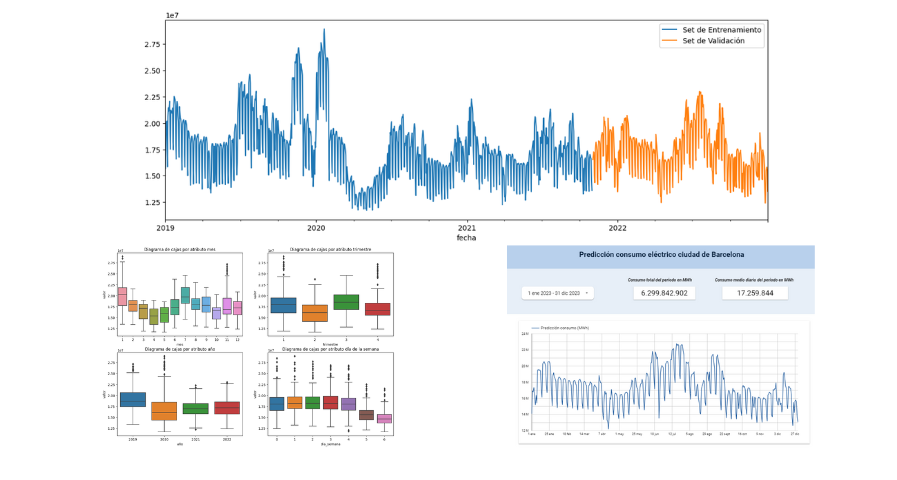
Predictive analisys of electric consuption in the city of Barcelona
1. Introduction
Visualizations are graphical representations of data that allow you to communicate, in a simple and effective way, the information linked to it. The visualization possibilities are very extensive, from basic representations such as line graphs, bar graphs or relevant metrics, to…
- Data exercises
Synthetic Data - What are they? And what are they used for?
In the era of data, we face the challenge of a scarcity of valuable data for building new digital products and services. Although we live in a time when data is everywhere, we often struggle to access quality data that allows us to understand processes or systems from a data-driven perspective. The…
- Reports and studies

Good Practices for Measuring the Impact of Open Data in Europe
The Open Data Maturity Study 2022 provides a snapshot of the level of development of policies promoting open data in countries, as well as an assessment of the expected impact of these policies. Among its findings, it highlights that measuring the impact of open data is a priority, but also a major…
- Reports and studies

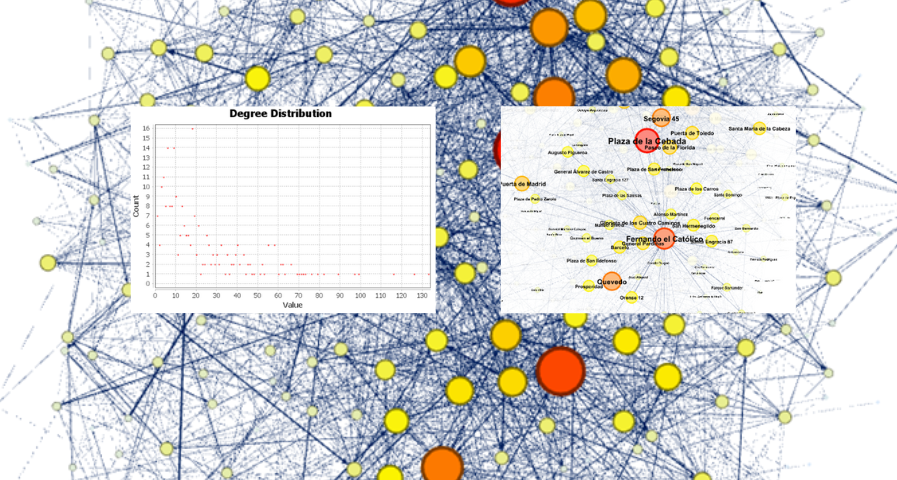
Analysis of travel networks in BICIMAD
1. Introduction
Visualizations are graphical representations of data that allow the information linked to them to be communicated in a simple and effective way. The visualization possibilities are very wide, from basic representations, such as line, bar or sector graphs, to visualizations…
- Data exercises
Open Data and Reuse of Public Sector Information in the Judicial Field: Challenges in Regulation, Use Cases, and Opportunities
The digitalization in the public sector in Spain has also reached the judicial field. The first regulation to establish a legal framework in this regard was the reform that took place through Law 18/2011, of July 5th (LUTICAJ). Since then, there have been advances in the technological modernization…
- Reports and studies

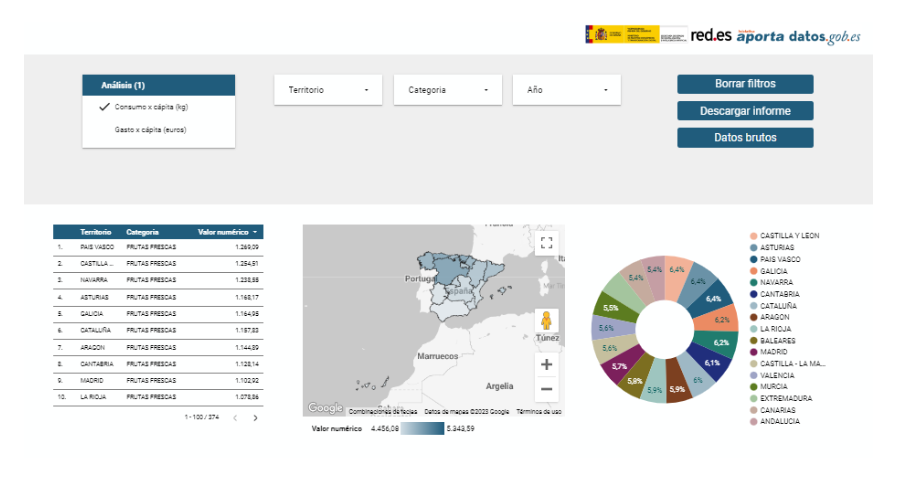
Study on nutrition in spanish homes
1. Introduction
Visualizations are graphical representations of data that allow the information linked to them to be communicated in a simple and effective way. The visualization possibilities are very wide, from basic representations, such as line, bar or sector graphs, to visualizations…
- Data exercises
Datos en tiempo real: Enfoques para integrar fuentes de datos en tiempo real en data.europa.eu
Este informe, que publica el Portal de Datos Europeo, analiza el potencial de reutilización de los datos en tiempo real. Los datos en tiempo real ofrecen información con alta frecuencia de actualización sobre el entorno que nos rodea (por ejemplo, información sobre el tráfico, datos…
- Reports and studies