Generating personalized tourist map with "Google My Maps"
Fecha del documento: 09-03-2023

1. Introduction
Visualizations are graphical representations of the data allowing to transmit in a simple and effective way related information. The visualization capabilities are extensive, from basic representations, such as a line chart, bars or sectors, to visualizations configured on control panels or interactive dashboards.
In this "Step-by-Step Visualizations" section we are periodically presenting practical exercises of open data visualizations available in datos.gob.es or other similar catalogs. They address and describe in an easy manner stages necessary to obtain the data, to perform transformations and analysis relevant to finally creating interactive visualizations, from which we can extract information summarized in final conclusions. In each of these practical exercises simple and well-documented code developments are used, as well as open-source tools. All generated materials are available for reuse in the GitHub repository.
In this practical exercise, we made a simple code development that is conveniently documented relying on free to use tools.
Access the data lab repository on Github
Run the data pre-procesing code on top of Google Colab
2. Objective
The main scope of this post is to show how to generate a custom Google Maps map using the "My Maps" tool based on open data. These types of maps are highly popular on websites, blogs and applications in the tourism sector, however, the useful information provided to the user is usually scarce.
In this exercise, we will use potential of the open-source data to expand the information to be displayed on our map in an automatic way. We will also show how to enrich open data with context information that significantly improves the user experience.
From a functional point of view, the goal of the exercise is to create a personalized map for planning tourist routes through the natural areas of the autonomous community of Castile and León. For this, open data sets published by the Junta of Castile and León have been used, which we have pre-processed and adapted to our needs in order to generate a personalized map.
3. Resources
3.1. Datasets
The datasets contain different tourist information of geolocated interest. Within the open data catalog of the Junta of Castile and León, we may find the "dictionary of entities" (additional information section), a document of vital importance, since it defines the terminology used in the different data sets.
- Viewpoints in natural areas
- Observatories in natural areas
- Shelters in natural areas
- Trees in natural areas
- Park houses in natural areas
- Recreational areas in natural areas
- Registration of hotel establishments
These datasets are also available in the Github repository.
3.2. Tools
To carry out the data preprocessing tasks, the Python programming language written on a Jupyter Notebook hosted in the Google Colab cloud service has been used.
"Google Colab" also called " Google Colaboratory", is a free cloud service from Google Research that allows you to program, execute and share from your browser code written in Python or R, so it does not require installation of any tool or configuration.
For the creation of the interactive visualization, the Google My Maps tool has been used.
"Google My Maps" is an online tool that allows you to create interactive maps that can be embedded in websites or exported as files. This tool is free, easy to use and allows multiple customization options.
If you want to know more about tools that can help you with the treatment and visualization of data, you can go to the section "Data processing and visualization tools".
4. Data processing and preparation
The processes that we describe below are commented in the Notebook which you can run from Google Colab.
Before embarking on building an effective visualization, we must carry out a prior data treatment, paying special attention to obtaining them and validating their content, ensuring that they are in the appropriate and consistent format for processing and that they do not contain errors.
The first step necessary is performing the exploratory analysis of the data (EDA) in order to properly interpret the starting data, detect anomalies, missing data or errors that could affect the quality of the subsequent processes and results. If you want to know more about this process, you can go to the Practical Guide of Introduction to Exploratory Data Analysis.
The next step is to generate the tables of preprocessed data that will be used to feed the map. To do so, we will transform the coordinate systems, modify and filter the information according to our needs.
The steps required in this data preprocessing, explained in the Notebook, are as follows:
- Installation and loading of libraries
- Loading datasets
- Exploratory Data Analysis (EDA)
- Preprocessing of datasets
During the preprocessing of the data tables, it is necessary to change the coordinate system since in the source datasets the ESTR89 (standard system used in the European Union) is used, while we will need them in the WGS84 (system used by Google My Maps among other geographical applications). How to make this coordinate change is explained in the Notebook. If you want to know more about coordinate types and systems, you can use the "Spatial Data Guide".
Once the preprocessing is finished, we will obtain the data tables "recreational_natural_parks.csv", "rural_accommodations_2stars.csv", "natural_park_shelters.csv", "observatories_natural_parks.csv", "viewpoints_natural_parks.csv", "park_houses.csv", "trees_natural_parks.csv" which include generic and common information fields such as: name, observations, geolocation,... together with specific information fields, which are defined in details in section "6.2 Personalization of the information to be displayed on the map".
You will be able to reproduce this analysis, as the source code is available in our GitHub account. The code can be provided through a document made on a Jupyter Notebook once loaded into the development environment can be easily run or modified. Due to informative nature of this post and to favor understanding of non-specialized readers, the code is not intended to be the most efficient, but rather to facilitate its understanding so you could possibly come up with many ways to optimize the proposed code to achieve similar purposes. We encourage you to do so!
5. Data enrichment
To provide more related information, a data enrichment process is carried out on the dataset "hotel accommodation registration" explained below. With this step we will be able to automatically add complementary information that was initially not included. With this, we will be able to improve the user experience during their use of the map by providing context information related to each point of interest.
For this we will apply a useful tool for such kind of a tasks: OpenRefine. This open-source tool allows multiple data preprocessing actions, although this time we will use it to carry out an enrichment of our data by incorporating context by automatically linking information that resides in the popular Wikidata knowledge repository.
Once the tool is installed on our computer, when executed – a web application will open in the browser in case it is not opened automatically.
Here are the steps to follow.
Step 1
Loading the CSV into the system (Figure 1). In this case, the dataset "Hotel accommodation registration".

Figure 1. Uploading CSV file to OpenRefine
Step 2
Creation of the project from the uploaded CSV (Figure 2). OpenRefine is managed by projects (each uploaded CSV will be a project), which are saved on the computer where OpenRefine is running for possible later use. In this step we must assign a name to the project and some other data, such as the column separator, although the most common is that these last settings are filled automatically.
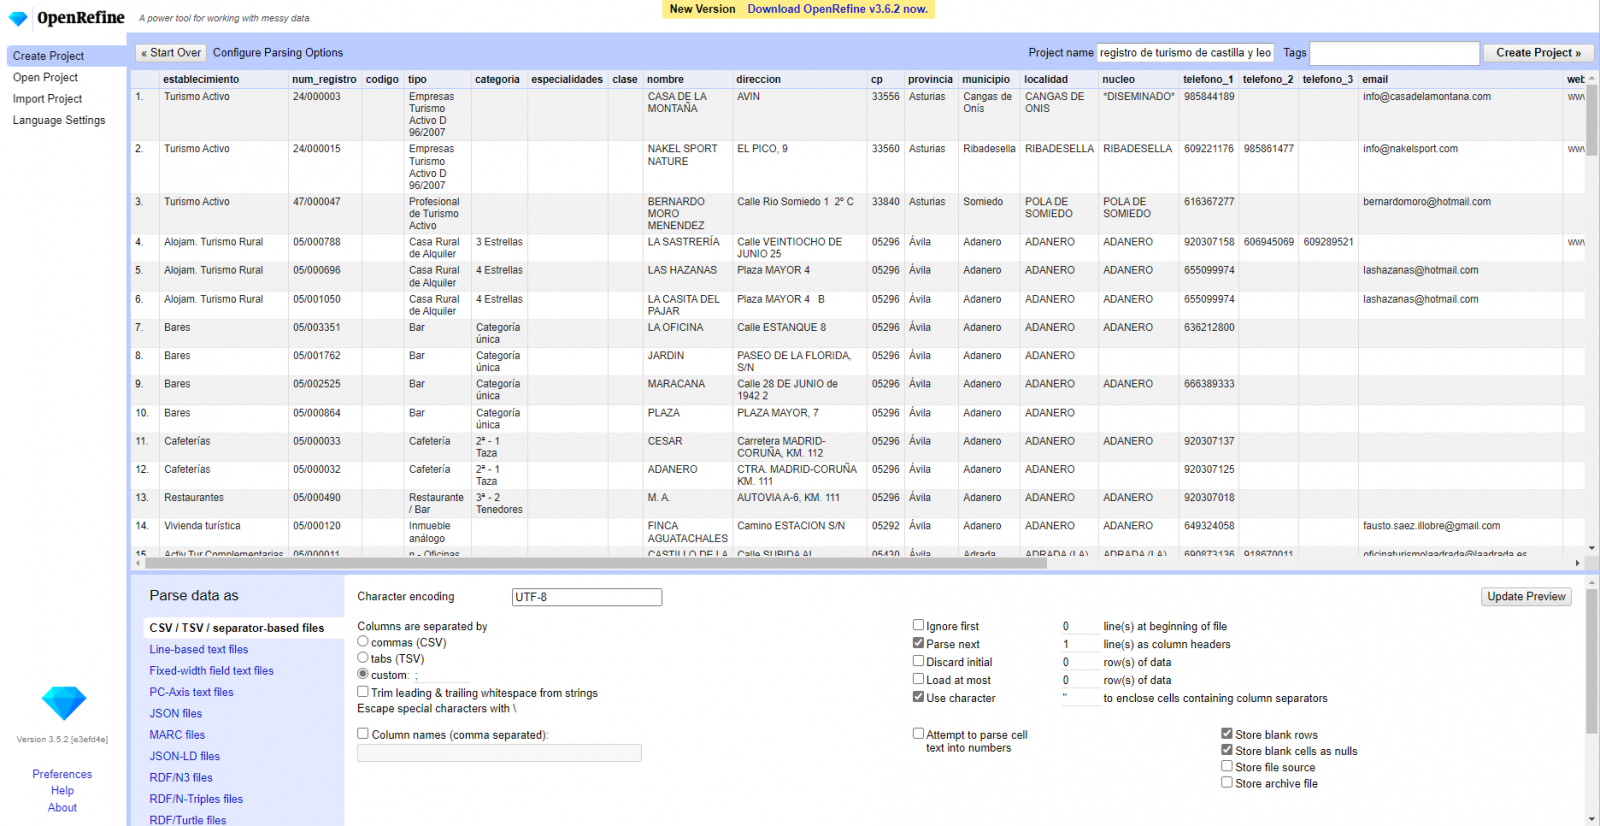
Figure 2. Creating a project in OpenRefine
Step 3
Linked (or reconciliation, using OpenRefine nomenclature) with external sources. OpenRefine allows us to link resources that we have in our CSV with external sources such as Wikidata. To do this, the following actions must be carried out:
- Identification of the columns to be linked. Usually, this step is based on the analyst experience and knowledge of the data that is represented in Wikidata. As a hint, generically you can reconcile or link columns that contain more global or general information such as country, streets, districts names etc., and you cannot link columns like geographical coordinates, numerical values or closed taxonomies (types of streets, for example). In this example, we have the column "municipalities" that contains the names of the Spanish municipalities.
- Beginning of reconciliation (Figure 3). We start the reconciliation and select the default source that will be available: Wikidata. After clicking Start Reconciling, it will automatically start searching for the most suitable Wikidata vocabulary class based on the values in our column.
- Obtaining the values of reconciliation. OpenRefine offers us an option of improving the reconciliation process by adding some features that allow us to conduct the enrichment of information with greater precision.
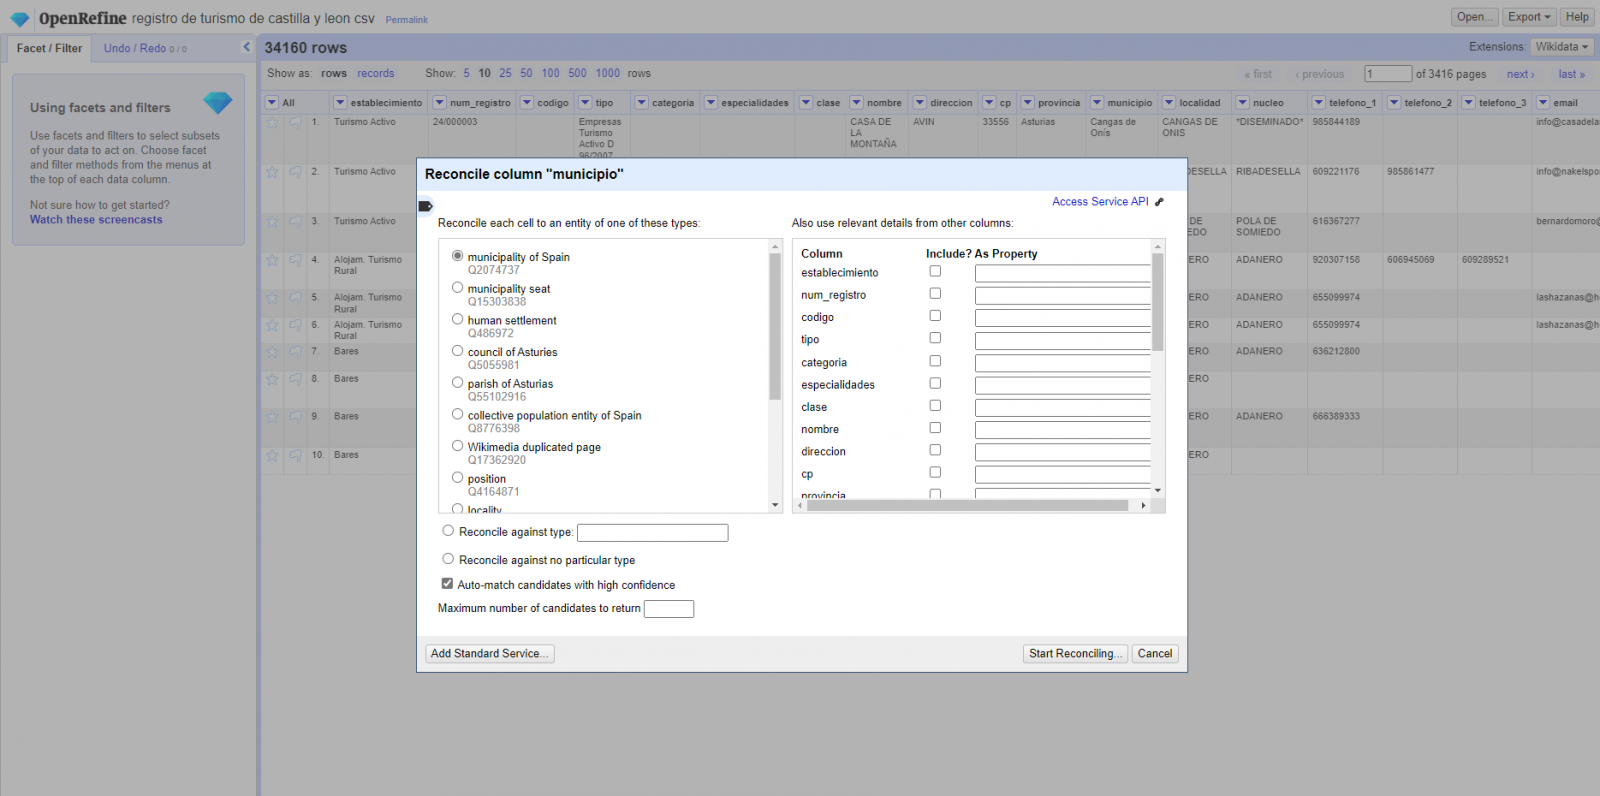
Figure 3. Selecting the class that best represents the values in the "municipality"
Step 4
Generate a new column with the reconciled or linked values (Figure 4). To do this we need to click on the column "municipality" and go to "Edit Column → Add column based in this column", where a text will be displayed in which we will need to indicate the name of the new column (in this example it could be "wikidata"). In the expression box we must indicate: "http://www.wikidata.org/ entity/"+cell.recon.match.id and the values appear as previewed in the Figure. "http://www.wikidata.org/entity/" is a fixed text string to represent Wikidata entities, while the reconciled value of each of the values is obtained through the cell.recon.match.id statement, that is, cell.recon.match.id("Adanero") = Q1404668
Thanks to the abovementioned operation, a new column will be generated with those values. In order to verify that it has been executed correctly, we click on one of the cells in the new column which should redirect to the Wikidata webpage with reconciled value information.
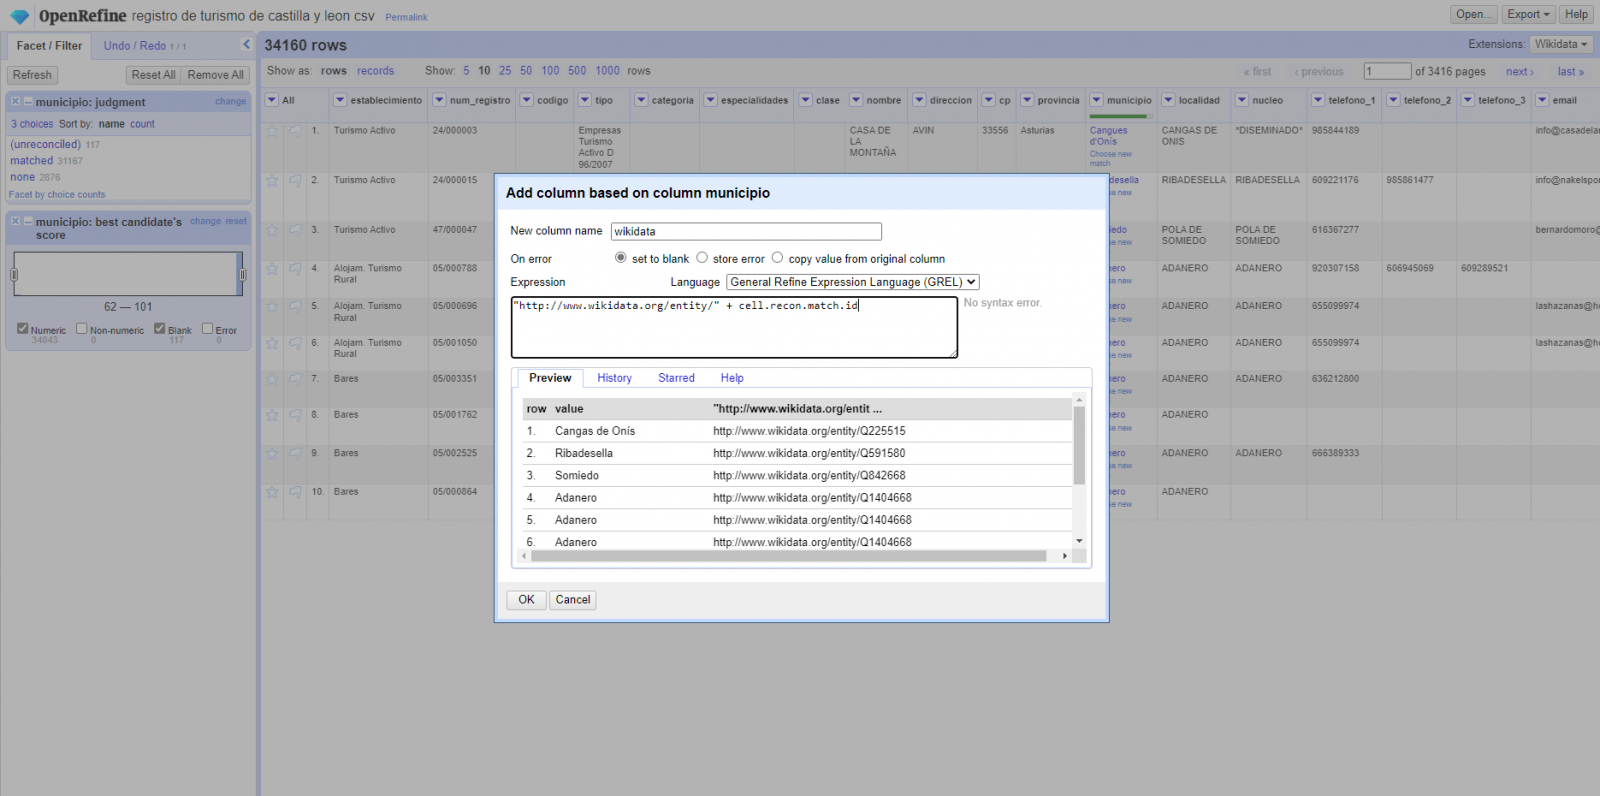
Figure 4. Generating a new column with reconciled values
Step 5
We repeat the process by changing in step 4 the "Edit Column → Add column based in this column" with "Add columns from reconciled values" (Figure 5). In this way, we can choose the property of the reconciled column.
In this exercise we have chosen the "image" property with identifier P18 and the "population" property with identifier P1082. Nevertheless, we could add all the properties that we consider useful, such as the number of inhabitants, the list of monuments of interest, etc. It should be mentioned that just as we enrich data with Wikidata, we can do so with other reconciliation services.
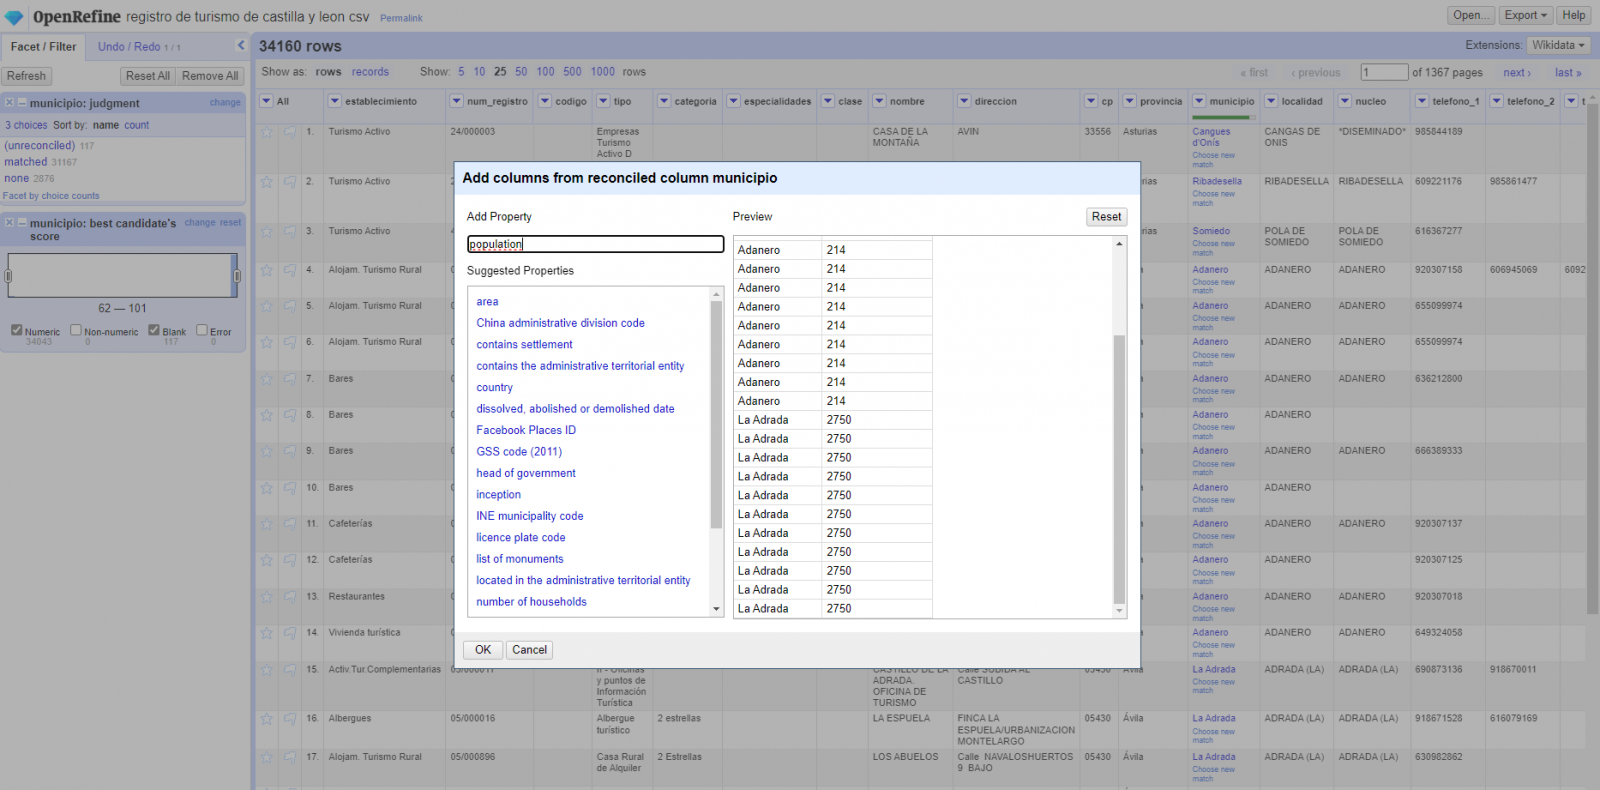
Figura 5. Choice of property for reconciliation
In the case of the "image" property, due to the display, we want the value of the cells to be in the form of a link, so we have made several adjustments. These adjustments have been the generation of several columns according to the reconciled values, adequacy of the columns through commands in GREL language (OpenRefine's own language) and union of the different values of both columns. You can check these settings and more techniques to improve your handling of OpenRefine and adapt it to your needs in the following User Manual.
6. Map visualization
6.1 Map generation with "Google My Maps"
To generate the custom map using the My Maps tool, we have to execute the following steps:
- We log in with a Google account and go to "Google My Maps", with free access with no need to download any kind of software.
- We import the preprocessed data tables, one for each new layer we add to the map. Google My Maps allows you to import CSV, XLSX, KML and GPX files (Figure 6), which should include associated geographic information. To perform this step, you must first create a new layer from the side options menu.
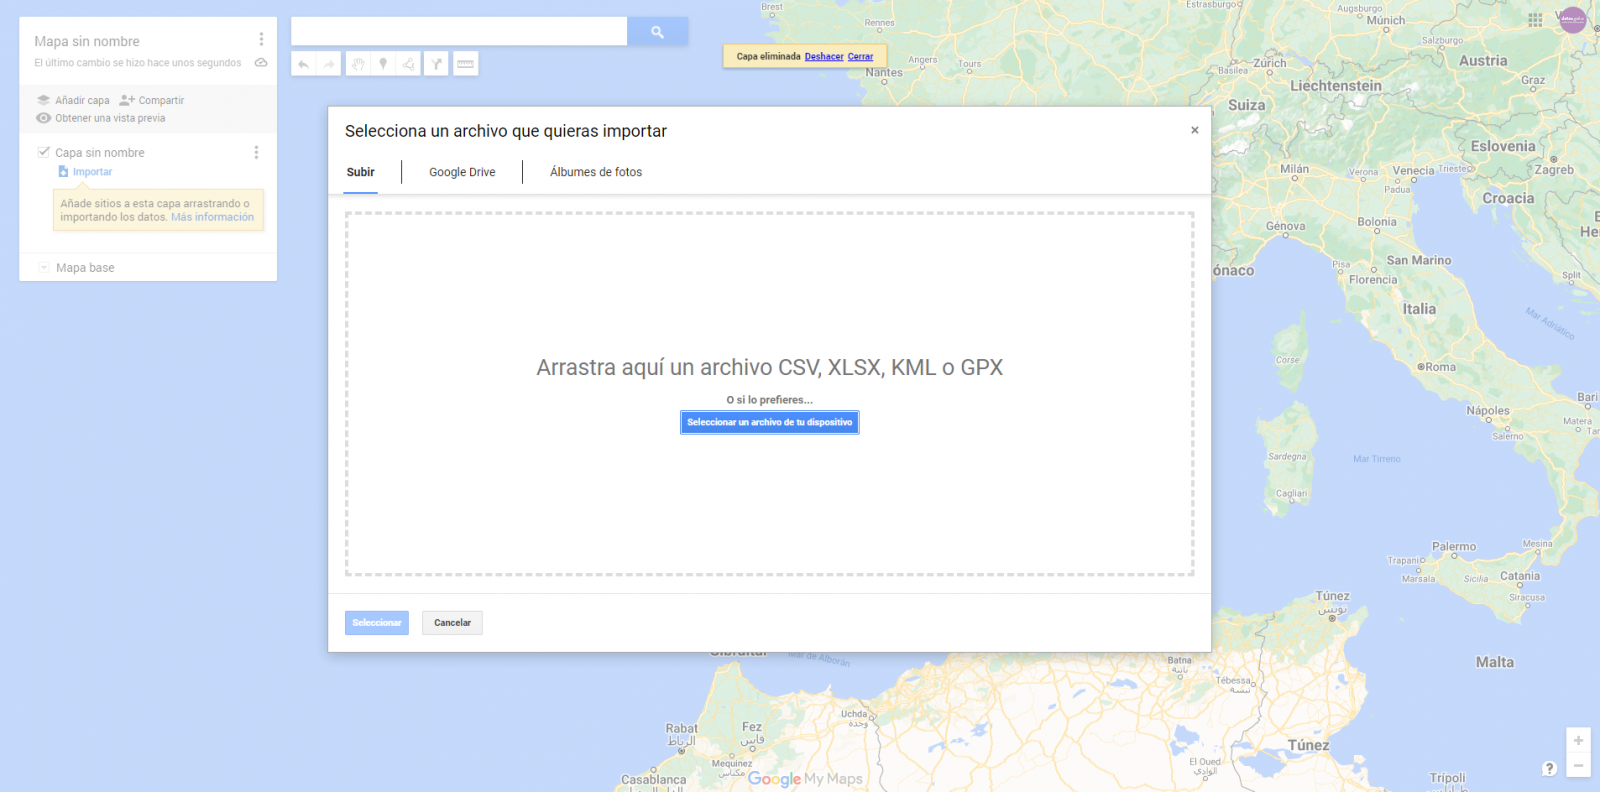
Figure 6. Importing files into "Google My Maps"
- In this case study, we'll import preprocessed data tables that contain one variable with latitude and other with longitude. This geographic information will be automatically recognized. My Maps also recognizes addresses, postal codes, countries, ...
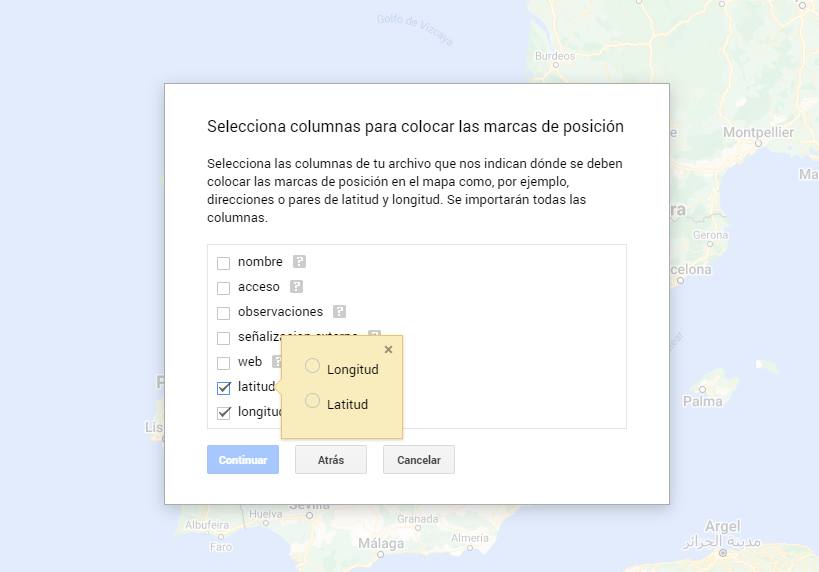
Figura 7. Select columns with placement values
- With the edit style option in the left side menu, in each of the layers, we can customize the pins, editing their color and shape.

Figure 8. Position pin editing
- Finally, we can choose the basemap that we want to display at the bottom of the options sidebar.
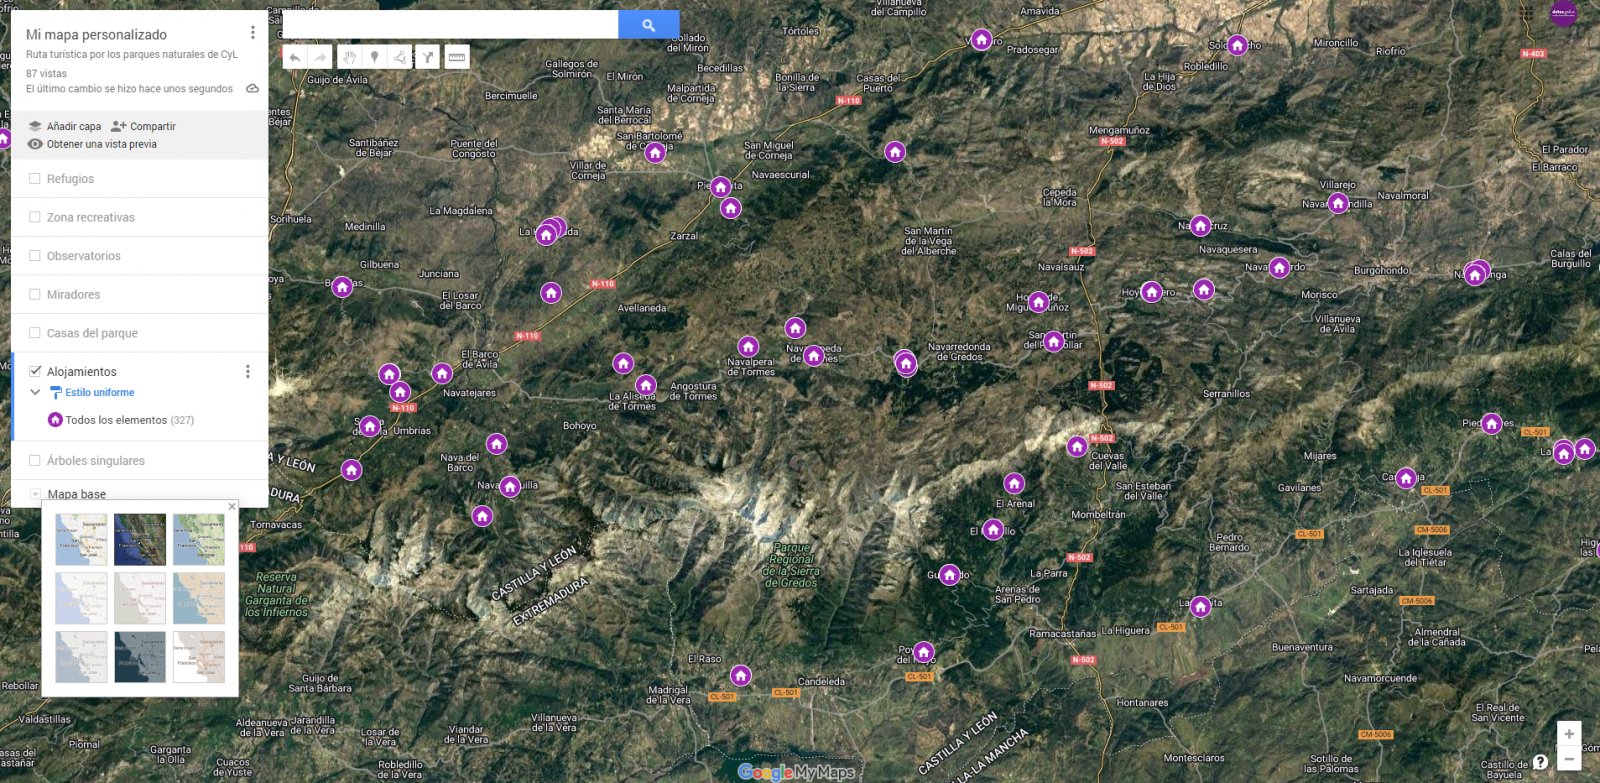
Figura 9. Basemap selection
If you want to know more about the steps for generating maps with "Google My Maps", check out the following step-by-step tutorial.
6.2 Personalization of the information to be displayed on the map
During the preprocessing of the data tables, we have filtered the information according to the focus of the exercise, which is the generation of a map to make tourist routes through the natural spaces of Castile and León. The following describes the customization of the information that we have carried out for each of the datasets.
- In the dataset belonging to the singular trees of the natural areas, the information to be displayed for each record is the name, observations, signage and position (latitude / longitude)
- In the set of data belonging to the houses of the natural areas park, the information to be displayed for each record is the name, observations, signage, access, web and position (latitude / longitude)
- In the set of data belonging to the viewpoints of the natural areas, the information to be displayed for each record is the name, observations, signage, access and position (latitude / longitude)
- In the dataset belonging to the observatories of natural areas, the information to be displayed for each record is the name, observations, signaling and position (latitude / longitude)
- In the dataset belonging to the shelters of the natural areas, the information to be displayed for each record is the name, observations, signage, access and position (latitude / longitude). Since shelters can be in very different states and that some records do not offer information in the "observations" field, we have decided to filter to display only those that have information in that field.
- In the set of data belonging to the recreational areas of the natural park, the information to be displayed for each record is the name, observations, signage, access and position (latitude / longitude). We have decided to filter only those that have information in the "observations" and "access" fields.
- In the set of data belonging to the accommodations, the information to be displayed for each record is the name, type of establishment, category, municipality, web, telephone and position (latitude / longitude). We have filtered the "type" of establishment only those that are categorized as rural tourism accommodations and those that have 2 stars.
Following a visualization of the custom map we have created is returned. By selecting the icon to enlarge the map that appears in the upper right corner, you can access its full-screen display
6.3 Map functionalities (layers, pins, routes and immersive 3D view)
At this point, once the custom map is created, we will explain various functionalities offered by "Google My Maps" during the visualization of the data.
- Layers
Using the drop-down menu on the left, we can activate and deactivate the layers to be displayed according to our needs.
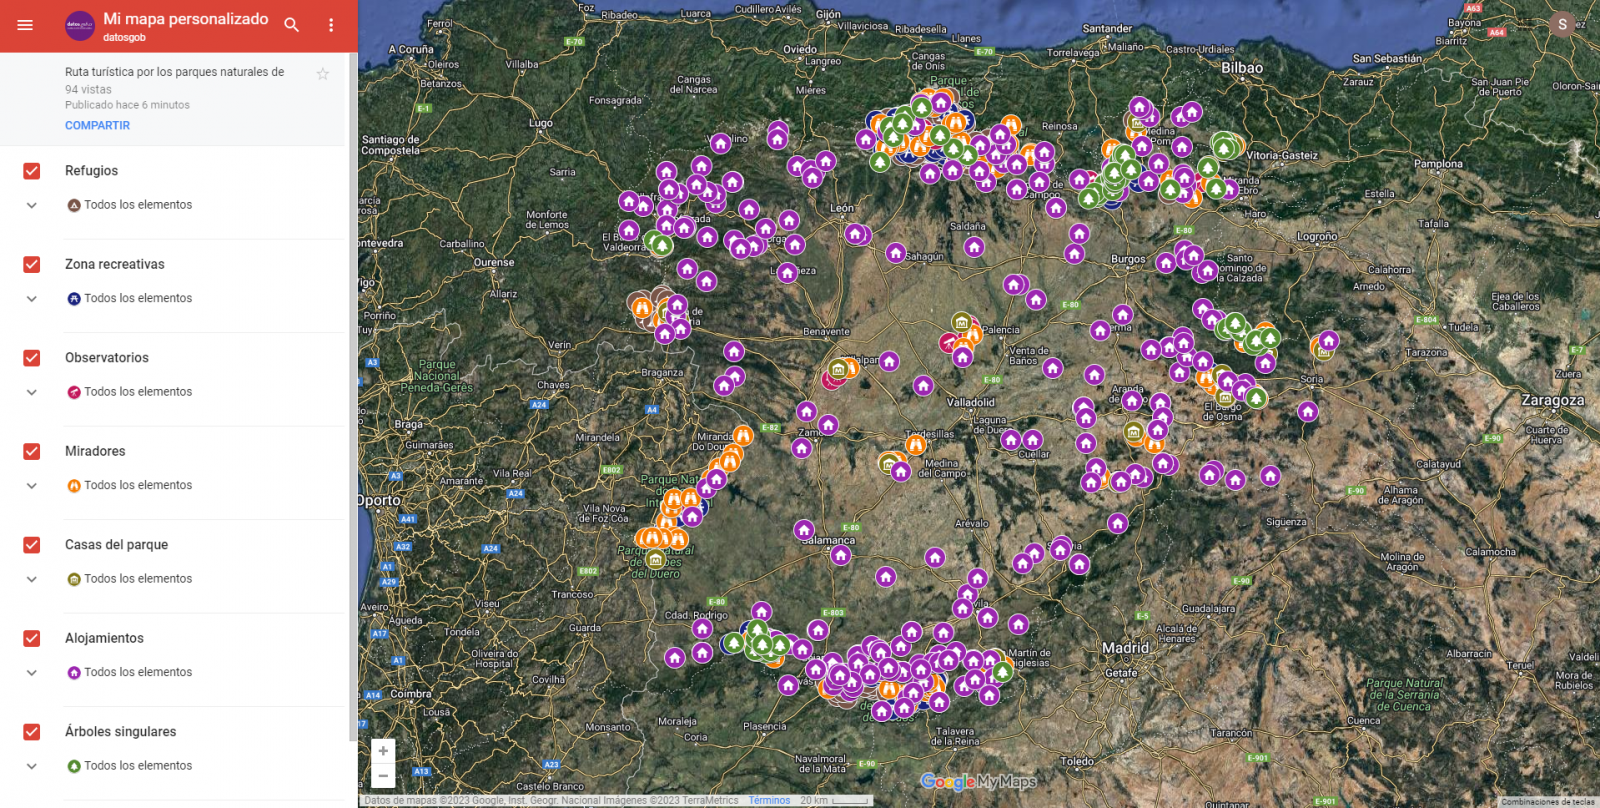
Figure 10. Layers in "My Maps"
-
Pins
By clicking on each of the pins of the map we can access the information associated with that geographical position.
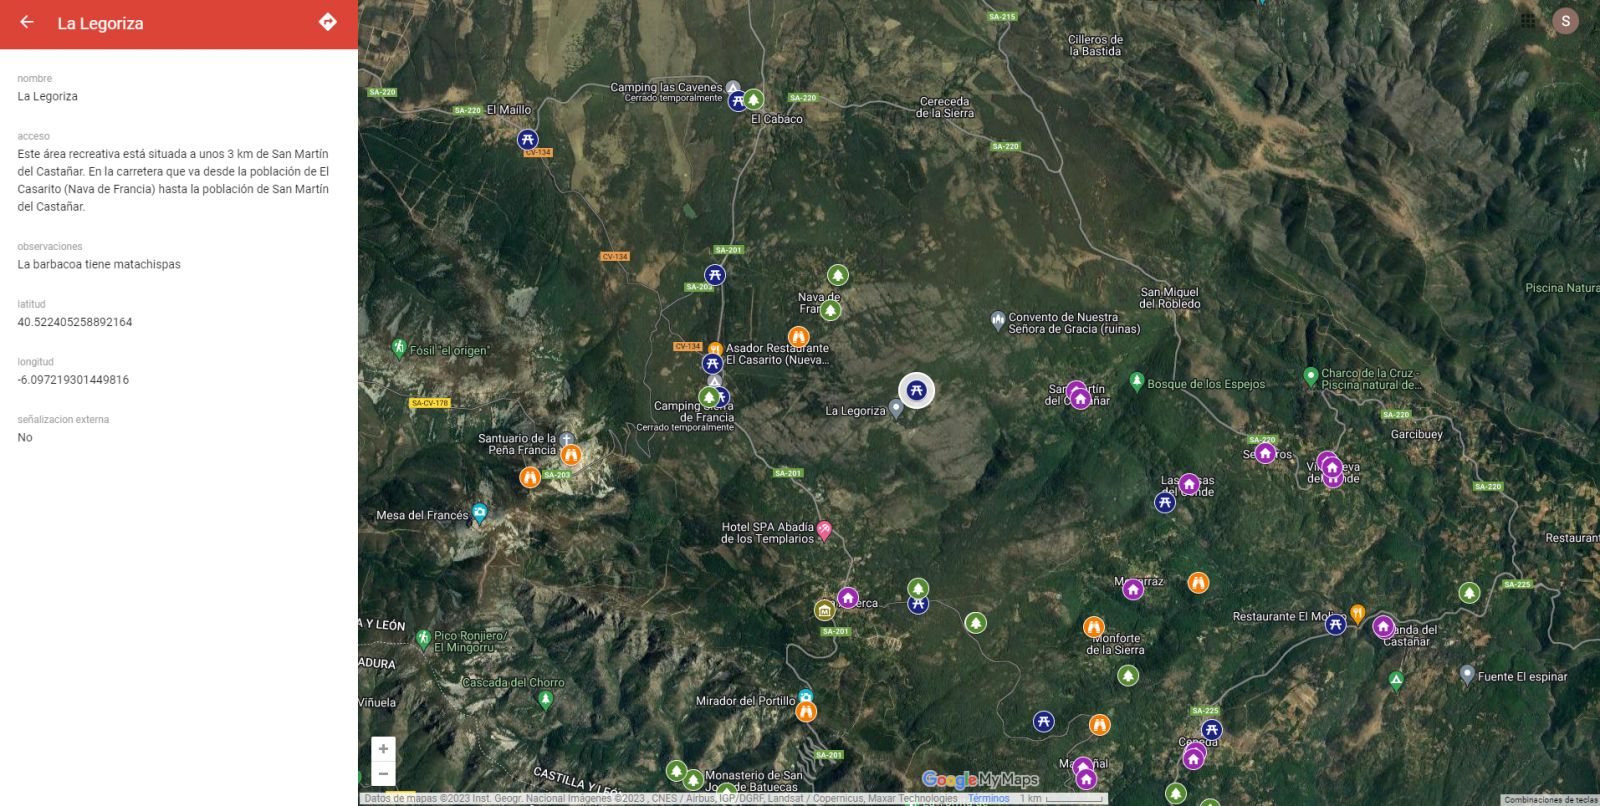
Figure 11. Pins in "My Maps"
-
Routes
We can create a copy of the map on which to add our personalized tours.
In the options of the left side menu select "copy map". Once the map is copied, using the add directions symbol, located below the search bar, we will generate a new layer. To this layer we can indicate two or more points, next to the means of transport and it will create the route next to the route indications.

Figure 12. Routes in "My Maps"
-
3D immersive map
Through the options symbol that appears in the side menu, we can access Google Earth, from where we can explore the immersive map in 3D, highlighting the ability to observe the altitude of the different points of interest. You can also access through the following link.
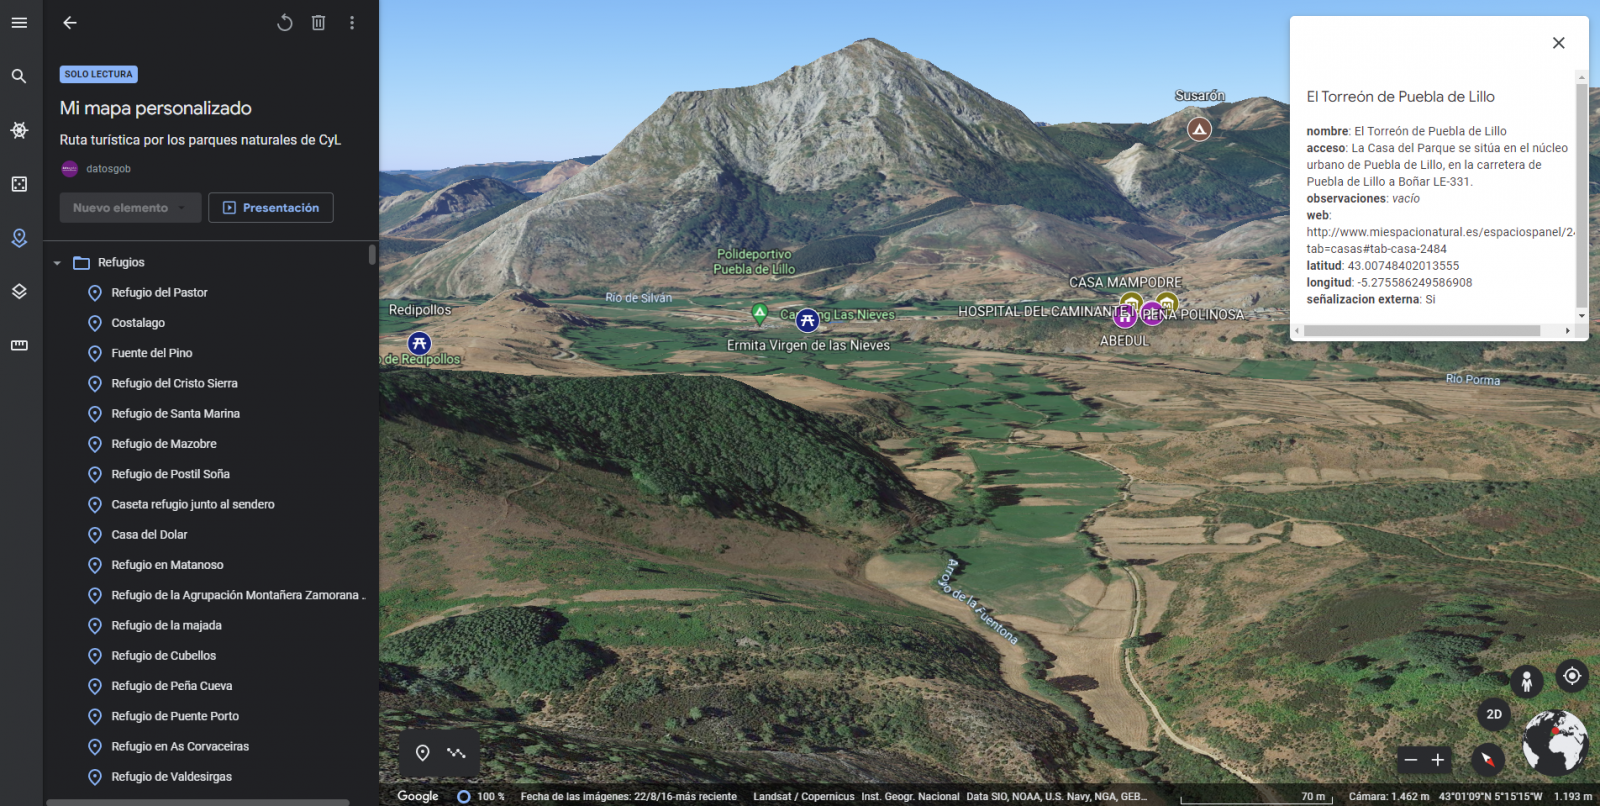
Figure 13. 3D immersive view
7. Conclusions of the exercise
Data visualization is one of the most powerful mechanisms for exploiting and analyzing the implicit meaning of data. It is worth highlighting the vital importance that geographical data have in the tourism sector, which we have been able to verify in this exercise.
As a result, we have developed an interactive map with information provided by Linked Data, which we have customized according to our interests.
We hope that this step-by-step visualization has been useful for learning some very common techniques in the treatment and representation of open data. We will be back to show you new reuses. See you soon!


