A practical introductory guide to exploratory data analysis in Python


Fecha del documento: 05-11-2024

The following presents a new guide to Exploratory Data Analysis (EDA) implemented in Python, which evolves and complements the version published in R in 2021. This update responds to the needs of an increasingly diverse community in the field of data science.
Exploratory Data Analysis (EDA) represents a critical step prior to any statistical analysis, as it allows:
- Comprehensive understanding of the data before analyzing it.
- Verification of statistical requirements that will ensure the validity of subsequent analyses.
To exemplify its importance, let's take the case of detecting and treating outliers, one of the tasks to be performed in an EDA. This phase has a significant impact on fundamental statistics such as the mean, standard deviation, or coefficient of variation.
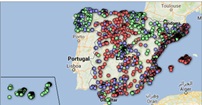
This guide maintains as a practical case the analysis of air quality data from Castilla y León, demonstrating how to transform public data into valuable information through the use of fundamental Python libraries such as pandas, matplotlib, and seaborn, along with modern automated analysis tools like ydata-profiling.
In addition to explaining the different phases of an EDA, the guide illustrates them with a practical case. In this sense, the analysis of air quality data from Castilla y León is maintained as a practical case. Through explanations that users can replicate, public data is transformed into valuable information using fundamental Python libraries such as pandas, matplotlib, and seaborn, along with modern automated analysis tools like ydata-profiling.
Why a new guide in Python?
The choice of Python as the language for this new guide reflects its growing relevance in the data science ecosystem. Its intuitive syntax and extensive catalog of specialized libraries have made it a fundamental tool for data analysis. By maintaining the same dataset and analytical structure as the R version, understanding the differences between both languages is facilitated. This is especially valuable in environments where multiple technologies coexist. This approach is particularly relevant in the current context, where numerous organizations are migrating their analyses from traditional languages/tools like R, SAS, or SPSS to Python. The guide seeks to facilitate these transitions and ensure continuity in the quality of analyses during the migration process.
New features and improvements
The content has been enriched with the introduction to automated EDA and data profiling tools, thus responding to one of the latest trends in the field. The document delves into essential aspects such as environmental data interpretation, offers a more rigorous treatment of outliers, and presents a more detailed analysis of correlations between variables. Additionally, it incorporates good practices in code writing.
The practical application of these concepts is illustrated through the analysis of air quality data, where each technique makes sense in a real context. For example, when analyzing correlations between pollutants, it not only shows how to calculate them but also explains how these patterns reflect real atmospheric processes and what implications they have for air quality management.
Structure and contents
The guide follows a practical and systematic approach, covering the five fundamental stages of EDA:
- Descriptive analysis to obtain a representative view of the data.
- Variable type adjustment to ensure consistency.
- Detection and treatment of missing data.
- Identification and management of outliers.
- Correlation analysis between variables.

Figure 1. Phases of exploratory data analysis. Source: own elaboration.
As a novelty in the structure, a section on automated exploratory analysis is included, presenting modern tools that facilitate the systematic exploration of large datasets.
Who is it for?
This guide is designed for open data users who wish to conduct exploratory analyses and reuse the valuable sources of public information found in this and other data portals worldwide. While basic knowledge of the language is recommended, the guide includes resources and references to improve Python skills, as well as detailed practical examples that facilitate self-directed learning.
The complete material, including both documentation and source code, is available in the portal's GitHub repository. The implementation has been done using open-source tools such as Jupyter Notebook in Google Colab, which allows reproducing the examples and adapting the code according to the specific needs of each project.
The community is invited to explore this new guide, experiment with the provided examples, and take advantage of these resources to develop their own open data analyses.
Click to see the full infographic, in accessible version
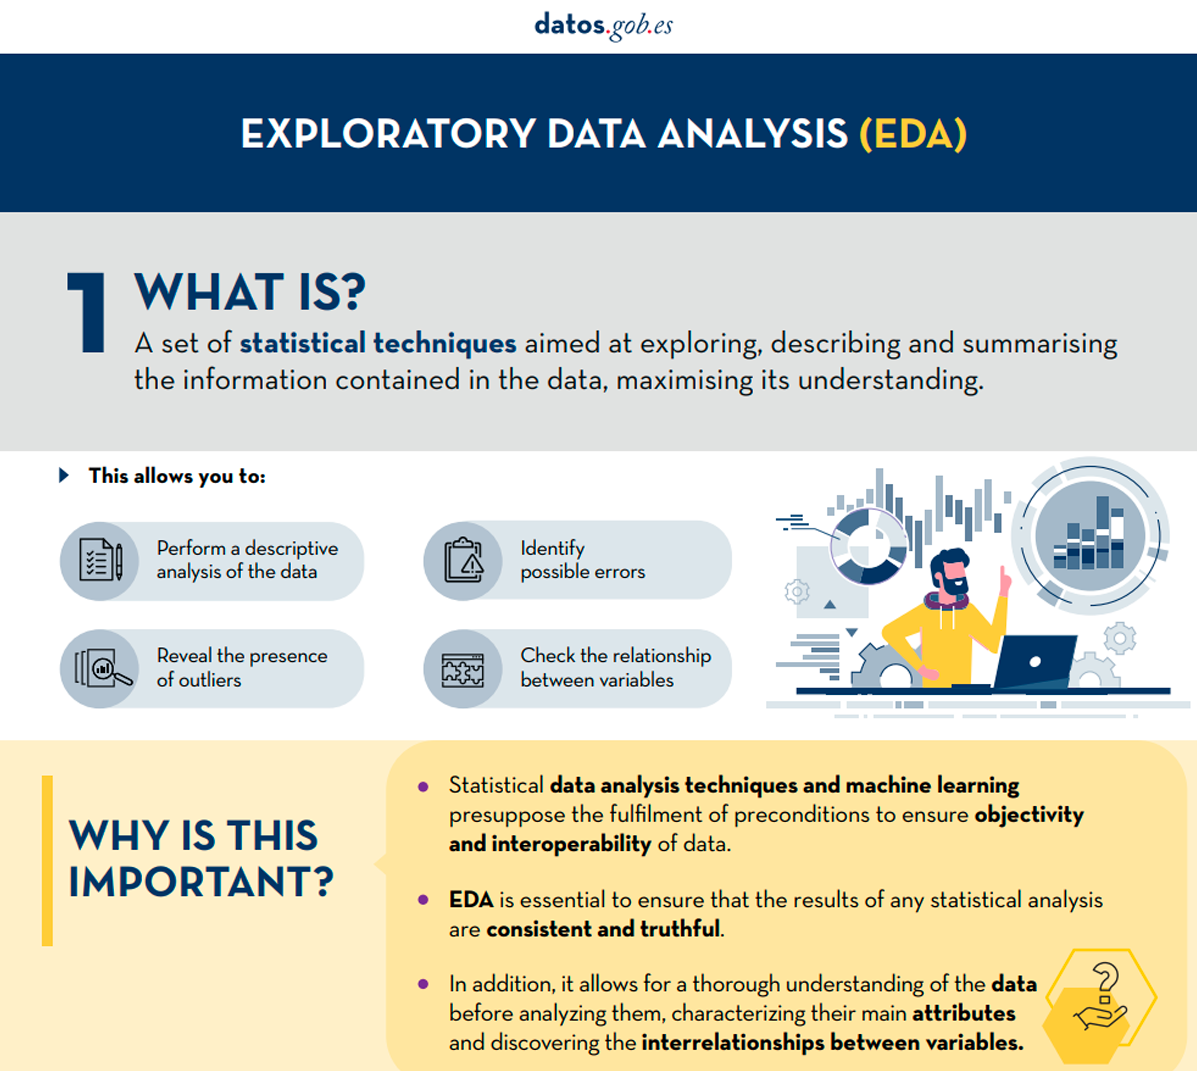
Figure 2. Capture of the infographic. Source: own elaboration.