Blog
The European Open Science Cloud (EOSC) is a European Union initiative that aims to promote open science through the creation of an open, collaborative and sustainabledigital research infrastructure. EOSC's main objective is to provide European researchers with easier access to the data, tools and resources they need to conduct quality research.
EOSC on the European Research and Data Agenda
EOSC is part of the 20 actions of the European Research Area (ERA) agenda 2022-2024 and is recognised as the European data space for science, research and innovation, to be integrated with other sectoral data spaces defined in the European data strategy. Among the expected benefits of the platform are the following:
- An improvement in the confidence, quality and productivity of European science.
- The development of new innovative products and services.
- Improving the impact of research in tackling major societal challenges.
The EOSC platform
EOSC is in fact an ongoing process that sets out a roadmap in which all European states participate, based on the central idea that research data is a public good that should be available to all researchers, regardless of their location or affiliation. This model aims to ensure that scientific results comply with the FAIR (Findable, Accessible, Interoperable, Reusable) Principles to facilitate reuse, as in any other data space.
However, the most visible part of EOSC is its platform that gives access to millions of resources contributed by hundreds of content providers. This platform is designed to facilitate the search, discovery and interoperability of data and other content such as training resources, security, analysis, tools, etc. To this end, the key elements of the architecture envisaged in EOSC include two main components:
- EOSC Core: which provides all the basic elements needed to discover, share, access and reuse resources - authentication, metadata management, metrics, persistent identifiers, etc.
- EOSC Exchange: to ensure that common and thematic services for data management and exploitation are available to the scientific community.
In addition, the ESOC Interoperability Framework (EOSC-IF)is a set of policies and guidelines that enable interoperability between different resources and services and facilitate their subsequent combination.
The platform is currently available in 24 languages and is continuously updated to add new data and services. Over the next seven years, a joint investment by the EU partners of at least EUR 1 billion is foreseen for its further development.
Participation in EOSC
The evolution of EOSC is being guided by a tripartite coordinating body consisting of the European Commission itself, the participating countries represented on the EOSC Steering Board and the research community represented through the EOSC Association. In addition, in order to be part of the ESCO community, you only have to follow a series of minimum rules of participation:
- The whole EOSC concept is based on the general principle of openness.
- Existing EOSC resources must comply with the FAIR principles.
- Services must comply with the EOSC architecture and interoperability guidelines.
- EOSC follows the principles of ethical behaviour and integrity in research.
- EOSC users are also expected to contribute to EOSC.
- Users must comply with the terms and conditions associated with the data they use.
- EOSC users always cite the sources of the resources they use in their work.
- Participation in EOSC is subject to applicable policies and legislation.
EOSC in Spain
The Consejo Superior de Investigaciones Científicas (CSIC) of Spain was one of the 4 founding members of the association and is currently a commissioned member of the association, in charge of coordination at national level.
CSIC has been working for years on its open access repository DIGITAL.CSIC as a step towards its future integration into EOSC. Within its work in open science we can highlight for example the adoption of the Current Research Information System (CRIS), information systems designed to help research institutions to collect, organise and manage data on their research activity: researchers, projects, publications, patents, collaborations, funding, etc.
CRIS are already important tools in helping institutions track and manage their scientific output, promoting transparency and open access to research. But they can also play an important role as sources of information feeding into the EOSC, as data collected in CRIS can also be easily shared and used through the EOSC.
The road to open science
Collaboration between CRIS and ESCO has the potential to significantly improve the accessibility and re-use of research data, but there are also other transitional actions that can be taken on the road to producing increasingly open science:
- Ensure the quality of metadata to facilitate open data exchange.
- Disseminate the FAIR principles among the research community.
- Promote and develop common standards to facilitate interoperability.
- Encourage the use of open repositories.
- Contribute by sharing resources with the rest of the community.
This will help to boost open science, increasing the efficiency, transparency and replicability of research.
Content prepared by Carlos Iglesias, Open data Researcher and consultant, World Wide Web Foundation.
The contents and points of view reflected in this publication are the sole responsibility of its author.
Blog
In the digital age, technological advancements have transformed the field of medical research. One of the factors contributing to technological development in this area is data, particularly open data. The openness and availability of information obtained from health research provide multiple benefits to the scientific community. Open data in the healthcare sector promotes collaboration among researchers, accelerates the validation process of study results, and ultimately helps save lives.
The significance of this type of data is also evident in the prioritized intention to establish the European Health Data Space (EHDS), the first common EU data space emerging from the European Data Strategy and one of the priorities of the Commission for the 2019-2025 period. As proposed by the European Commission, the EHDS will contribute to promoting better sharing and access to different types of health data, not only to support healthcare delivery but also for health research and policymaking.
However, the handling of this type of data must be appropriate due to the sensitive information it contains. Personal data related to health is considered a special category by the Spanish Data Protection Agency (AEPD), and a personal data breach, especially in the healthcare sector, has a high personal and social impact.
To avoid these risks, medical data can be anonymized, ensuring compliance with regulations and fundamental rights, thereby protecting patient privacy. The Basic Anonymization Guide developed by the AEPD based on the Personal Data Protection Commission Singapore (PDPC) defines key concepts of an anonymization process, including terms, methodological principles, types of risks, and existing techniques.
Once this process is carried out, medical data can contribute to research on diseases, resulting in improvements in treatment effectiveness and the development of medical assistance technologies. Additionally, open data in the healthcare sector enables scientists to share information, results, and findings quickly and accessibly, thus fostering collaboration and study replicability.
In this regard, various institutions share their anonymized data to contribute to health research and scientific development. One of them is the FISABIO Foundation (Foundation for the Promotion of Health and Biomedical Research of the Valencian Community), which has become a reference in the field of medicine thanks to its commitment to open data sharing. As part of this institution, located in the Valencian Community, there is the FISABIO-CIPF Biomedical Imaging Unit, which is dedicated, among other tasks, to the study and development of advanced medical imaging techniques to improve disease diagnosis and treatment.
This research group has developed different projects on medical image analysis. The outcome of all their work is published under open-source licenses: from the results of their research to the data repositories they use to train artificial intelligence and machine learning models.
To protect sensitive patient data, they have also developed their own techniques for anonymizing and pseudonymizing images and medical reports using a Natural Language Processing (NLP) model, whereby anonymized data can be replaced by synthetic values. Following their technique, facial information from brain MRIs can be erased using open-source deep learning software.
BIMCV: Medical Imaging Bank of the Valencian Community
One of the major milestones of the Regional Ministry of Universal Health and Public Health, through the Foundation and the San Juan de Alicante Hospital, is the creation and maintenance of the Medical Imaging Bank of the Valencian Community, BIMCV (Medical Imaging Databank of the Valencia Region in English), a repository of knowledge aimed at achieving "technological advances in medical imaging and providing technological coverage services to support R&D projects," as explained on their website.
BIMCV is hosted on XNAT, a platform that contains open-source images for image-based research and is accessible by prior registration and/or on-demand. Currently, the Medical Imaging Bank of the Valencian Community includes open data from research conducted in various healthcare centers in the region, housing data from over 90,000 subjects collected in more than 150,000 sessions.
New Dataset of Radiological Images
Recently, the FISABIO-CIPF Biomedical Imaging Unit and the Prince Felipe Research Center (FISABIO-CIPF) released in open access the third and final iteration of data from the BIMCV-COVID-19 project. They released image data of chest radiographs taken from patients with and without COVID-19, as well as the models they had trained for the detection of different chest X-ray pathologies, thanks to the support of the Regional Ministry of Innovation, the Regional Ministry of Health and the European Union REACT-EU Funds. All of this was made available "for use by companies in the sector or simply for research purposes," explains María de la Iglesia, director of the unit. "We believe that reproducibility is of great relevance and importance in the healthcare sector," she adds. The datasets and the results of their research can be accessed here.
The findings are mapped using the standard terminology of the Unified Medical Language System (UMLS), as proposed by the results of Dr. Aurelia Bustos' doctoral thesis, an oncologist and computer engineer. They are stored in high resolution with anatomical labels in a Medical Image Data Structure (MIDS) format. Among the stored information are patient demographic data, projection type, and imaging study acquisition parameters, among others, all anonymized.
The contribution that such open data projects make to society not only benefits researchers and healthcare professionals but also enables the development of solutions that can have a significant impact on improving healthcare. One of these solutions can be generative AI, which provides interesting results that healthcare professionals can consider in personalized diagnosis and propose more effective treatment, prioritizing their own judgment.
On the other hand, the digitization of healthcare systems is already a reality, including 3D printing, digital twins applied to medicine, telemedicine consultations, or portable medical devices. In this context, the collaboration and sharing of medical data, provided their protection is ensured, contribute to promoting research and innovation in the sector. In other words, open data initiatives for medical research stimulate technological advancements in healthcare.
Therefore, the FISABIO Foundation, together with the Prince Felipe Research Center, where the platform hosting BIMCV is located, stands out as an exemplary case in promoting the openness and sharing of data in the field of medicine. As the digital age progresses, it is crucial to continue promoting data openness and encouraging its responsible use in medical research, for the benefit of society.
Blog
Python, R, SQL, JavaScript, C++, HTML... Nowadays we can find a multitude of programming languages that allow us to develop software programmes, applications, web pages, etc. Each one has unique characteristics that differentiate it from the rest and make it more appropriate for certain tasks. But how do we know when and where to use each language? In this article we give you some clues.
Types of programming languages
Programming languages are syntactic and semantic rules that allow us to execute a series of instructions. Depending on their level of complexity, we can speak of different levels:
- Low-level languages: they use basic instructions that are directly interpreted by the machine and are difficult for humans to understand. They are custom-designed for each hardware and cannot be migrated, but they are very efficient, as they make the most of the characteristics of each machine.
- High-level languages: they use clear instructions using natural language, which is more understandable by humans. These languages emulate our way of thinking and reasoning, but must then be translated into machine language through translators/interpreters or compilers. They can be migrated and are not hardware-dependent.
Medium-level languages are sometimes also described as languages that, although they function like a low-level language, allow some abstract machine-independent handling.
The most widely used programming languages
In this article we are going to focus on the most used high-level languages in data science. To do so, we look at this survey, conducted by Anaconda in 2021, and the article by KD Nuggets.
How often are the following programming languages used?
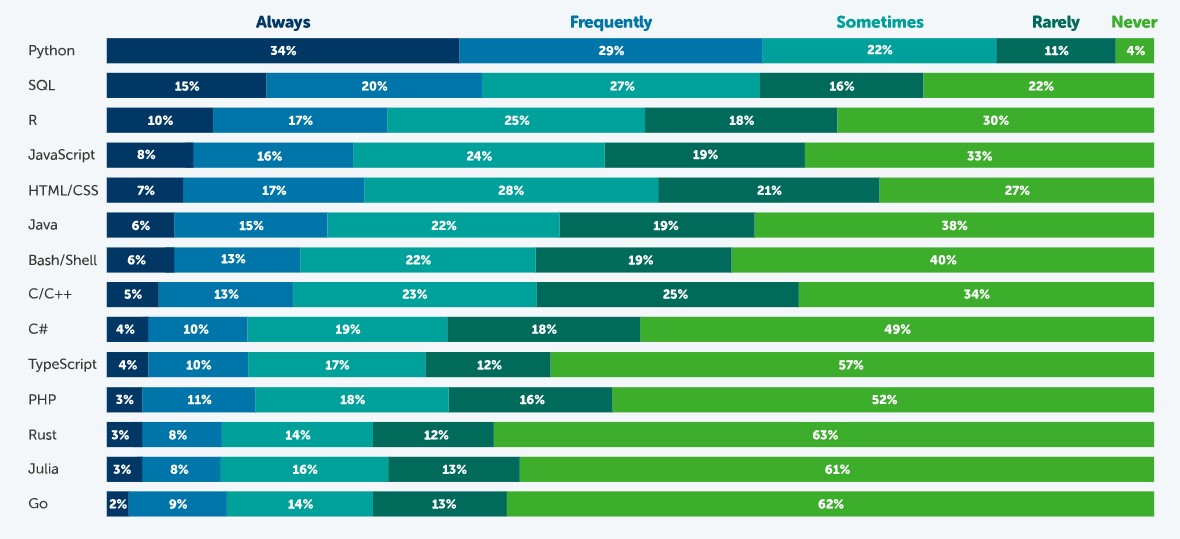
Source: State of Data Science in 2021, Anaconda.
According to this survey, the most popular language is Python. 63% of respondents - 3,104 data scientists, researchers, students and data professionals from around the world - indicated that they use Python always or frequently and only 4% indicated that they never use it. This is because it is a very versatile language, which can be used in the various tasks that exist throughout a data science project.
A data science project has different phases and tasks. Some languages can be used to perform different tasks, but with unequal performance. The following table, compiled by KD Nuggets, shows which language is most recommended for some of the most popular tasks:
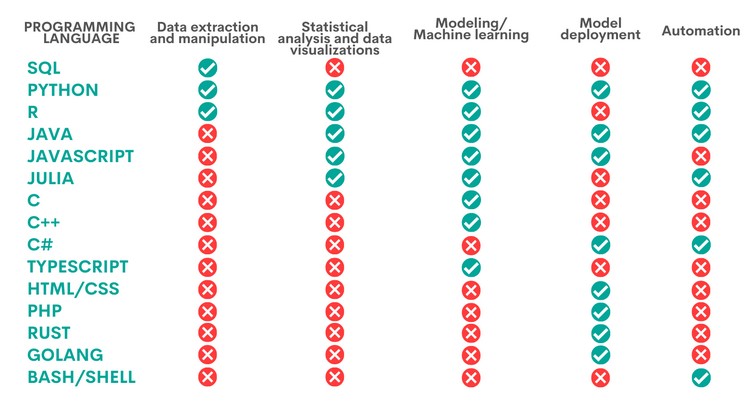
Source: Data Science Programming Languages and When To Use Them, KD Nuggets, 2022.
As we can see, Python is the only language that is appropriate for all the areas analysed by KD Nuggets, although there are other options that are also very interesting, depending on the task to be carried out, as we will see below:
- Languages for data extraction and manipulation. These tasks are aimed at obtaining the data and debugging them in order to achieve a homogeneous structure, without incomplete data, free of errors and in the right format. For this purpose, it is recommended to perform an Exploratory Data Analysis. SQL is the programming language that excels the most with respect to data extraction, especially when working with relational databases. It is fast at retrieving data and has a standardised syntax, which makes it relatively simple. However, it is more limited when it comes to data manipulation. A task in which Python and R, two programs that have a large number of libraries for these tasks, give better results.
- Statistical analysis and data visualisation. This involves processing data to find patterns that are then converted into knowledge. There are different types of analysis depending on their purpose: to learn more about our environment, to make predictions or to obtain recommendations. The best language for this is R, an interpreted language that also has a programming environment, R-Studio, and a set of very flexible and versatile tools for statistical computing. Python, Java and Julia are other tools that perform well in this task, for which JavaScript can also be used. The above languages allow, in addition to performing analyses, the creation of graphical visualisations that facilitate the understanding of the information.
- Modelling/machine learning (ML). If we want to work with machine learning and build algorithms, Python, Java, Java/JavaScript, Julia and TypeScript are the best options. All of them simplify the task of writing code, although it is necessary to have extensive knowledge to be able to work with the different machine learning techniques. More experienced users can work with C/C++, a very machine-readable programming language, but with a lot of code, which can be difficult to learn. In contrast, R can be a good choice for less experienced users, although it is slower and not well suited for complex neural networks.
- Model deployment. Once a model has been created, it is necessary to deploy it, taking into account all the necessary requirements for its entry into production in a real environment. For this purpose, the most suitable languages are Python, Java, JavaScript and C#, followed by PHP, Rust, GoLang and, if we are working with basic applications, HTML/CSS.
- Automation. While not all parts of a data scientist's job can be automated, there are some tedious and repetitive tasks whose automation speeds up performance. Python, for example, has a large number of libraries for automating machine learning tasks. If we are working with mobile applications, then Java is our best option. Other options are C# (especially useful for automating model building), Bash/Shell (for data extraction and manipulation) and R (for statistical analysis and visualisations).
Ultimately, the programming language we use will depend entirely on the task at hand and our capabilities. Not all data science professionals need to know all languages, but should choose the one that is most appropriate for their daily work.
Some additional resources to learn more about these languages
At datos.gob.es we have prepared some guides and resources that may be useful for you to learn some of these languages:
- Data processing and visualization tools
- Courses to learn more about R
- Courses to learn more about Python
- Online courses to learn more about data visualization
- R and Python Communities for Developer
Content prepared by the datos.gob.es team.
Blog
According to the latest analysis conducted by Gartner in September 2021, on Artificial Intelligence trends, Chatbots are one of the technologies that are closest to deliver effective productivity in less than 2 years. Figure 1, extracted from this report, shows that there are 4 technologies that are well past the peak of inflated expectations and are already starting to move out of the valley of disillusionment, towards states of greater maturity and stability, including chatbots, semantic search, machine vision and autonomous vehicles.
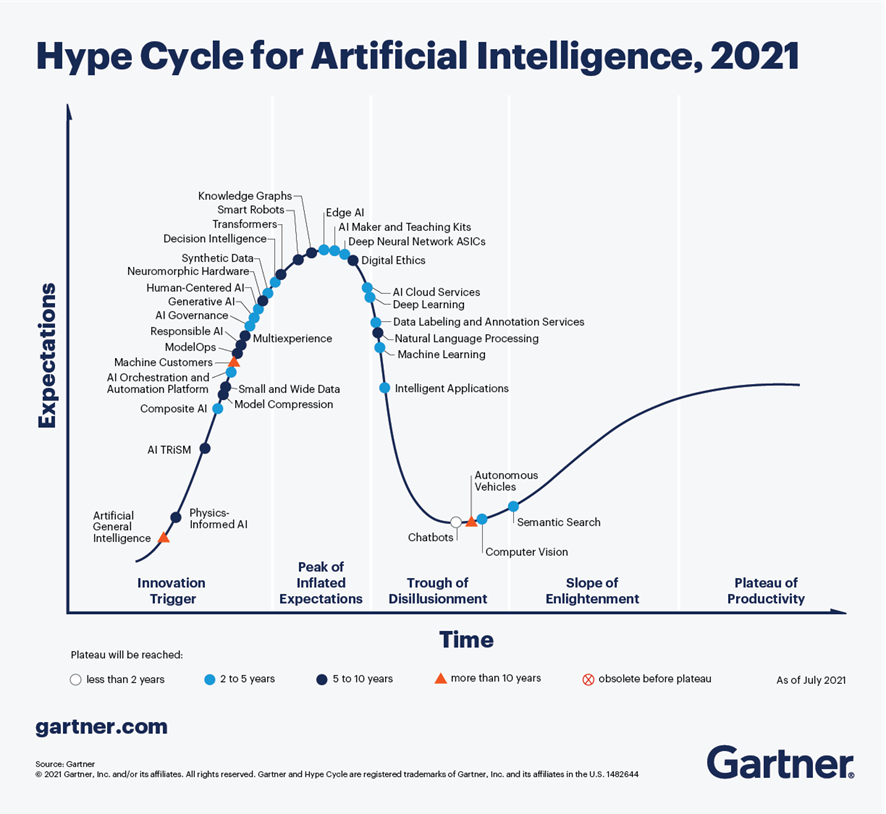
Figure 1-Trends in AI for the coming years.
In the specific case of chatbots, there are great expectations for productivity in the coming years thanks to the maturity of the different platforms available, both in Cloud Computing options and in open source projects, especially RASA or Xatkit. Currently it is relatively easy to develop a chatbot or virtual assistant without AI knowledge, using these platforms.
How does a chatbot work?
As an example, Figure 2 shows a diagram of the different components that a chatbot usually includes, in this case focused on the architecture of the RASA project.
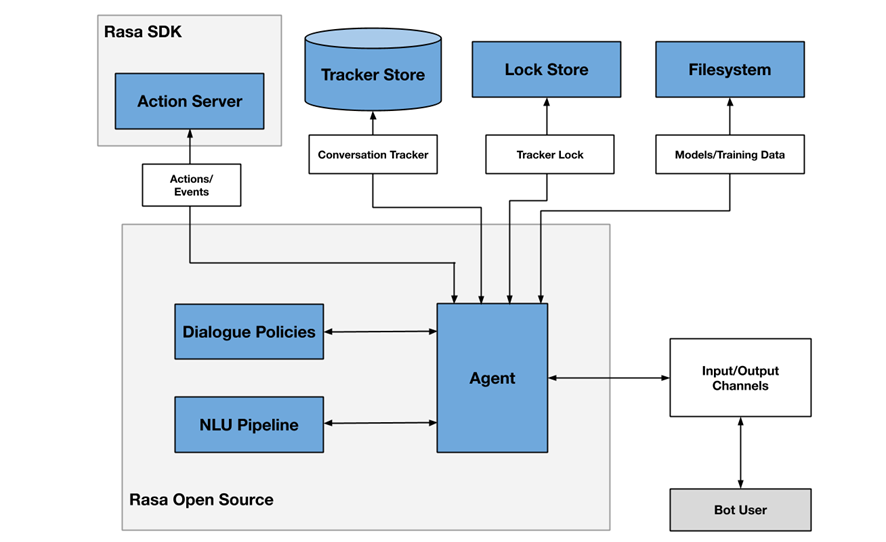
Figure 2- RASA project architecture
One of the main components is the agent module, which acts as a controller of the data flow and is normally the system interface with the different input/output channels offered to users, such as chat applications, social networks, web or mobile applications, etc.
The NLU (Natural Languge Understanding) module is responsible for identifying the user's intention (what he/she wants to consult or do), entity extraction (what he/she is talking about) and response generation. It is considered a pipeline because several processes of different complexity are involved, in many cases even through the use of pre-trained Artificial Intelligence models.
Finally, the dialogue policies module defines the next step in a conversation, based on context and message history. This module is integrated with other subsystems such as the conversation store (tracker store) or the server that processes the actions necessary to respond to the user (action server).
Chatbots in open data portals as a mechanism to locate data and access information
There are more and more initiatives to empower citizens to consult open data through the use of chatbots, using natural language interfaces, thus increasing the net value offered by such data. The use of chatbots makes it possible to automate data collection based on interaction with the user and to respond in a simple, natural and fluid way, allowing the democratization of the value of open data.
At SOM Research Lab (Universitat Oberta de Catalunya) they were pioneers in the application of chatbots to improve citizens' access to open data through the Open Data for All and BODI (Bots to interact with open data - Conversational interfaces to facilitate access to public data) projects. You can find more information about the latter project in this article.
It is also worth mentioning the Aragón Open Data chatbot, from the open data portal of the Government of Aragón, which aims to bring the large amount of data available to citizens, so that they can take advantage of its information and value, avoiding any technical or knowledge barrier between the query made and the existing open data. The domains on which it offers information are:
- General information about Aragon and its territory
- Tourism and travel in Aragon
- Transportation and agriculture
- Technical assistance or frequently asked questions about the information society.
Conclusions
These are just a few examples of the practical use of chatbots in the valorization of open data and their potential in the short term. In the coming years we will see more and more examples of virtual assistants in different scenarios, both in the field of public administrations and in private services, especially focused on improving user service in e-commerce applications and services arising from digital transformation initiatives.
Content prepared by José Barranquero, expert in Data Science and Quantum Computing.
The contents and points of view reflected in this publication are the sole responsibility of the author.
Evento
The pandemic situation we have experienced in recent years has led to a large number of events being held online. This was the case of the Iberian Conference on Spatial Data Infrastructures (JIIDE), whose 2020 and 2021 editions had a virtual format. However, the situation has changed and in 2022 we will be able to meet again to discuss the latest trends in geographic information.
Seville will host JIIDE 2022
Seville has been the city chosen to bring together all those professionals from the public administration, private sector and academia interested in geographic information and who use Spatial Data Infrastructures (SDI) in the exercise of their activities.
Specifically, the event will take place from 25 to 27 October at the University of Seville. You can find more information here.
Focus on user experience
This year's slogan is "Experience and technological evolution: bringing the SDI closer to citizens". The aim is to emphasise new technological trends and their use to provide citizens with solutions that solve specific problems, through the publication and processing of geographic information in a standardised, interoperable and open way.
Over three days, attendees will be able to share experiences and use cases on how to use Big Data, Artificial Intelligence and Cloud Computing techniques to improve the analysis capacity, storage and web publication of large volumes of data from various sources, including real-time sensors.
New specifications and standards that have emerged will also be discussed, as well as the ongoing evaluation of the INSPIRE Directive.
Agenda now available
Although some participations are still to be confirmed, the programme is already available on the conference website. There will be around 80 communications where experiences related to real projects will be presented, 7 technical workshops where specific knowledge will be shared and a round table to promote debate.
Among the presentations there are some focused on open data. This is the case of Valencia City Council, which will talk about how they use open data to obtain environmental equity in the city's neighbourhoods, or the session dedicated to the "Digital aerial photo library of Andalusia: a project for the convergence of SDIs and Open-Data".
How can I attend?
The event is free of charge, but to attend you need to register using this form. You must indicate the day you wish to attend.
For the moment, registration is open to attend in person, but in September, the website of the conference will offer the possibility of participating in the JIIDE virtually.
Organisers
The Jornadas Ibéricas de Infraestructuras de Datos Espaciales (JIIDE) were born from the collaboration of the Directorate General of Territory of Portugal, the National Geographic Institute of Spain and the Government of Andorra. On this occasion, the Institute of Statistics and Cartography of Andalusia and the University of Seville join as organisers.
Noticia
The coming days will see the beginning of a season of sun, heat, beach and, in many cases, more free time, which makes this season a perfect opportunity to expand our training on a wide variety of subjects, among which data, a cross-cutting subject in different sectors, cannot be missing.
There are an increasing number of courses related to Big Data, science, analytics and even data journalism that we find in the summer offers of training centres. There is a growing interest in further training in these subjects due to the high demand for professional profiles with these skills.
Whether you are a student or a working professional, here are some examples of summer courses that may be of great interest to broaden your knowledge during these weeks:
Data science
The University of Castilla-La Mancha is offering the course "Data science: impact on society" on 22 and 23 June at the Albacete campus, where the new ways of acquiring and using data resulting from advances in technology and artificial intelligence will be discussed.
This summer, the University of Deusto will offer online training on "Data analysis and applied machine learning". This course, which will begin on 27 June, will teach you to master the main technologies for analysing and processing large amounts of data, as well as some techniques to increase the value of the data analysed, promoting optimal decision-making.
The University of Alicante focuses on artificial intelligence with the course "Introduction to Deep Learning" from 11 to 15 July 2022, in classroom mode. The course will begin by explaining basic concepts and the use of basic and advanced packages such as NumPy, Pandas, scikit-learn or tf.Keras, and then continue to delve deeper into neural networks.
The University of Alcalá de Henares will talk about "Introduction to financial data science with R" in an on-site course from 20 to 24 June. The aim of the course is twofold: to familiarise students with the use of the statistical language and to show some of the techniques linked to advanced statistical calculation, as well as its practical applications.
Open data
The Complutense University of Madrid offers, once again this year, its course “Big & Open Data. Analysis and programming with R and Python” from 4 to 22 July 2022 (mornings from 9:00 to 14:00, Monday to Friday). The course will cover the data life cycle, examples of Big Data use cases and ethics applied to the management of massive data, among other topics.
Geographic Information Systems
If you are passionate about geographic data, the University of Santiago is offering the course "Introduction to geographic information systems and cartography with the R environment" from 5 to 8 July 2022. In classroom format and with 29 teaching hours, it aims to introduce students to spatial analysis, visualisation and working with raster and vector files. The main geostatistical interpolation methods will be covered during the course.
The University of Alcalá de Henares, for its part, will give the course "Applications of GIS to Hydrology", from 6 to 8 July, also in classroom format. This is a practical course that covers everything from the different sources of hydro-meteorological data to carrying out evapotranspiration and runoff analyses and obtaining results.
Data journalism
El Institut de Formació Contínua – IL3 de la Universitat de Barcelona organizará del 4 al 7 de julio de 2022 el curso online en castellano “Bulos y periodismo de datos”. Esta formación de 8 horas de duración te aportará los conocimientos necesarios para comprender, identificar y combatir el fenómeno de la desinformación. Además, conocerás las herramientas esenciales que se utilizan en el periodismo de datos, la verificación de datos (fact-checking) políticos y la investigación basada en peticiones de transparencia.
Data protection
The Menéndez Pelayo International University will hold a course on "Strategies for data protection in the face of the challenges of the digital environment" on 4, 5 and 6 July. The programme is aimed at students related to the business world, the provision of digital services, public administrations, researchers and those interested in the subject. “Smart-cities and personal data processing” or “the European Data Protection Committee and the European initiatives of the digital package” will be just some of the topics to be addressed in this course.
Another of the training courses related to data protection that will be given over the coming months will be "Are our data really ours? Risks and guarantees of personal data protection in digital societies". The International University of Andalusia will be responsible for giving this course, which will be held in person in Seville from 29 August, and which will address the current situation of personal data protection within the framework of the European Union. Through this training you will discover the benefits and risks involved in the processing of our personal data.
In addition to this specific summer training, those users who wish to do so can also go to the large MOOC course platforms, such as Coursera, EDX or Udacity, which offer interesting courses on a continuous basis so that any student can start learning whenever they need to.
These are just a few examples of courses that are currently open for enrolment this summer, although the offer is very wide and varied. Moreover, it should be noted that the summer has not yet begun and new training courses related to the field of data could emerge in the coming weeks. If you know of any other course that might be of interest, do not hesitate to leave us a comment below or write to us at contacto@datos.gob.es.
Blog
Over the last decade we have seen how national and international institutions, as well as national governments and business associations themselves have been warning about the shortage of technological profiles and the threat this poses to innovation and growth. This is not an exclusively European problem - and therefore also affects Spain – but, to a greater or lesser extent, it occurs all over the world, and has been further aggravated by the recent pandemic.
Anyone who has been working for some time, and not necessarily in the technology world, has been able to observe how the demand for technology-related roles has been increasing. It's nothing more than the consequence of companies around the world investing heavily in digitization to improve their operations and innovate their products, along with the growing presence of technology in all aspects of our lives.
And within technology professionals, during the last few years there is a group that has become a kind of unicorn due to its particular scarcity, data scientists and the rest of professionals related to data and artificial intelligence: data engineers, machine learning engineers, artificial engineering specialists in all areas, from data governance to the very configuration and deployment of deep learning models, etc.
This scenario is especially problematic for Spain where salaries are less competitive than in other countries in our environment and where, for starters, the proportion of IT workers is below the EU average. Therefore, it is foreseeable that Spanish companies and public administrations, which are also implementing projects of this type, will face increasing difficulties in recruiting and retaining talent related to technology in general, and data and artificial intelligence in particular.
When there is a supply problem, the only sustainable solution in the medium and long term is to increase the production of what is in short supply. In this case, the solution would be to incorporate new professionals into the labour market as the only mechanism to ensure a better balance between supply and demand. And this is recognized in all national and European strategies and plans related to digitalization, artificial intelligence and the reform of education systems, both higher education and vocational training.
Spanish Strategies
The National Artificial Intelligence Strategy dedicates one of its axes to the promotion of the development of digital skills with the aim of putting in place all the means to ensure that workers have an adequate mastery of digital skills and capabilities to understand and develop Artificial Intelligence technologies and applications. The Spanish government has planned a wide range of education and training policies whose basis is the National Digital Skills Plan, published in January 2021 and aligned with the Digital Agenda 2025.
This plan includes data analytics and artificial intelligence as cutting-edge technological areas within specialized digital skills, that is, "necessary to meet the labor demand for specialists in digital technologies: people who work directly in the design, implementation, operation and/or maintenance of digital systems".
In general, the national strategy presents policy actions on education and digital skills for the entire population throughout their lives. Although in many cases these measures are still in the planning phase and will see a major boost with the deployment of NextGenerationEU funds, we already have some pioneering examples such as the training and employment guidance programs for unemployed and young people tendered last year and recently awarded. In the case of training for unemployed people, actions such as the Actualízate program and the training project for the acquisition of skills for the digital economy are already underway. The actions awarded that are aimed at young people are scheduled to start in the first quarter of 2022. In both cases the objective is to provide free training actions aimed at the acquisition and improvement of ICT skills, personal skills and employability, in the field of transformation and the digital economy, as well as orientation and job placement. Among these ICT skills, those related to data and artificial intelligence will undoubtedly have an important weight in the training programs.
The role of universities
On the other hand, universities around the world, and of course Spanish universities, have been adapting curricula and creating new training programs related to data and artificial intelligence for some time now. The first to adapt to the demand was postgraduate training, which, within the higher education system, is the most flexible and quickest to implement. The first batch of professionals with specific training in data and artificial intelligence came from diverse disciplines. As a result, among the veterans of corporate data teams we can find different STEM disciplines, from mathematics and physics to virtually any engineering. In general, what these pioneers had in common was to have taken Masters in Big Data, data science, data analytics, etc. complemented with non-regulated training through MOOCs.
Currently, the first professionals who have completed the first degrees in data science or data engineering, which were reformed by the pioneering universities - but which are now already implemented in many Spanish universities - are beginning to reach the labor market. These professionals have a very high degree of adaptation to the current needs of the labor market, so they are in great demand among companies.
For universities, the main pending challenge is for university curricula in any discipline to include knowledge to work with data and to understand how data supports decision making. This will be vital to support the EU target of 70% of adults having basic digital skills by 2025.
Large technology companies developing talent
An idea of the size of the problem posed by the shortage of these skills for the global economy is the involvement of technology giants such as Google, Amazon or Microsoft in its solution. In recent years we have seen how practically all of them have launched large-scale free materials and programs to certify personnel in different areas of technology, because they see it as a threat to their own growth, even though they are not exactly the ones having the greatest difficulty in recruiting the scarce existing talent. Their vision is that if the rest of the companies are not able to keep up with the pace of digitalization this will cause their own growth to suffer and that is why they invest heavily in certification programs beyond their own technologies, such as Google's IT Support Professional Certificate or AWS's Specialized Program: Modern Application Development with Python.
Other multinational companies are addressing the talent shortage by retraining their employees in analytics and artificial intelligence skills. They are following different strategies to do this, such as incentivizing their employees to take MOOCs or creating tailored training plans with specialized providers in the education sector. In some cases, employees in non-data related roles are also encouraged to participate in data science training, such as data visualization or data analytics.
Although it will take time to see their effects due to the high inertia of all these measures, they are certainly going in the right direction to improve the competitiveness of companies that need to keep up with the high global pace of innovation surrounding artificial intelligence and everything related to data. For their part, professionals who know how to adapt to this demand will experience a sweet moment in the coming years and will be able to choose which projects to commit to without worrying about the difficulties that, unfortunately, affect employment in other areas of knowledge and sectors of activity.
Content prepared by Jose Luis Marín, Senior Consultant in Data, Strategy, Innovation & Digitalization.
The contents and views reflected in this publication are the sole responsibility of the author.
Blog
The profession of the data scientist is booming. According to him 2020 LinkedIn Emerging Jobs Report, the demand for data science specialists grew 46.8% compared to the previous year, being especially demanded in sectors such as banking, telecommunications or research. The report also indicates that among the capabilities that companies demand are "Machine Learning, R, Apache Spark, Python, Data Science, Big Data, SQL, Data Mining, Statistics and Hadoop." Training ourselves in this type of tools and capabilities is therefore a notable competitive advantage in the workplace.
In this context, it is not surprising that the university offer in these subjects does not stop growing. But at the same time there are also alternatives that allow us to expand our knowledge in a playful way.
Gamification to learn data science
One of the best ways to learn new skills is through play. The resolution of challenges and real cases allows us to test our knowledge and exercise new skills in an entertaining and motivating way. It is what is known as gamification, a learning technique that applies elements of game design to non-playful contexts. In this case we are talking about learning, but it can also be applied to marketing or even sectors like health and welfare, among others.
Gamification is a perfect technique for acquiring data-related capabilities, revealed through competitions such as hackathons or application and idea contests - like our Challenge Contribute -. But in recent years, online platforms that propose open competitions in the form of challenges to users have also grown.
Kaggle, a space for open competitions
Of all these platforms, the best known is Kaggle, which brings together more than 7 million registered users from around the world. It is a free platform that provides users with problems to solve using data science, predictive analytics or machine learning techniques, among others.
There are problems for beginners, like predict survival on the Titanic -a binary classification problem- or house prices, for which it is necessary to use advanced regression techniques. Some competitions start directly from companies that seek to solve a challenge that resists them and choose to open it up to platform users, as did the Santander Bank. Occasionally, there can be large cash prizes for the user who finds the best solution. An example is the american football league, which seeks to predict blows against players' helmets and awards $ 100,000 to whoever succeeds. There are also companies that specifically create contests in which the winners have the opportunity for an interview with their data science team, as did Facebook, a few years ago. Kaggle is therefore a good formula to expand the possibilities of finding a good job. Many recruiters keep their eye on the platform when it comes to locating new talent, paying particular attention to the winners of the competitions.
In addition to competitions, Kaggle offers other functionalities:
- A section to share datasets. There are currently more than 50,000 shared public data sets, which can be freely used to practice, solve competitions or train algorithms.
- Free courses, which cover topics such as Python, introduction to machine learning, geospatial analysis or natural language processing. They are designed to quickly introduce the user to essential topics and guide them through the Kaggle platform. Once you have the basic knowledge, it is time to participate in competitions.
- Notebooks, shared by Kaggle users. This is the code, along with tutorials, that the participants in the competitions have used to solve different problems. There are currently more than 500,000. In order to run and practice them, Kaggle has a computational environment designed to facilitate the reproduction of data science work.
- A discussion forum, where to solve doubts and share feedback. By signing up for Kaggle, you not only gain numerous resources, but you also become part of a community of experts. Being present in the forum is key to expanding knowledge and meeting other users, making a team and enriching yourself with the experience of those who master the subject in question.
Kaggle uses a progression system with different types of user, according to their level of performance in each area. On the one hand, there are 5 levels of performance: Novice, Contributor, Expert, Master and Grandmaster. On the other, four categories of experience in data science from Kaggle: Competitions, Notebooks, Datasets and Discussion, which refer to user participation in each area. Progress through the performance levels is done independently within each experience category, so that the same user can be a Master in Competitions, but Novice in Discussion.
The success of Kaggle is so great that in 2017 it was acquired by Google.
If you are thinking of participating in a competition, you have some tips in this post, video and presentation.
Other platforms similar to Kaggle
In addition to Kaggle, we also find other similar platforms on the web that host competitions and challenges related to data.
- DrivenData. Organize online challenges, which usually last between 2 and 3 months, some of them with financial prizes. An example of competition is the construction of machine learning algorithms capable of mapping floods using satellite images of Sentinel-1. They also have a datalab where they offer companies their services to build solutions related to data.
- Devpost. It offers a repository of hackathons that users can sign up to, most of them online. Includes company competitions such as Amazon or Microsoft. Some competition accumulates up to $ 5 million to distribute in prizes.
- Innocentive. Collect challenges from various organizations - some also with large prize figures. Although it has technical competitions, it also includes theoretical or strategic challenges in which only a theoretical proposal is necessary.
- CrowdAnalytix. With more than 25,000 users, crowdAnalytix is a community where data experts collaborate and compete to customize and optimize algorithms. An example is this competition, where the evolution of crops had to be predicted using public satellite images.
A good profile on Kaggle, or on the rest of the platforms that we have seen, will help you gain more experience and create a good portfolio of work. It will also make you more attractive to recruiters, increasing your chances of landing a good job. A good performance at Kaggle demonstrates problem-solving and teamwork skills, which are some of the characteristics necessary to become a good data scientist.
Content prepared by the datos.gob.es team.
Blog
The world of technology and data is constantly evolving. Keeping up with the latest developments and trends can be a difficult task. Therefore, spaces for dialogue where knowledge, doubts and recommendations can be shared are important.
What are communities?
Communities are open channels through which different people interested in the same subject or technology meet physically or virtually to contribute, ask questions, discuss and resolve issues related to that technology. They are commonly created through an online platform, although there are communities that organise regular meetings and events where they share experiences, establish objectives and strengthen the bonds created through the screen.
How do they work?
Many developer communities use open source platforms known as GitHub or Stack Overflow, through which they store and manage their code, as well as share and discuss related topics.
Regarding how they are organised, not all communities have an organisational chart as such, some do, but there is no parameter that governs the organisation of communities in general. However, there may be roles defined according to the skills and knowledge of each of their members.
Developer communities as data reusers
There are a significant number of communities that bring knowledge about data and its associated technologies to different user groups. Some of them are made up of developers, who come together to expand their skills through webinars, competitions or projects. Sometimes these activities help drive innovation and transformation in the world of technology and data, and can act as a showcase to promote the use of open data.
Here are three examples of data-related developer communities that may be of interest to you if you want to expand your knowledge in this field:
Hackathon Lovers
Since its creation in 2013, this community of developers, designers and entrepreneurs who love hackathons have been organising meetings to test new platforms, APIs, products, hardware, etc. Among its main objectives is to create new projects and learn, while users have fun and strengthen ties with other professionals.
The topics they address in their events are varied. In the #SerchathonSalud hackathon, they focused on promoting training and research in the field of health based on bibliographic searches in 3 databases (PubMed, Embase, Cochrane).). Other events have focused on the use of specific APIs. This is the case of #OpenApiHackathon, a development event on Open Banking and #hackaTrips, a hackathon to find ideas on sustainable tourism.
Through which channels can you follow their news?
Hackathon Lovers is present in the main social networks such as Twitter and Facebook, as well as YouTube, Github, Flickr and has its own blog.
Comunidad R Hispano
It was created in November 2011, as part of the 3rd R User Conference held at the Escuela de Organización Industrial in Madrid. Organised through local user groups, its main objective is to promote the advancement of knowledge and use of the R programming language, as well as the development of the profession in all its aspects, especially research, teaching and business.
One of its main fields is the training of R and associated technologies for its users, in which open data has a place. With regard to the activities they carry out, there are events such as:
- Annual conferences: so far there have been eleven editions based on talks and workshops with attendees with R software as the protagonist.
- Local initiatives: although the association is the main promoter of the annual conferences, the feeling of community is forged thanks to local groups such as those in Madrid, sponsored by RConsortium, the Canary Islands, which communicates aspects such as public and geographic data, or Seville, which during its latest hackathons has developed several packages linked to open data.
- Collaboration with groups and initiatives focused on data: such as UNED, Grupo de Periodismo de Datos, Grupo Machine Learning Spain or companies such as Kabel or Kernel Analytics.
- Collaboration with Spanish academic institutions: such as EOI, Universidad Francisco de Vitoria, ESIC, or K-School, among others.
- Relationship with international institutions: such as RConsortium or RStudio.
- Creation of data-centric packages in Spain: participation in ROpenSpain, an initiative for R and open data enthusiasts aimed at creating top quality R packages for the reuse of Spanish data of general interest.
Through which channels can you follow their news?
This community is made up of more than 500 members. The main communication channel for contacting its users is Twitter, although its local groups have their own accounts, as is the case in Malaga, the Canary Islands and Valencia, among others.
R- Ladies Madrid
R-Ladies Madrid is a local branch of R-Ladies Global -a project funded by the R Consortium-Linux Foundation- born in 2016. It is an open source community developed by women who support each other and help each other grow within the R sector.
The main activity of this community lies in the celebration of monthly meetings or meet ups where female speakers share knowledge and projects they are working on, or teach functionalities related to R. Its members range from professionals who have R as their main working tool to amateurs who are looking to learn and improve their skills.
R-Ladies Madrid is very active within the software community and supports different technological initiatives, from the creation of open source working groups to its participation in different technological events. In some of their working groups they use open data from sources such as the BOE or Open Data NASA. In addition, they have also helped to set up a working group with data on Covid-19. In previous years they have organised gender hackathons where all participating teams were made up of 50% women and proposed to work with data from non-profit organisations.
Through which channels can you follow their news?
R – Ladies Madrid is present on Twitter, as well as having a Meetup group.
This has been a first approximation, but there are more communities of developers related to the world of data in our country. These are essential not only to bring theoretical and technical knowledge to users, but also to promote the reuse of public data through various projects like the ones we have seen. Do you know of any other organisation with similar aims? Do not hesitate to write to us at dinamizacion@datos.gob.es or leave us all the information in the comments.
Blog
A few weeks ago, we told you about the different types of machine learning through a series of examples, and we analysed how to choose one or the other based on our objectives and the datasets available to train the algorithm.
Now let's assume that we have an already labelled dataset and we need to train a supervised learning model to solve the task at hand. At this point, we need some mechanism to tell us whether the model has learned correctly or not. That is what we are going to discuss in this post, the most used metrics to evaluate the quality of our models.
Model evaluation is a very important step in the development methodology of machine learning systems. It helps to measure the performance of the model, that is, to quantify the quality of the predictions it offers. To do this, we use evaluation metrics, which depend on the learning task we apply. As we saw in the previous post, within supervised learning there are two types of tasks that differ, mainly, in the type of output they offer:
- Classification tasks, which produce as output a discrete label, i.e. when the output is one within a finite set.
- Regression tasks, which output a continuous real value.
Here are some of the most commonly used metrics to assess the performance of both types of tasks:
Evaluation of classification models
In order to better understand these metrics, we will use as an example the predictions of a classification model to detect COVID patients. In the following table we can see in the first column the example identifier, in the second column the class predicted by the model, in the third column the actual class and the fourth column indicates whether the model has failed in its prediction or not. In this case, the positive class is "Yes" and the negative class is "No".

Examples of evaluation metrics for classification model include the following:
- Confusion matrix: this is a widely used tool that allows us to visually inspect and evaluate the predictions of our model. Each row represents the number of predictions of each class and the columns represent the instances of the actual class.
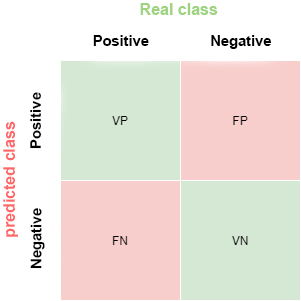
The description of each element of the matrix is as follows:
True Positive (VP): number of positive examples that the model predicts as positive. In the example above, VP is 1 (from example 6).
False positive (FP): number of negative examples that the model predicts as positive. In our example, FP is equal to 1 (from example 4).
False negative (FN): number of positive examples that the model predicts as negative. FN in the example would be 0.
True negative (VN): number of negative examples that the model predicts as negative. In the example, VN is 8.
- Accuracy: the fraction of predictions that the model made correctly. It is represented as a percentage or a value between 0 and 1. It is a good metric when we have a balanced dataset, that is, when the number of labels of each class is similar. The accuracy of our example model is 0.9, since it got 9 predictions out of 10 correct. If our model had always predicted the "No" label, the accuracy would be 0.9 as well, but it does not solve our problem of identifying COVID patients.
- Recall: indicates the proportion of positive examples that are correctly identified by the model out of all actual positives. That is, VP / (VP + FN). In our example, the sensitivity value would be 1 / (1 + 0) = 1. If we were to evaluate with this metric, a model that always predicts the positive label ("Yes") would have a sensitivity of 1, but it would not be a very intelligent model. Although the ideal for our COVID detection model is to maximise sensitivity, this metric alone does not ensure that we have a good model.
- Precision: this metric is determined by the fraction of items correctly classified as positive among all items that the model has classified as positive. The formula is VP / (VP + FP). The example model would have an accuracy of 1 / (1 + 1) = 0.5. Let us now return to the model that always predicts the positive label. In that case, the accuracy of the model is 1 / (1 + 9) = 0.1. We see how this model had a maximum sensitivity, but has a very poor accuracy. In this case we need both metrics to evaluate the real quality of the model.
- F1 score: combines the Precision and Recall metrics to give a single score. This metric is the most appropriate when we have unbalanced datasets. It is calculated as the harmonic mean of Precision and Recall. The formula is F1 = (2 * precision * recall) / (precision + recall). You may wonder why we use the harmonic mean and not the simple mean. This is because the harmonic mean means that if one of the two measurements is small (even if the other is maximum), the value of F1 score is going to be small.
Evaluation of regression models
Unlike classification models, in regression models it is almost impossible to predict the exact value, but rather to be as close as possible to the real value, so most metrics, with subtle differences between them, are going to focus on measuring that: how close (or far) the predictions are from the real values.
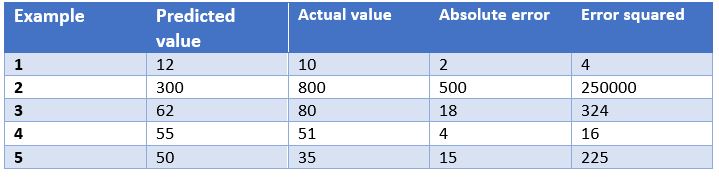
In this case, we have as an example the predictions of a model that determines the price of watches depending on their characteristics. In the table we show the price predicted by the model, the actual price, the absolute error and the squared error.
Some of the most common evaluation metrics for regression models are:
- Mean Absolute Error: This is the mean of the absolute differences between the target and predicted values. Since it is not squared, it does not penalise large errors, which makes it not very sensitive to outliers, so it is not a recommended metric in models where attention must be paid to outliers. This metric also represents the error on the same scale as the actual values. Ideally, its value should be close to zero. For our watch pricing model, the mean absolute error is 107.8.
- Mean Squared Errors: One of the most commonly used measures in regression work. It is simply the mean of the differences between the target and the predicted value squared. By squaring the errors, it magnifies large errors, so use it with care when we have outliers in our data set. It can take values between 0 and infinity. The closer the metric is to zero, the better. The mean square error of the example model is 50113.8. We see how in the case of our example large errors are magnified.
- Root Mean Squared Srror: This is equal to the square root of the previous metric. The advantage of this metric is that it presents the error in the same units as the target variable, which makes it easier to understand. For our model this error is equal to 223.86.
- R-squared: also called the coefficient of determination. This metric differs from the previous ones, as it compares our model with a basic model that always returns as prediction the mean of the training target values. The comparison between these two models is made on the basis of the mean squared errors of each model. The values this metric can take range from minus infinity to 1. The closer the value of this metric is to 1, the better our model is. The R-squared value for the model will be 0.455.
- Adjusted R-squared. An improvement of R-squared. The problem with the previous metric is that every time more independent variables (or predictor variables) are added to the model, R-squared stays the same or improves, but never gets worse, which can be confusing, because just because one model uses more predictor variables than another, it does not mean that it is better. Adjusted R-squared compensates for the addition of independent variables. The adjusted R-squared value will always be less than or equal to the R-squared value, but this metric will show improvement when the model is actually better. For this measure we cannot do the calculation for our example model because, as we have seen before, it depends on the number of examples and the number of variables used to train such a model.
Conclusion
When working with supervised learning algorithms it is very important to choose a correct evaluation metric for our model. For classification models it is very important to pay attention to the dataset and check whether it is balanced or not. For regression models we have to consider outliers and whether we want to penalise large errors or not.
Generally, however, the business domain will guide us in the right choice of metric. For a disease detection model, such as the one we have seen, we are interested in high sensitivity, but we are also interested in a good accuracy value, so F1-score would be a smart choice. On the other hand, in a model to predict the demand for a product (and therefore production), where overstocking may incur a storage cost overrun, it may be a good idea to use the mean squared errors to penalise large errors.
Content elaborated by Jose Antonio Sanchez, expert in Data Science and enthusiast of the Artificial Intelligence.
Contents and points of view expressed in this publication are the exclusive responsibility of its author.