Application
Incendio Hoy is a web viewer that shows in near real time the active fires in Spain based on open data from NASA FIRMS (VIIRS and MODIS sensors). The app automatically queries and updates the detections (hootspots) with a cadence of minutes and represents them on an interactive map of simple controls. The user can filter by time range (up to five days), reliability level (low/medium/high) and FRP (radiative fire power, in MW) to focus on the most relevant events. Clicking on a point displays a tab with coordinates, date/time, sensor, current (FRP), and other details. In addition, it includes optional temperature and cloud cover layers, and a heat map to identify clusters.
The website incorporates a "Frequently Asked Questions" section that explains key concepts, such as differences between VIIRS and MODIS, what FRP is, the level of reliability, why the fire may not appear or the limits of satellite detection.
Blog
Satellite data has become a fundamental tool for understanding and monitoring our planet from a unique perspective. This data, collected by satellites in orbit around the Earth, provides a global and detailed view of various terrestrial, maritime and atmospheric phenomena that have applications in multiple sectors, such as environmental care or driving innovation in the energy sector.
In this article we will focus on a new sector: the field of fisheries, where satellite data have revolutionised the way fisheries are monitored and managed worldwide. We will review which fisheries satellite data are most commonly used to monitor fishing activity and look at possible uses, highlighting their relevance in detecting illegal activities.
The most popular fisheries-related satellite data: positioning data
Among the satellite data, we find a large amount ofpublic and open data , which are free and available in reusable formats, such as those coming from the European Copernicus programme. This data can be complemented with other data which, although also public, may have costs and restrictions on use or access. This is because obtaining and processing this data involves significant costs and requires purchasing from specialised suppliers such as ORBCOMM, exactEarth, Spire Maritime or Inmarsat. To this second type belong the data from the two most popular systems for obtaining fisheries data, namely:
- Automatic Identification System (AIS): transmits the location, speed and direction of vessels. It was created to improve maritime safety and prevent collisions between vessels, i.e. its aim was to prevent accidents by allowing vessels to communicate their position and obtain the location of other ships in real time. However, with the release of satellite data in the 2010s, academia and authorities realised that they could improve situational awareness by providing information about ships, including their identity, course, speed and other navigational data. AIS data went on to facilitate maritime traffic management, enabling coastal authorities and traffic centres to monitor and manage the movement of vessels in their waters. This technology has revolutionised maritime navigation, providing an additional layer of safety and efficiency in maritime operations. Data is available through websites such as MarineTraffic or VesselFinder, which offer basic tracking services for free, but require a subscription for advanced features..
- Vessel Monitoring System (VMS): designed specifically for fisheries monitoring, it provides position and movement data. It was created specifically for the monitoring and management of the modern fishing industry. Its development emerged about two decades ago as a response to the need for improved monitoring, control and surveillance of fishing activities. Access to VMS data varies according to jurisdiction and international agreements. The data are mainly used by government agencies, regional fisheries management organisations and surveillance authorities, who have restricted access and must comply with strict security and confidentiality regulations.The data are used mainly by government agencies, regional fisheries management organisations and surveillance authorities, who have restricted access and must comply with strict security and confidentiality regulations.. On the other hand, fishing companies also use VMS systems to manage their fleets and comply with local and international regulations.
Analysis of fisheries satellite data
Satellite data has proven to be particularly useful for fisheries observation, as it can provide both an overview of a marine area or fishing fleet, as well as the possibility of knowing the operational life of a single vessel. The following steps are usually followed:
- AIS and VMS data collection.
- Integration with other open or private sources. For example: ship registers, oceanographic data, delimitations of special economic zones or territorial waters.
- Application of machine learning algorithms to identify behavioural patterns and fishing manoeuvres.
- Visualisation of data on interactive maps.
- Generation of alerts on suspicious activity (for real-time monitoring).
Use cases of fisheries satellite data
Satellite fisheries data offer cost-effective options, especially for those with limited resources to patrol their waters to continuously monitor large expanses of ocean. Among other activities, these data make possible the development of systems that allow:
- Monitoring of compliance with fishing regulations, as satellites can track the position and movements of fishing vessels. This monitoring can be done with historical data, in order to perform an analysis of fishing activity patterns and trends. This supports long-term research and strategic analysis of the fisheries sector.
- The detection of illegal fishing, using both historical and real-time data. By analysing unusual movement patterns or the presence of vessels in restricted areas, possible illegal, unreported and unregulated (IUU) fishing activities can be identified. IUU fishing is worth up to US$23.5 billionper year in seafood products.
- The assessment of the fishing volume, with data on the carrying capacity of each vessel and the fish transhipments that take place both at sea and in port.
- The identification of areas of high fishing activity and the assessment of their impact on sensitive ecosystems.
A concrete example is work by the Overseas Development Institute (ODI), entitled "Turbid Water Fishing", which reveals how satellite data can identify vessels, determine their location, course and speed, and train algorithms, providing unprecedented insight into global fishing activities. The report is based on two sources: interviews with the heads of various private and public platforms dedicated to monitoring IUU fishing, as well as free and open resources such as Global Fishing Watch (GFW) - an organisation that is a collaboration between Oceana, SkyTruth and Google - which provides open data.
Challenges, ethical considerations and constraints in monitoring fishing activity
While these data offer great opportunities, it is important to note that they also have limitations. The study "Fishing for data: The role of private data platforms in addressing illegal, unreported and unregulated fishing and overfishing", mentions the problems of working with satellite data to combat illegal fishing, challenges that can be applied to fisheries monitoring in general:
- The lack of a unified universal fishing vessel register. There is a lack of a single database of fishing vessels, which makes it difficult to identify vessels and their owners or operators. Vessel information is scattered across multiple sources such as classification societies, national vessel registers and regional fisheries management organisations.
- Deficient algorithms. Algorithms used to identify fishing behaviour are sometimes unable to accurately identify fishing activity, making it difficult to identify illegal activities. For example, inferring the type of fishing gear used, target species or quantity caught from satellite data can be complex.
- Most of this data is not free and can be costly. The most commonly used data in this field, i.e. data from AIS and VMS systems, are of considerable cost.
- Incomplete satellite data. Automatic Identification Systems (AIS) are mandatory only for vessels over 300 gross tonnes, which leaves out many fishing vessels. In addition, vessels can turn off their AIS transmitters to avoid surveillance.
- The use of these tools for surveillance, monitoring and law enforcement carries risks, such as false positives and spurious correlations. In addition, over-reliance on these tools can divert enforcement efforts away from undetectable behaviour.
- Collaboration and coordination between various private initiatives, such as Global Fishing Watch, is not as smooth as it could be. If they joined forces, they could create a more powerful data platform, but it is difficult to incentivise such collaboration between competing organisations.
The future of satellite data in fisheries
The field of satellite data is in constant evolution, with new techniques for capture and analysis improving the accuracy and utility of the information obtained. Innovations in geospatial data capture include the use of drones, LiDAR (light detection and ranging) and high-resolution photogrammetry, which complement traditional satellite data. In the field of analytics, machine learning and artificial intelligence are playing a crucial role. For example, Global Fishing Watch uses machine learning algorithms to process millions of daily messages from more than 200,000 fishing vessels, allowing a global, real-time view of their activities.
The future of satellite data is promising, with technological advances offering improvements in the resolution, frequency, volume, quality and types of data that can be collected. The miniaturisation of satellites and the development of microsatellite constellations are improving access to space and the data that can be obtained from it.
In the context of fisheries, satellite data are expected to play an increasingly important role in the sustainable management of marine resources. Combining these data with other sources of information, such as in situ sensors and oceanographic models, will allow a more holistic understanding of marine ecosystems and the human activities that affect them.
Content prepared by Miren Gutiérrez, PhD and researcher at the University of Deusto, expert in data activism, data justice, data literacy and gender disinformation. The contents and views reflected in this publication are the sole responsibility of the author.
Noticia
Today, transparency, innovation and economic development are key to the progress of public institutions. In this context, the Cabildo of Tenerife has undertaken an ambitious open data project that goes beyond the mere publication of information. The aim of this strategy is to ffacilitate access to information, encourage the reuse of data and generate social and economic value for the island.
Through its open data portal, the Cabildo not only promotes transparency and accountability, but also drives innovation in areas as diverse as tourism, transport and the rural environment.
Scope and objectives of the project
The open data portal of the Cabildo de Tenerife publishes datasets of the entire public sector of the island, including all the local councils of the island. In particular, this includes municipalities with less than 20,000 inhabitants, as established in Law 8/2015 on Island Councils. The main objectives of this project are:
- Strengthen the internal and external culture of data use.
- Increase transparency and accountability through data.
- Generate wealth in society through the reuse of information.
In this website you can find open datasets on tourism, transport, culture and leisure and rural environment, among others. In order to offer this information the Cabildo of Tenerife benefits from the collaboration of various bodies such as:
- Transportes Interurbanos de Tenerife (TITSA)
- Tenerife Island Water Board (CIATF)
- Metropolitan of Tenerife
- SINPROMI (Insular Society for the Promotion of People with Disabilities)
- ITER (Technological Institute of Renewable Energies)
- IASS (Insular Institute for Social and Socio-sanitary Care)
- Agrocabildo
Most downloaded and significant datasets
Some of the portal's most downloaded and significant datasets include:
- Network of weather stations, with updates every 10 minutes.
- Influx of recreational areas, such as Punta Teno and Barranco de Masca, with information on the number of vehicles and people, and the itineraries of trails or routes on the island.
- Indicators of economic development and tourist occupancy, including the number of tourists accommodated by category and area.
- Prices of fruit and vegetable products in Mercatenerife.
- Public transport Origin Destination Matrix, which shows the relationships between the places of origin and destination of journeys made on the island.
The Cabildo's open data project is clearly oriented towards compliance with the Technical Interoperability Standard (NTI) for the Reuse of Information Resources and the DCAT-AP model, areas in which it continues to make progress.
Use cases and applications to incentivise reuse
Beyond publishing open datasets, the Cabildo de Tenerife actively promotes their use through the development of use cases and applications. Examples of this work include:
- Development of a urban development plan in the municipality of Santiago del Teide through the reuse of various datasets.
- Project on meteorological data forecasting.
- Tourist places and traffic scorecards. Specifically:
- On tourism: tourist accommodation places by municipality and type, and the occupancy rate by type of accommodation from 1978 to 2023.
- About traffic: dashboard from Power BI showing the average daily traffic intensity at a station on the island for the years 2021, 2022 and 2023.
On the other hand, in order to promote the reuse of the data on its portal, the Cabildo of Tenerife organises various activities, such as the I Ideas Reuse Competition, in which 25 proposals were received. This competition will be followed by a second edition that will reward the development of applications.
In addition, there are talks and webinars, such as the one organised in collaboration with the Chair of Big Data, Open Data and Blockchain of the University of La Laguna on how to use open data from Tenerife to drive innovation , which you can see again here.
Next steps AI and community building
In order to measure the impact of open data, the Cabildo de Tenerife uses tools such as Google Analytics which allows the analysis of user interaction with the available data. The next big step, as reported by the organisation, will be to implement a virtual assistant with generative AI that will allow:
- Analysing data with natural language.
- Discover trends and correlations.
- Bringing information closer to any citizen.
In parallel, the Cabildo of Tenerife will also continue working on new avenues of collaboration with the island's municipalities and other entities, with the aim of expanding the amount and variety of open data available to citizens.
From datos.gob.es, we encourage development and research professionals, students and citizens to explore, reuse and create value with Tenerife's data.
Blog
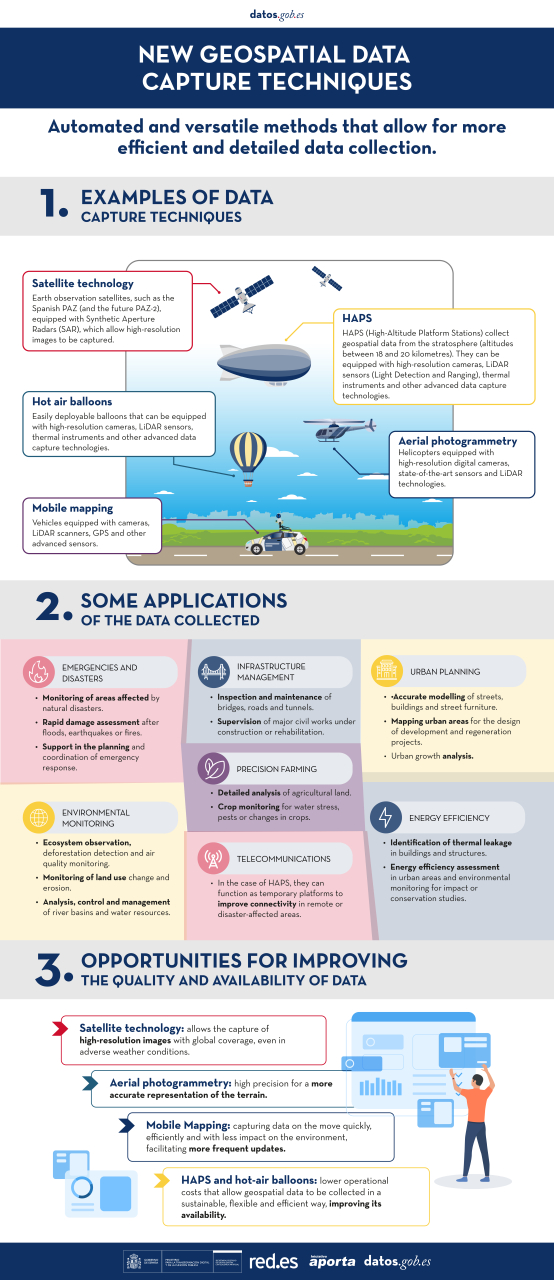
Geospatial data capture is essential for understanding our environment, making informed decisions and designing effective policies in areas such as urban planning, natural resource management or emergency response. In the past, this process was mainly manual and labour-intensive, based on ground measurements made with tools such as total stations and levels. Although these traditional techniques have evolved significantly and are still widely used, they have been complemented by automated and versatile methods that allow more efficient and detailed data collection.
The novelty in the current context lies not only in technological advances, which have improved the accuracy and efficiency of geospatial data collection, but also because it coincides with a widespread shift in mindset towards transparency and accessibility. This approach has encouraged the publication of the data obtained as open resources, facilitating their reuse in applications such as urban planning, energy management and environmental assessment. The combination of advanced technology and an increased awareness of the importance of information sharing marks a significant departure from traditional techniques.
In this article, we will explore some of the new methods of data capture, from photogrammetric flights with helicopters and drones, to ground-based systems such as mobile mapping, which use advanced sensors to generate highly accurate three-dimensional models and maps. In addition, we will learn how these technologies have empowered the generation of open data, democratising access to key geospatial information for innovation, sustainability and public-private collaboration.
Aerial photogrammetry: helicopters with advanced sensors
In the past, capturing geospatial data from the air involved long and complex processes. Analogue cameras mounted on aircraft generated aerial photographs that had to be processed manually to create two-dimensional maps. While this approach was innovative at the time, it also had limitations, such as lower resolution, long processing times and greater dependence on weather and daylight. However, technological advances have reduced these restrictions, even allowing operations at night or in adverse weather conditions.
Today, aerial photogrammetry has taken a qualitative leap forward thanks to the use of helicopters equipped with state-of-the-art sensors. The high-resolution digital cameras allow images to be captured at multiple angles, including oblique views that provide a more complete perspective of the terrain. In addition, the incorporation of thermal sensors and LiDAR (Light Detection and Ranging) technologies adds an unprecedented layer of detail and accuracy. These systems generate point clouds and three-dimensional models that can be integrated directly into geospatial analysis software, eliminating much of the manual processing.
| Features | Advantages | Disadvantages |
|---|---|---|
| Coverage and flexibility | It allows coverage of large areas and access to complex terrain. | May be limited for use in areas with airspace restrictions. Inaccessible to undergrouns or difficult to access areas such as tunnels. |
| Data type | Capture visual, thermal and topographic data in a single flight. | - |
| Precision | Generates point clouds and 3D models with high accuracy. | - |
| Efficiency in large projects | It allows coverage of large areas where drones do not have sufficient autonomy. | High operational cost compared to other technologies. |
|
Environmental impact and noise
|
- | Generates noise and greater environmental impact, limiting its use in sensitive areas. |
| Weather conditions | - | It depends on the weather; adverse conditions such as wind or rain affect its operation. |
| Amortised | - | High cost compared to drones or ground-based methods. |
Figure 1. Table with advantages and disadvantages of aerial photogrammetry with helicopters.
Mobile mapping: from backpacks to BIM integration
The mobile mapping is a geospatial data capture technique using vehicles equipped with cameras, LiDAR scanners, GPS and other advanced sensors. This technology allows detailed information to be collected as the vehicle moves, making it ideal for mapping urban areas, road networks and dynamic environments.
In the past, topographic surveys required stationary measurements, which meant traffic disruptions and considerable time to cover large areas. In contrast, mobile mapping has revolutionised this process, allowing data to be captured quickly, efficiently and with less impact on the environment. In addition, there are portable versions of this technology, such as backpacks with robotic scanners, which allow access to pedestrian or hard-to-reach areas.
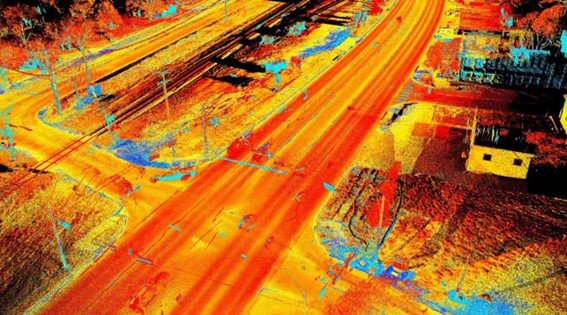
Figure 2. Image captured with mobile mapping techniques.
| Features | Advantages | Disadvantages |
|---|---|---|
| Speed | Captures data while the vehicle is on the move, reducing operating times. | Lower accuracy in areas with poor visibility for sensors (e.g. tunnels). |
| Urban coverage | Ideal for urban environments and complex road networks. | It is efficient in areas where vehicles can circulate, but its range is limited such as in rural or inaccessible terrain. |
| Flexibility of implementation | Available in portable (backpack) versions for pedestrian or hard-to-reach areas. | Portable equipment tends to have a shorter range than vehicular systems. |
| GIS and BIM implementation | It facilitates the generation of digital models and their use in planning and analysis. | Requires advanced software to process large volumes of data. |
| Impact on the environment | It does not require traffic interruptions or exclusive access to work areas. | Dependence on optimal environmental conditions, such as adequate light and climate. |
| Accessibility | Accessible to underground or hard-to-reach areas such as tunnels |
Figure 3. Table with advantages and disadvantages of mobile mopping.
The mobile mapping is presented as a versatile and efficient solution for capturing geospatial data on the move, becoming a key tool for the modernisation of urban and territorial management systems.
HAPS and ballons: new heights for information capture
HAPS (High-Altitude Platform Stations) and hot-air balloons represent an innovative and efficient alternative for capturing geospatial data from high altitudes. These platforms, located in the stratosphere or at controlled altitudes, combine features of drones and satellites, offering an intermediate solution that stands out for its versatility and sustainability:
- HAPS, like zeppelins and similar aircraft, operate in the stratosphere, at altitudes between 18 and 20 kilometres, allowing a wide and detailed view of the terrain.
- The aerostatic balloons, on the other hand, are ideal for local or temporary studies, thanks to their easiness of deployment and operation at lower altitudes.
Both technologies can be equipped with high-resolution cameras, LiDAR sensors, thermal instruments and other advanced technologies for data capture.
| Features | Advantages | Disadvantages |
|---|---|---|
| Useful | Large capture area, especially with HAPS in the stratosphere. | Limited coverage compared to satellites in orbit. |
| Sustainability | Lower environmental impact and energy footprint compared to helicopters or aeroplanes. | Dependence on weather conditions for deployment and stability. |
| Amortised | Lower operating costs than traditional satellites. | Higher initial investment than drones or ground equipment. |
| Versatility | Ideal for temporary or emergency projects. | Limited range in hot air balloons. |
| Duration of operation | HAPS can operate for long periods (days or weeks). | Hot air balloons have a shorter operating time. |
Figure 4. Table with advantages and disadvantages of HAPS and ballons
HAPS and balloons are presented as key tools to complement existing technologies such as drones and satellites, offering new possibilities in geospatial data collection in a sustainable, flexible and efficient way. As these technologies evolve, their adoption will expand access to crucial data for smarter land and resource management.
Satellite technology: PAZ satellite and its future with PAZ-2
Satellite technology is a fundamental tool for capturing geospatial data globally. Spain has taken significant steps in this field with the development and launch of the PAZ satellite. This satellite, initially designed for security and defence purposes, has shown enormous potential for civilian applications such as environmental monitoring, natural resource management and urban planning.
PAZ is an Earth observation satellite equipped with a synthetic aperture radar (SAR), which allows high-resolution imaging, regardless of weather or light conditions.
The upcoming launch of PAZ-2 (planned for 2030) promises to further expand Spain''s observation capabilities. This new satellite, designed with technological improvements, aims to complement the functions of PAZ and increase the availability of data for civil and scientific applications. Planned improvements include:
- Higher image resolution.
- Ability to monitor larger areas in less time.
- Increased frequency of captures for more dynamic analysis.
| Feature | Advantages | Disadvantages |
|---|---|---|
| Global coverage | Ability to capture data from anywhere on the planet. | Limitations in resolution compared to more detailed terrestrial technologies. |
| Climate independance | SAR sensors allow captures even in adverse weather conditions. | |
| Data frequency | PAZ-2 will improve the frequency of captures, ideal for continuous monitoring. | Limited time in the lifetime of the satellite. |
| Access to open data | It encourages re-use in civil and scientific projects. | Requires advanced infrastructure to process large volumes of data. |
Figure 5. Table with advantages and disadvantages of PAZ and PAZ-2 satellite technology
With PAZ and the forthcoming PAZ-2, Spain strengthens its position in the field of satellite observation, opening up new opportunities for efficient land management, environmental analysis and the development of innovative solutions based on geospatial datas. These satellites are not only a technological breakthrough, but also a strategic tool to promote sustainability and international cooperation in data access.
Conclusion: challenges and opportunities in data management
The evolution of geospatial data capture techniques offers a unique opportunity to improve the accuracy, accessibility and quality of data, and in the specific case of open data, it is essential to foster transparency and re-use of public information. However, this progress cannot be understood without analysing the role played by technological tools in this process.
Innovations such as LiDAR in helicopters, Mobile Mapping, SAM, HAPS and satellites such as PAZ and PAZ-2 not only optimise data collection, but also have a direct impact on data quality and availability.
In short, these technological tools generate high quality information that can be made available to citizens as open data, a situation that is being driven by the shift in mindset towards transparency and accessibility. This balance makes open data and technological tools complementary, essential to maximise the social, economic and environmental value of geospatial data.
You can see a summary of these techniques and their applications in the following infographic:
Content prepared by Mayte Toscano, Senior Consultant in Data Economy Technologies. The contents and points of view reflected in this publication are the sole responsibility of the author.
Blog
Citizen science is consolidating itself as one of the most relevant sources of most relevant sources of reference in contemporary research contemporary research. This is recognised by the Centro Superior de Investigaciones Científicas (CSIC), which defines citizen science as a methodology and a means for the promotion of scientific culture in which science and citizen participation strategies converge.
We talked some time ago about the importance importance of citizen science in society in society. Today, citizen science projects have not only increased in number, diversity and complexity, but have also driven a significant process of reflection on how citizens can actively contribute to the generation of data and knowledge.
To reach this point, programmes such as Horizon 2020, which explicitly recognised citizen participation in science, have played a key role. More specifically, the chapter "Science with and for society"gave an important boost to this type of initiatives in Europe and also in Spain. In fact, as a result of Spanish participation in this programme, as well as in parallel initiatives, Spanish projects have been increasing in size and connections with international initiatives.
This growing interest in citizen science also translates into concrete policies. An example of this is the current Spanish Strategy for Science, Technology and Innovation (EECTI), for the period 2021-2027, which includes "the social and economic responsibility of R&D&I through the incorporation of citizen science" which includes "the social and economic responsibility of I through the incorporation of citizen science".
In short, we commented some time agoin short, citizen science initiatives seek to encourage a more democratic sciencethat responds to the interests of all citizens and generates information that can be reused for the benefit of society. Here are some examples of citizen science projects that help collect data whose reuse can have a positive impact on society:
AtmOOs Academic Project: Education and citizen science on air pollution and mobility.
In this programme, Thigis developed a citizen science pilot on mobility and the environment with pupils from a school in Barcelona's Eixample district. This project, which is already replicable in other schoolsconsists of collecting data on student mobility patterns in order to analyse issues related to sustainability.
On the website of AtmOOs Academic you can visualise the results of all the editions that have been carried out annually since the 2017-2018 academic year and show information on the vehicles used by students to go to class or the emissions generated according to school stage.
WildINTEL: Research project on life monitoring in Huelva
The University of Huelva and the State Agency for Scientific Research (CSIC) are collaborating to build a wildlife monitoring system to obtain essential biodiversity variables. To do this, remote data capture photo-trapping cameras and artificial intelligence are used.
The wildINTEL project project focuses on the development of a monitoring system that is scalable and replicable, thus facilitating the efficient collection and management of biodiversity data. This system will incorporate innovative technologies to provide accurate and objective demographic estimates of populations and communities.
Through this project which started in December 2023 and will continue until December 2026, it is expected to provide tools and products to improve the management of biodiversity not only in the province of Huelva but throughout Europe.
IncluScience-Me: Citizen science in the classroom to promote scientific culture and biodiversity conservation.
This citizen science project combining education and biodiversity arises from the need to address scientific research in schools. To do this, students take on the role of a researcher to tackle a real challenge: to track and identify the mammals that live in their immediate environment to help update a distribution map and, therefore, their conservation.
IncluScience-Me was born at the University of Cordoba and, specifically, in the Research Group on Education and Biodiversity Management (Gesbio), and has been made possible thanks to the participation of the University of Castilla-La Mancha and the Research Institute for Hunting Resources of Ciudad Real (IREC), with the collaboration of the Spanish Foundation for Science and Technology - Ministry of Science, Innovation and Universities.
The Memory of the Herd: Documentary corpus of pastoral life.
This citizen science project which has been active since July 2023, aims to gather knowledge and experiences from sheperds and retired shepherds about herd management and livestock farming.
The entity responsible for the programme is the Institut Català de Paleoecologia Humana i Evolució Social, although the Museu Etnogràfic de Ripoll, Institució Milà i Fontanals-CSIC, Universitat Autònoma de Barcelona and Universitat Rovira i Virgili also collaborate.
Through the programme, it helps to interpret the archaeological record and contributes to the preservation of knowledge of pastoral practice. In addition, it values the experience and knowledge of older people, a work that contributes to ending the negative connotation of "old age" in a society that gives priority to "youth", i.e., that they are no longer considered passive subjects but active social subjects.
Plastic Pirates Spain: Study of plastic pollution in European rivers.
It is a citizen science project which has been carried out over the last year with young people between 12 and 18 years of age in the communities of Castilla y León and Catalonia aims to contribute to generating scientific evidence and environmental awareness about plastic waste in rivers.
To this end, groups of young people from different educational centres, associations and youth groups have taken part in sampling campaigns to collect data on the presence of waste and rubbish, mainly plastics and microplastics in riverbanks and water.
In Spain, this project has been coordinated by the BETA Technology Centre of the University of Vic - Central University of Catalonia together with the University of Burgos and the Oxygen Foundation. You can access more information on their website.
Here are some examples of citizen science projects. You can find out more at the Observatory of Citizen Science in Spain an initiative that brings together a wide range of educational resources, reports and other interesting information on citizen science and its impact in Spain. do you know of any other projects? Send it to us at dinamizacion@datos.gob.es and we can publicise it through our dissemination channels.
Blog
The National Centre for Geographic Information publishes open geospatial data from the National Cartographic System, the National Geographic Institute and other organisations through web applications and mobile applications to facilitate access to and consultation of geographic data by citizens.
Geospatial data is published via web services and APIs for reuse, so in the case of high-value datasets, it can be used in a variety of ways high-value datasets such as geographic names, hydrography or addresses as required by the as required by the EUthe EU has already made these datasets available to the public by June 2024 as they are associated with major benefits for society, the environment and the economy.
But in the applications listed below, the geographic data are visualised and consulted through web services, so that for downloading the data, it is possible to use web services and APIs directly, through a platform accessible to any user with a wide range of geographic information, ranging from topographic maps to satellite images.
But not only data can be reused, also application software is reusable, for example, the Solar Energy Potential of Buildings visualiser which is based on a visualiser API, named API-CNIG and allows the same tool to be used for different thematic areas.
Some examples of applications are:

Solar Energy Potential of Buildings
Provides the photovoltaic capacity of a building according to its location and characteristics. It also provides the average over the year and a point grid to identify the best location for solar panels.
National Geographic Gazetteer
It is a toponym search engine that collects the names, official or standardised by the corresponding competent bodies , with geographical references.
Unified postal address calculator
It is a converter that allows to know the geographical coordinates (latitude and longitude in WGS84) of the postal addresses of a place, and vice versa. In both cases, the input file is a CSV file, supporting both coordinates and postal addresses.
Basic Maps of Spain
It facilitates connection to IGN services and to the CNIG download centre to obtain maps and routes. With this mobile application you can follow the routes of the National Parks or the stages of the Camino de Santiago. It allows you to plan excursions using maps, navigate and take guided tours, without the need for an internet connection after downloading data.
Map a la carte
It allows you to create a customised map using the printed series of the National Topographic Map at scales 1:25.000 and 1:50.000. It offers the possibility of defining its area, incorporating contents, personalising the cover, obtaining a pdf file and even acquiring paper copies by post.
IGN Earthquakes
It allows the reception and visualisation of all seismic events in Spain and its surroundings. It provides the distance to the epicentre of the seismic event and epicentral parameters, as well as the geolocation of the user's position and the epicentre.
Maps of Spain
It is a free mobile viewer ideal for hiking, cycling, running, skiing, etc., which uses as background cartography the services of the National Geographic Institute and another set of services from other Ministries, such as the Cadastral information of the plots provided by the General Directorate of Cadastre.
Camino de Santiago
It includes information of a cultural and practical nature on each of the stages (hostels, monuments, etc.), as well as a complete Pilgrim's Guide detailing what you should know before starting out on any of the routes. This application is based on ESRI software.
National Parks
Displays information on the history, fauna, flora and excursions in Spain's National Parks. It includes hundreds of points of interest such as information centres, accommodation, viewpoints, refuges and even routes through the parks, indicating their duration and difficulty. The app is available for download on Android e iOS. This application is based on ESRI software.
GeoSapiens IGN
It presents interactive maps, free to use and free of charge, to study the physical and political geography of Spain and the world. It consists of different games relating to the whole of Spain or by autonomous communities, the whole world and by continent.
In addition to the applications developed by the CNIG, which are also presented in this video this videothere are many other digital solutions developed by third parties that reuse open geospatial data to offer a service to society. For example, in the list of data reusing applications.gob.es you can find from a map that shows the fires that are active in Spain in real time in Spain in real time to an app that shows where the parking spaces for people with reduced mobility parking spaces for people with reduced mobility in each town.
In short, anyone can make use of the open geographic data of the National Cartographic System, the National Geographic Institute and other bodies published by the CNIG , thus extending the advantages offered by the availability of open geographic data. do you know of any other application resulting from the reuse of open data? You can send it to us at dinamizacion@datos.gob.es
Blog
The promotion of energy efficiency and sustainability is one of the priorities of the European Union and Spain, as reflected in the European Green Pact. The availability of open data related to energy production, distribution and consumption allows governments, businesses and citizens to access essential information to address the challenges of climate change and promote a more sustainable future.
In this post, we explore examples of use cases that show the impact of open data on the energy landscape, as well as sources of interest where to find quality data on the subject.
Open data use cases in the energy sector
EUR 79,600 million. This is the estimated annual savings from open data in the energy sector in the European Union, according to the report "The Economic Impact of Open Data: Opportunities for Value Creation in Europe (2020)". This is possible thanks to multiple projects and applications based on open data that affect various areas.
-
More efficient resource planning
Access to open data on available energy resources makes it possible to identify the most suitable areas to develop projects, ensuring that the use of available natural resources is maximised. For example, in the Baltic Sea, natural gas infrastructure is being expanded to meet the region's growing needs. By taking advantage of Copernicus' advanced data together with its own monitoring and forecasting services (including data on wind, waves, sea water level, currents, sea ice, etc.), the Estonian and Finnish governments were able to carry out more efficient planning for the installation of a new plant.
Likewise, the National Geographic Institute has made available to users a viewer to find out the incidence of the sun and determine the best location for solar panels. Thanks to this viewer, different locations and orientations can be analysed to identify the position that maximises solar energy collection.
-
More responsible and efficient consumption
Open data also includes information on the use and performance of different energies. The Junta de Castilla y León, for example, has a dataHub that collects information from more than 1,500 consumer centres. This dashboard allows the analysis by type of energy (electricity, gas, diesel) and by geographical location (educational centres, health centres, administrative offices, hospitals, etc.). This allows them to compare consumption between the buildings they manage and make efficiency decisions, which has resulted in savings of €2M per year since 2015 on the fixed cost of electricity alone.
The Urban3r viewer allows the visualisation of different indicators on the current state of the building, the energy demand data of residential buildings in their current state and after energy refurbishment, as well as the estimated costs of these interventions, facilitating decision making.
Commercial solutions are also available on the market for this purpose, such as Opower, a tool that uses artificial intelligence to provide personalised information to each customer, identifying and suggesting the replacement of inefficient heating and cooling systems. Another example is uplight, which performs energy efficiency analyses for commercial buildings, utilities and government entities with operational and retrofit recommendations to reduce consumption. These examples highlight the business opportunity in this niche market.
-
Possibility to choose cheaper suppliers
Open data provides detailed information on tariffs and prices of different energy suppliers. This transparency allows consumers to easily compare offers and choose the option that best suits their needs. This is the case of applications for choosing petrol stations, such as Mejorgasolinera.com or Precioil.es, which offer detailed information on the country's petrol stations and allow filtering by brand, location or road and sorted by price and distance. We also find similar solutions for the electricity market, such as Tarifaluzhora.
The National Commission for Markets and Competition (CNMC in Spanish) also has a Energy Offers Comparator (CNMC), which allows you to consult gas and electricity offers.
-
Transparency, accountability and harm minimisation
The publication of open data not only allows citizens and organisations to access detailed information on energy production, distribution and consumption. It also increases transparency in resource management and promotes accountability of energy companies and governments.
To this end, OpenOil was born, which aims to reduce the opacity of the oil industry and thereby increase the accountability of oil companies. It provides an open data framework for natural resource management at the supranational level, as well as consultancy and training services for the creation of natural resource management mechanisms and processes.
In order to minimise the impact of oil spills in the oceans, the Spanish National Research Council (CSIC), in collaboration with Digital Earth Solutions (DES), has developed a unique software, capable of predicting in a few minutes and with great precision the geographic evolution of any oil slick, forecasting its future trajectory in the ocean or studying its movement backwards in time to find its origin.
Where can I find energy data?
If you are thinking of developing such a solution, you are in luck, because there is a wealth of open energy data available on the web.
If you are looking for data from Spain, in addition to datos.gob.es, you can visit the following websites:
- Institute for Energy Diversification and Saving (IDAE). IDAE provides sectorised statistics and energy balances for both primary and final energy, in thousands of tonnes of oil equivalent (ktoe). In total, 69 energy types and 128 energy flows and/or sectors are detailed. The data currently available cover the historical series from 1990 to 2022.
- Red Eléctrica de España. REData is the website of Red eléctrica where we can find national statistical series related to the Spanish electricity system, updated month by month. In this space you can also access information on demand, generation, balancing, exchange, transmission and electricity markets, whose data are available through a REST API. Depending on the nature of the dataset, we can find data that are updated annually, quarterly or even daily. Another useful tool of Red Eléctrica is ESIOS, with updated data on generation, consumption, market, prices, etc.
- National Commission for Markets and Competition (CNMC): The CNMC Data open data portal provides direct access to data and indicators relating to the energy markets overseen by the CNMC: electricity, natural gas and oil products. We can find statistics on market prices, the number of users benefiting from the social bonus or the percentage of renewable energy in the total amount, among other values. Data are updated regularly, on a monthly, quarterly or annual basis.
A wealth of information is also available worldwide:
- European Union. On the EU's energy policy website, we find various data and analyses ranging from oil price developments in individual member states to possible energy market scenarios for 2030 and 2050, among many others. In addition, the European Commission's Directorate-General for Energy produces energy statistical fact sheets every two years, based on data from Eurostat and EU greenhouse gas monitoring. The data is broken down by country, which allows for easy comparisons. Also available is the ENSPRESO database, which focuses on the wind, solar and biomass sectors.
- International Energy Agency (IEA). IEA is an international organisation created in 1974 by the Organisation for Economic Co-operation and Development (OECD) to secure energy supplies. Although some of the datasets offered are paid for, open data can also be found on the website and can be downloaded upon registration.
- Other countries: At the international level, we can find detailed portals by country, such as the US Open Energy Data Initiative (OEDI) or the UK.
These are just a few examples of solutions and data sources that highlight the impact that opening up energy data can have on our environment, both in terms of cost savings and efficiency gains. We invite you to share other open data solutions and portals in comments.
Blog
In recent years, climate change has become one of the most pressing challenges of our time because, according to the main reports of different international institutions, it is accelerating beyond the most pessimistic forecasts. Rising global temperatures, melting glaciers, rising sea levels and the frequency of extreme weather events have been well documented in reports such as that produced by the Intergovernmental Panel on Climate Change (IPCC). Similarly, the report CO2 Emissions in 2022 of the International Energy Agency (IEA) warns of the continuous growth of carbon emissions and their contribution to global warming, while calling for urgent efforts to reduce them.
In this critical context that threatens the stability of our planet, open data becomes a fundamental tool to understand, monitor and combat the phenomenon of global climate change with solutions. Moreover, there are several dimensions in which open data is playing an essential role in the fight against climate change.
Climate Modeling and Prediction: planning for a Sustainable Future
Climate models make it possible to predict how the climate will change in the future and, when properly trained, also help to identify potential impacts in specific regions. This enables governments and communities to take measures to adapt to rapidly changing conditions.
Increasingly, these models are fed by open datasets, and some climate models have even begun to be published freely and openly. In this line, we find the climate models published on the MIT Climate portal or the data and models published by NOAA Climate.gov. In this way, all kinds of institutions, scientists and even citizens can contribute to identifying possibilities for mitigating the effects of climate change.
Carbon emissions monitoring: carbon footprint tracking
Thanks to open data and some paid-for datasets, it is now possible to accurately track the carbon emissions of countries, cities and even companies on an ongoing basis. As exemplified by the International Energy Agency's (IEA) World Energy Outlook 2022 or the U.S. Environmental Protection Agency's Global Greenhouse Gas Emissions Data, these data are essential not only for measuring and analyzing emissions globally, but also for assessing progress towards emission reduction targets.
Adapting Agriculture: cultivating a resilient future
It is clear that climate change has a direct impact on agriculture and that this impact threatens a global food security that in itself is already a global challenge. Open data on weather patterns, rainfall and temperatures, land use and fertilizer and pesticide use, coupled with local data captured in the field, allow farmers to adapt their practices and evolve towards a model of precision agriculture. Choosing crops that are resilient to changing conditions, and managing inputs more efficiently thanks to this data, is crucial to ensure that agriculture remains sustainable and productive in the new scenarios.
Among other organizations, the Food and Agriculture Organization of the United Nations (FAO) highlights the importance of open data in climate-smart agriculture and publishes datasets on pesticide use, inorganic fertilizers, greenhouse gas emissions, agricultural production, etc., which contribute to improved land, water and food security management.
Natural Disaster Response: minimizing Impact
The analysis of data on extreme weather events, such as hurricanes or floods, makes it possible to design strategies that lead to a faster and more effective response when these events occur. In this way, on the one hand, lives are saved and, on the other, the high impact on affected communities is partially mitigated.
Open data such as those published by the US National Hurricane Center (NHC) or the European Environment Agency are valuable tools in natural disaster management as they help streamline disaster preparedness decision-making and provide an objective basis for assessment and prioritization.
Biodiversity and conservation: protecting our natural wealth
While it seems clear that biodiversity is vital to the health of the Earth, human activity continues to put it under great pressure, combining with climate change to threaten its stability. Open data on species populations, deforestation and other ecological indicators such as those published by governments and organizations around the world in the Global Biodiversity Information Facility (GBIF) help us to identify areas at risk more quickly and accurately and thus prioritize conservation efforts.
With the increased availability of open data, governments, institutions, companies and citizens can make informed decisions to mitigate the consequences of climate change and work together towards a more sustainable future.
Content prepared by Jose Luis Marín, Senior Consultant in Data, Strategy, Innovation & Digitalization.
The contents and points of view reflected in this publication are the sole responsibility of its author.
Noticia
Public administrations (PAs) have the obligation to publish their open datasets in reusable formats, as dictated by European Directive 2019/1024 which amends Law 37/2007 of November 16, regarding the reuse of public sector information. This regulation, aligned with the European Union's Data Strategy, stipulates that PAs must have their own catalogs of open data to promote the use and reuse of public information.
One of these catalogs is the Canary Islands Open Data Portal, which contains over 7,450 open, free, and reusable datasets from up to 15 organizations within the autonomous community. The Ministry of Agriculture, Livestock, Fisheries, and Food Sovereignty (CAGPSA) of the Government of the Canary Islands is part of this list. As part of its Open Government initiative, CAGPSA has strongly promoted the opening of its data.
Through a process of analysis, refinement, and normalization of the data, CAGPSA has successfully published over 20 datasets on the portal, thus ensuring the quality of information reuse by any interested party.
Analysis, data normalization, and data opening protocol for the Government of the Canary Islands
To achieve this milestone in data management, the Ministry of Agriculture, Livestock, Fisheries, and Food Sovereignty of the Government of the Canary Islands has developed and implemented a data opening protocol, which includes tasks such as:
- Inventory creation and prioritization of data sources for publication.
- Analysis, refinement, and normalization of prioritized datasets.
- Requesting the upload of datasets to the Canary Islands Open Data Portal.
- Addressing requests related to the published datasets.
- Updating published datasets.
Data normalization has been a key factor for the Ministry, taking into account international semantic assets (including United Nations classifications and various agencies or Eurostat) and applying guidelines defined in international standards such as SDMX or those set by datos.gob.es, to ensure the quality of the published data.
CAGPSA has not only put efforts into data normalization and publication but has also provided support to the ministry's personnel in the management and maintenance of the data, offering training and awareness sessions. Furthermore, they have created a manual for data reuse, outlining guidelines based on European and national directives regarding open data and the reuse of public sector information. This manual helps address concerns of the ministry's staff regarding the publication of personal or commercial data.
As a result of this work, the Ministry has actively collaborated with the Canary Islands Open Data Portal in publishing datasets and defining the data opening protocol established for the entire Government of the Canary Islands.
Commitment to Quality and Information Reuse
CAGPSA has been particularly recognized for the publication of the Agricultural Transformation Societies (SAT) dataset, which ranked among the top 3 datasets by the Multisectorial Information Association (ASEDIE) in 2021. This initiative has been praised by the association on multiple occasions for its focus on data quality and management.
Their efforts in data normalization, support to the ministry's staff, collaboration with the open data portal, and the extensive array of datasets, position CAGPSA as a reference in this field within the Canary Islands autonomous community.
At datos.gob.es, we applaud these kinds of examples and highlight the good practices in data opening by public administrations. The initiative of the Ministry of Agriculture, Livestock, Fisheries, and Food Sovereignty of the Government of the Canary Islands is a significant step that brings us closer to the advantages that open data and its reuse offer to the citizens. The Ministry's commitment to data openness contributes to the European and national goal of achieving a data-driven administration.