


gráficos
-
 Data visualization: the best charts for representing comparisons
22-02-2023
Data visualization: the best charts for representing comparisons
22-02-2023
Data is a valuable source of knowledge for society. Public commitment to achieving data openness, public-private collaboration on data, and the development of applications with open data are actions that are part of the data economy, which seeks the...
-
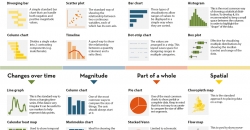 How to choose the right chart to visualise open data
05-01-2023
How to choose the right chart to visualise open data
05-01-2023
A statistical graph is a visual representation designed to contain a series of data whose objective is to highlight a specific part of the reality. However, organising a set of data in an informative way is not an easy task, especially, if we want to...


