4 posts found
Data visualization: the best charts for representing comparisons
Data is a valuable source of knowledge for society. Public commitment to achieving data openness, public-private collaboration on data, and the development of applications with open data are actions that are part of the data economy, which seeks the innovative, ethical, and practical use of data to…

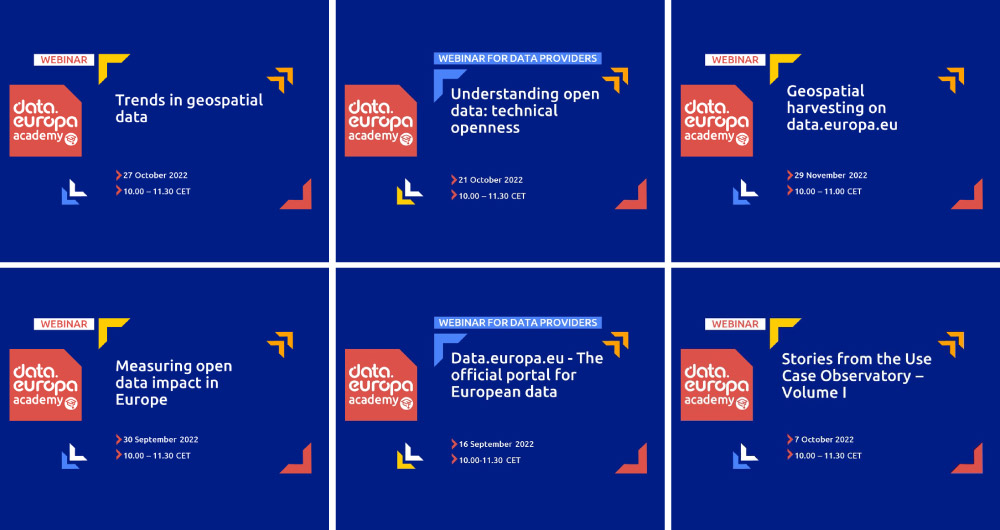
From the legal perspective of open data to the importance of its re-use: 15 data.europa.eu webinars to broaden your knowledge
Over the past year, the academic section of data.europa.eu expanded its open data training offer by publishing new conferences, courses and workshops. Thus, data.europa.academy shared a total of 15 webinars related to open data, data spaces and other topics and technical issues around the data econo…
How to choose the right chart to visualise open data
A statistical graph is a visual representation designed to contain a series of data whose objective is to highlight a specific part of the reality. However, organising a set of data in an informative way is not an easy task, especially, if we want to capture the viewer’s attention and to present the…

Painting and Data
Until relatively recently, talking about art and data in the same conversation might seem strange. However, recent advances in data science and artificial intelligence seem to open the door to a new discipline in which science, art and technology go hand in hand.
The cover image has been extracted…
arte R visualizaciones +1
