5 posts found
Benefits and opportunities of public initiatives for open data visualisation
Imagine you want to know how many terraces there are in your neighbourhood, how the pollen levels in the air you breathe every day are evolving or whether recycling in your city is working well. All this information exists in your municipality's databases, but it sits in spreadsheets and technical d…
Artificial Intelligence applied to the identification and classification of diseases detected by radiodiagnosis
In this post we have described step-by-step a data science exercise in which we try to train a deep learning model with a view to automatically classifying medical images of healthy and sick people.
Diagnostic imaging has been around for many years in the hospitals of develo…
Different approaches to identifying high-value data
Since the publication of Directive (EU) 2019/1024 on open data and re-use of public sector information, the European Commission is undertaking a number of actions to develop the concept of high-value data that this directive introduced as an important novelty in June 2019.
We recall that high-value…
Low coding tools for data analysis
The democratisation of technology in all areas is an unstoppable trend. With the spread of smartphones and Internet access, an increasing number of people can access high-tech products and services without having to resort to advanced knowledge or specialists. The world of data is no stranger to thi…
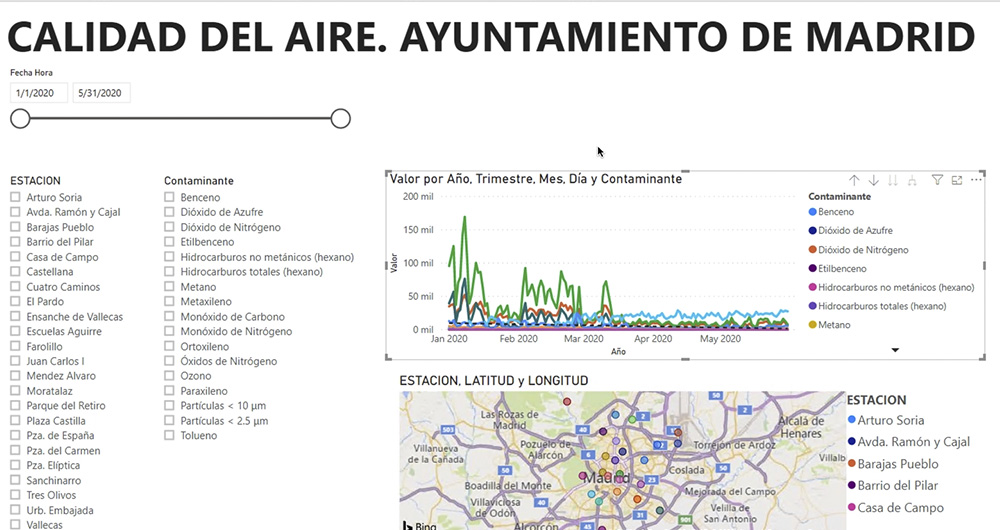
What is an interactive display? Here is an example
The visual representation of data helps our brain to digest large amounts of information quickly and easily. Interactive visualizations make it easier for non-experts to analyze complex situations represented as data.
As we introduced in our last post on this topic, graphical data visualization is a…


