4 posts found
Digital rights: principles, initiatives and challenges in the digital age
We live in an increasingly digitalised world where we work, study, inform ourselves and socialise through technologies. In this world, where technology and connectivity have become fundamental pillars of society, digital rights emerge as an essential component to guarantee freedom, privacy and equal…

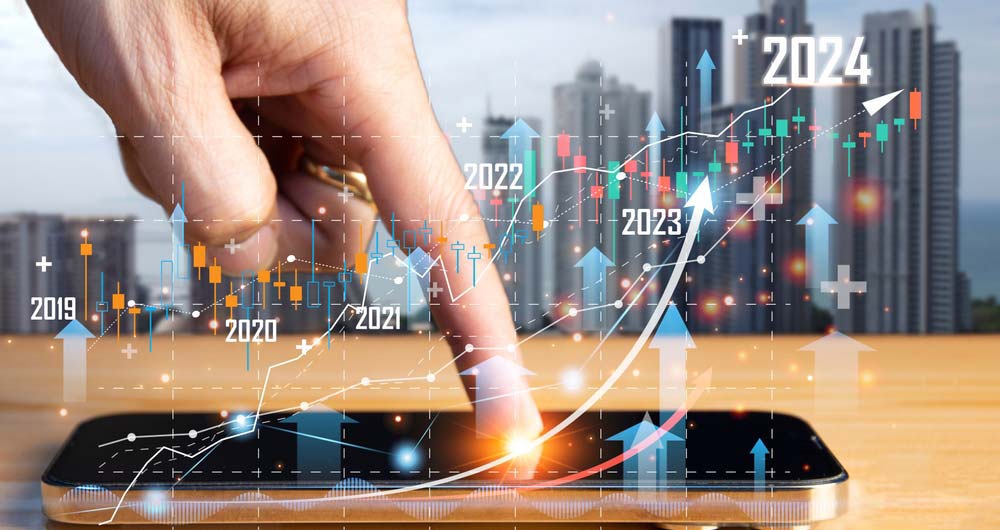
High value statistical datasets foreseen in the National Statistical Plan 2021-2024
The year 2023 was undoubtedly the year of artificial intelligence. This has brought data, and therefore open data, back to the forefront, as it is the raw material that fuels this technology, which is key to value creation in our increasingly digital economy.
Perhaps that is why 2023 has also l…
Data visualization: the best charts for representing comparisons
Data is a valuable source of knowledge for society. Public commitment to achieving data openness, public-private collaboration on data, and the development of applications with open data are actions that are part of the data economy, which seeks the innovative, ethical, and practical use of data to…

How to choose the right chart to visualise open data
A statistical graph is a visual representation designed to contain a series of data whose objective is to highlight a specific part of the reality. However, organising a set of data in an informative way is not an easy task, especially, if we want to capture the viewer’s attention and to present the…
