92 documents found
Features for the creation of data spaces
A data space is an ecosystem where, on a voluntary basis, the data of its participants (public sector, large and small technology or business companies, individuals, research organizations, etc.) are pooled. Thus, under a context of sovereignty, trust and security, products or services can be…
- Guides

How to facilitate data collaboration to solve societal problems
Data are fundamental to solving the social and economic challenges we face today. It allows us to understand the causes behind a given situation and the factors that influence it, to estimate how it is evolving and to make informed decisions for change.
The problem is that solving such challenges…
- Reports and studies

Characteristics of the Spanish University students and most demanded degrees
1. Introduction
Visualizations are graphical representations of data that allow to transmit in a simple and effective way the information linked to them. The visualization potential is very wide, from basic representations, such as a graph of lines, bars or sectors, to visualizations configured on…
- Data exercises

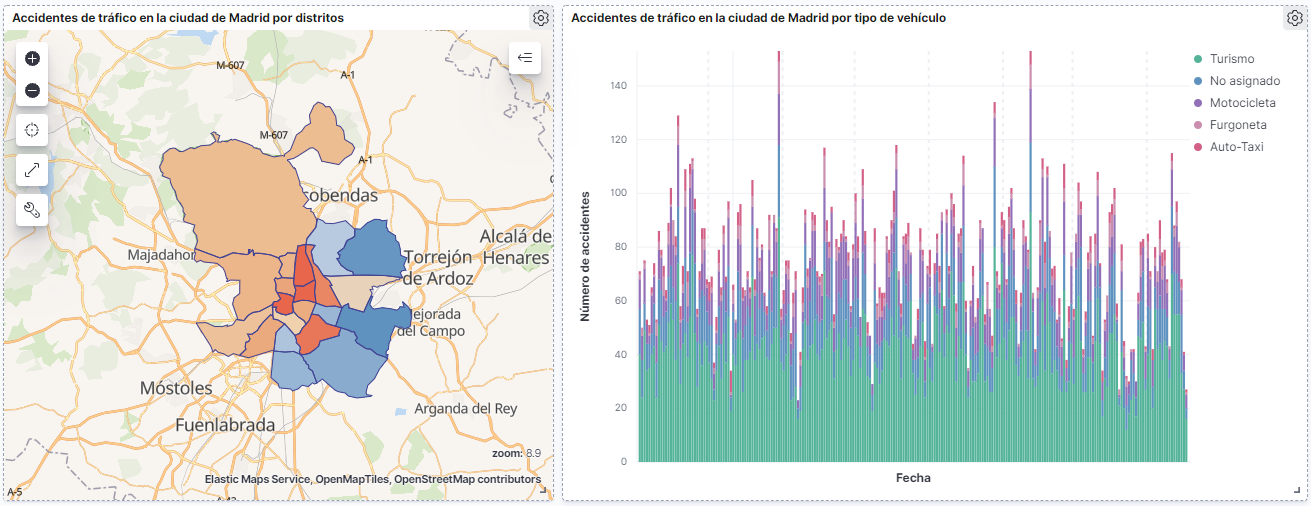
How many accidents occur in the city of Madrid?
1. Introduction
Data visualization is a task linked to data analysis that aims to graphically represent underlying data information. Visualizations play a fundamental role in the communication function that data possess, since they allow to drawn conclusions in a visual and understandable way,…
- Data exercises
How to deal with a data analysis project?
By analysing data, we can discover meaningful patterns and gain insights that lead to informed decision making. But good data analysis needs to be methodical and follow a series of steps in an orderly fashion. In this video (in Spanish) we give you some tips on the steps to follow:
The importance…
- Guides

Practical guide for the publication of linked data
It is important to publish open data following a series of guidelines that facilitate its reuse, including the use of common schemas, such as standard formats, ontologies and vocabularies. In this way, datasets published by different organizations will be more homogeneous and users will be able to…
- Guides

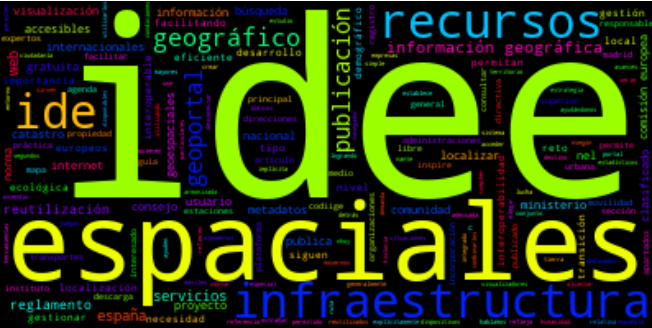
Creating word clouds from the text data with NLP techniques
1. Introduction
Visualizations are a graphic representation that allow us to comprehend in a simple way the information that the data contains. Thanks to visual elements, such as graphs, maps or word clouds, visualizations also help to explain trends, patterns, or outliers that data may present.…
- Data exercises
Help videos for data reusers in datos.gob.es
In a platform such as datos.gob.es, where the frequency of dataset updates is constant, it is necessary to have mechanisms that facilitate massive and automatic queries.
In datos.gob.es we have an API and a SPARQL point to facilitate this task. Both tools allow querying the metadata associated with…
- Guides

Help videos for data publishers on datos.gob.es
Open data publishers in the National Catalog hosted in datos.gob.es have at their disposal several internal functionalities to easily manage their datasets and everything related to them.
To bring these possibilities closer to the registered users, from datos.gob.es we have prepared a series of…
- Guides

Infographics: Featured strategies and datasets
Discover which are the strategic frameworks that mark the publication and use of open data, as well as the most outstanding datasets at local, regional, national and international level through the various infographics that we will publish periodically.
European Health Data Space: objectives and…
- Infographics
