92 documents found
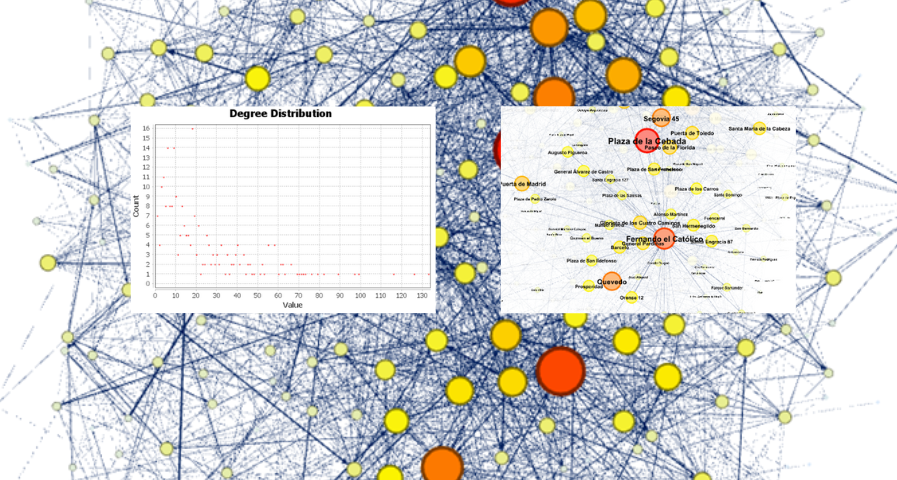
Analysis of travel networks in BICIMAD
1. Introduction
Visualizations are graphical representations of data that allow the information linked to them to be communicated in a simple and effective way. The visualization possibilities are very wide, from basic representations, such as line, bar or sector graphs, to visualizations…
- Data exercises
Open Data and Reuse of Public Sector Information in the Judicial Field: Challenges in Regulation, Use Cases, and Opportunities
The digitalization in the public sector in Spain has also reached the judicial field. The first regulation to establish a legal framework in this regard was the reform that took place through Law 18/2011, of July 5th (LUTICAJ). Since then, there have been advances in the technological modernization…
- Reports and studies

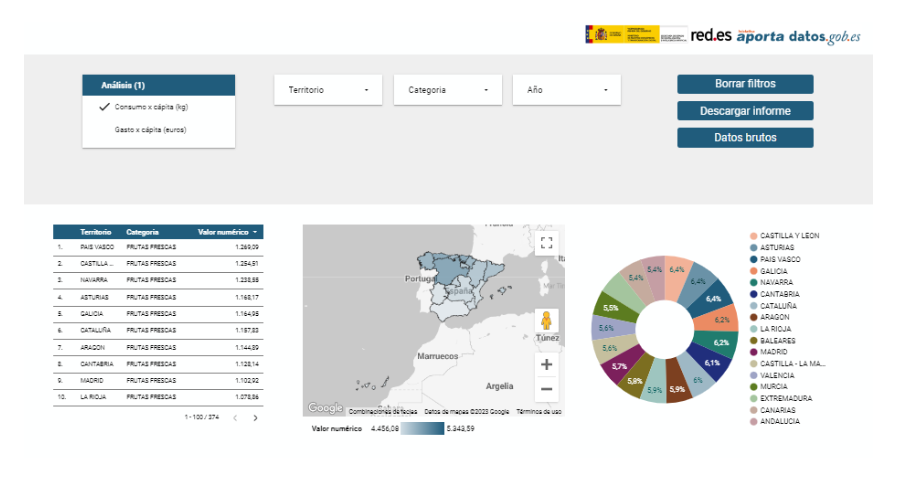
Study on nutrition in spanish homes
1. Introduction
Visualizations are graphical representations of data that allow the information linked to them to be communicated in a simple and effective way. The visualization possibilities are very wide, from basic representations, such as line, bar or sector graphs, to visualizations…
- Data exercises
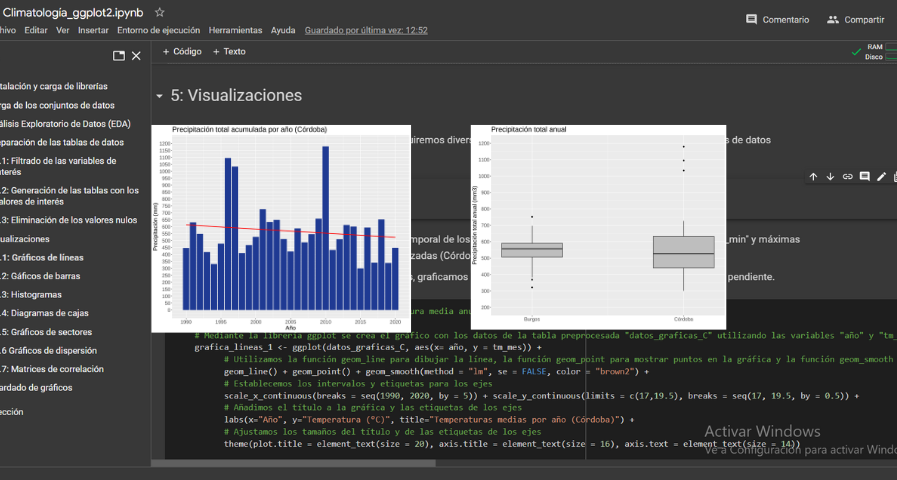
Analysis of meteorological data using the "ggplot2" library
1. Introduction
Visualizations are graphical representations of data that allow the information linked to them to be communicated in a simple and effective way. The visualization possibilities are very wide, from basic representations, such as a line chart, bars or sectors, to visualizations…
- Data exercises
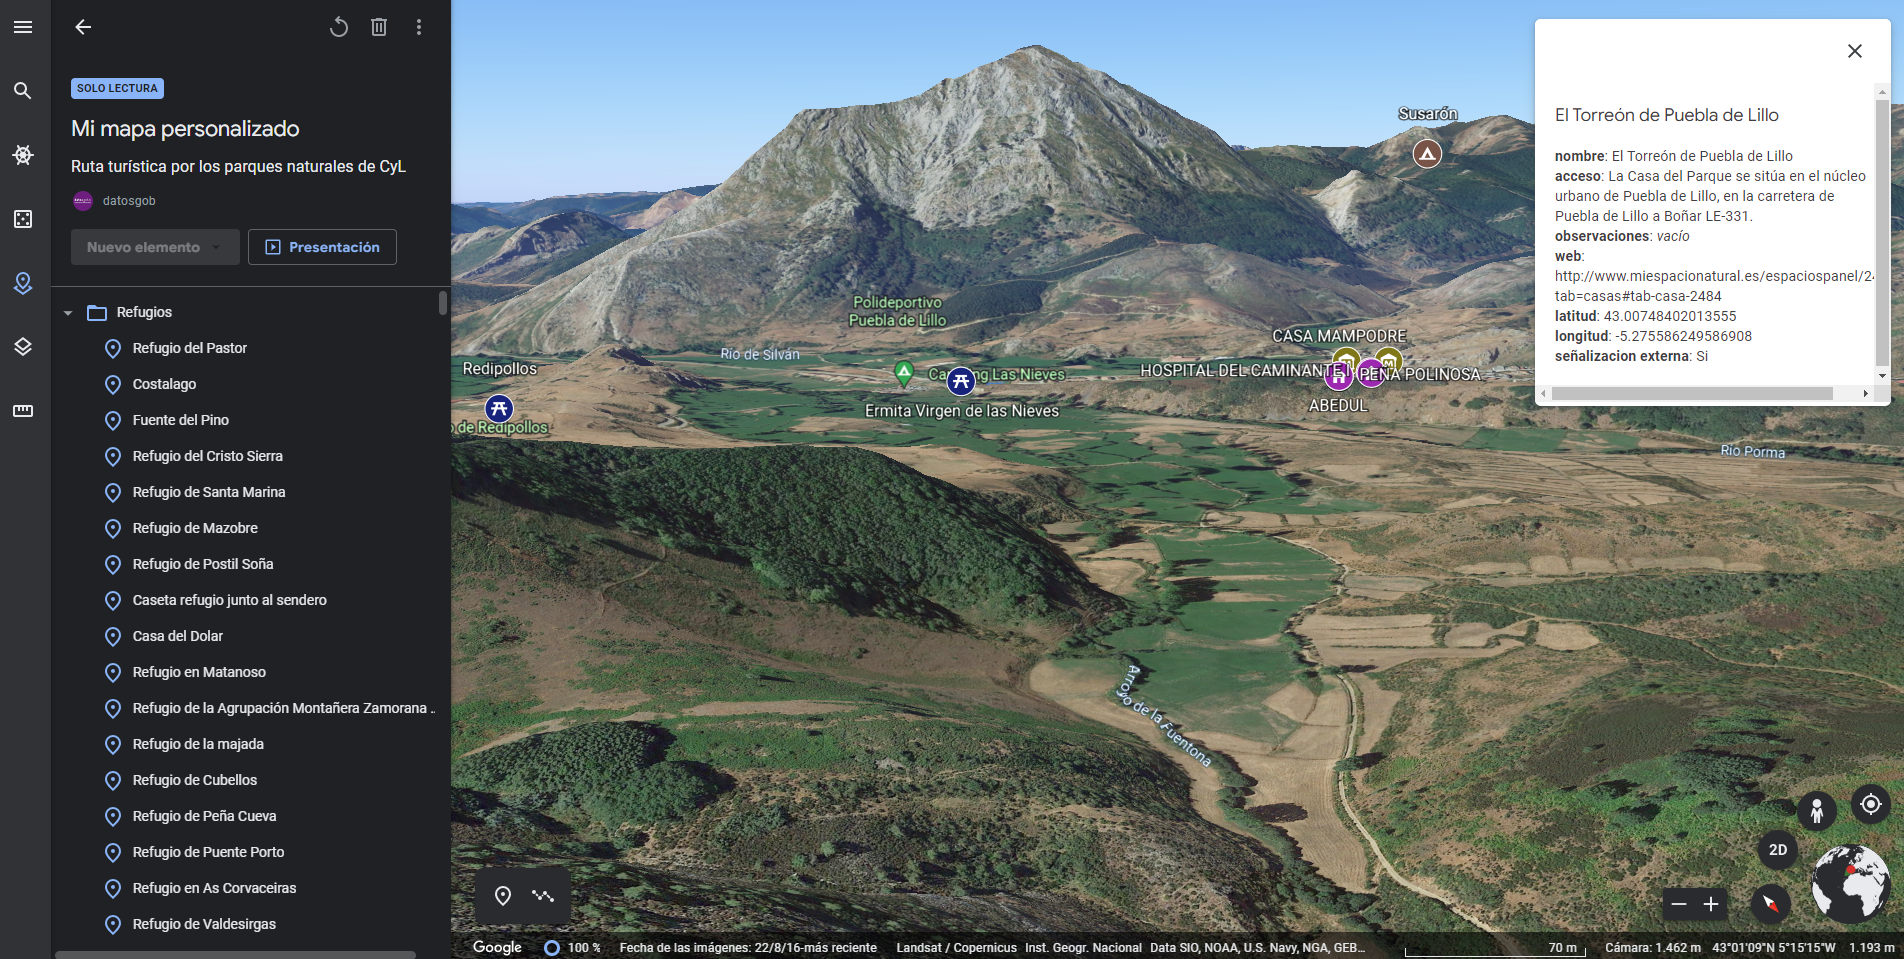
Generating personalized tourist map with "Google My Maps"
1. Introduction
Visualizations are graphical representations of the data allowing to transmit in a simple and effective way related information. The visualization capabilities are extensive, from basic representations, such as a line chart, bars or sectors, to visualizations configured on control…
- Data exercises
Analysis of toxicological findings in road traffic accidents
1. Introduction
Visualizations are graphical representations of data that allows comunication in a simple and effective way the information linked to it. The visualization possibilities are very wide, from basic representations, such as a graph of lines, bars or sectors, to visualizations…
- Data exercises

How to develop a plan of measures to promote openness and reuse of open data
Public sector bodies must make their data available for re-use, making it accessible in the form of open data, as referred to in Spain's legislative framework. The first step for this is that each entity, at local, regional and state level, as well as bodies, entities and trading companies…
- Guides

Introduction to data anonymisation: Techniques and case studies
Data anonymization defines the methodology and set of best practices and techniques that reduce the risk of identifying individuals, the irreversibility of the anonymization process, and the auditing of the exploitation of anonymized data by monitoring who, when, and for what purpose they are used…
- Guides

Practical guide for improving the quality of open data
When publishing open data, it is essential to ensure its quality. If data is well documented and of the required quality, it will be easier to reuse, as there will be less additional work for cleaning and processing. In addition, poor data quality can be costly for publishers, who may spend more…
- Guides

Analysis of the state and evolution of the national water reservoirs
1. Introduction
Visualizations are graphical representations of data that allow the information linked to them to be communicated in a simple and effective way. The visualization possibilities are very broad, from basic representations such as line, bar or pie chart, to visualizations configured on…
- Data exercises
