92 documents found
Tourism in Spain: Analyzing National Tourist Flows Using Interactive Visualizations
1. Introduction
Visualizations are graphical representations of data that allow for the simple and effective communication of information linked to them. The possibilities for visualization are very broad, from basic representations such as line graphs, bar charts or relevant metrics, to…
- Data exercises

Municipal Innovation through Open Data: Solutions to make municipal services more accessible
The digital revolution is transforming municipal services, driven by the increasing adoption of artificial intelligence (AI) technologies that also benefit from open data. These developments have the potential to redefine the way municipalities deliver services to their citizens, providing tools to…
- Reports and studies

How to use OGC APIs to enhance geospatial data interoperability
In a world where geospatial information is crucial to address global challenges such as climate change and natural resource management, interoperability and the creation of standards are essential. Interoperability facilitates collaboration between organisations, drives innovation and ensures that…
- Guides

How to Create an Expert Assistant with Open Data: Building GPT to Answer the Critical Minerals Challenge
1. Introduction
In the information age, artificial intelligence has proven to be an invaluable tool for a variety of applications. One of the most incredible manifestations of this technology is GPT (Generative Pre-trained Transformer), developed by OpenAI. GPT is a natural language model…
- Data exercises

Road to electrification: Deciphering electric vehicle growth in Spain through data analytics
1. Introduction
Visualisations are graphical representations of data that allow to communicate, in a simple and effective way, the information linked to the data. The visualisation possibilities are very wide ranging, from basic representations such as line graphs, bar charts or relevant metrics,…
- Data exercises

Glossary of data-related terms
The following is a definition of various terms regarding data and related technologies.
1. Glossary of terms related to open data.
(You can download the accessible version here)
2. Glossary of terms related to new technologies and data
(You can download the accessible version…
- Guides
Open data to achieve the Sustainable Development Goals
The Sustainable Development Goals (SDGs) are a set of targets adopted by the international community aimed at addressing the most pressing challenges of our time. These goals were born simultaneously with the Global Partnership for Sustainable Development Data and the International Open Data…
- Reports and studies

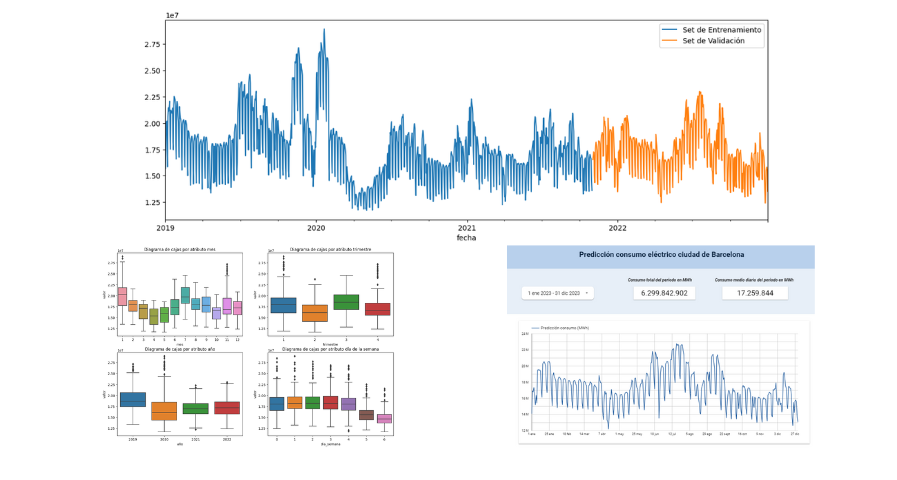
Predictive analisys of electric consuption in the city of Barcelona
1. Introduction
Visualizations are graphical representations of data that allow you to communicate, in a simple and effective way, the information linked to it. The visualization possibilities are very extensive, from basic representations such as line graphs, bar graphs or relevant metrics, to…
- Data exercises
Synthetic Data - What are they? And what are they used for?
In the era of data, we face the challenge of a scarcity of valuable data for building new digital products and services. Although we live in a time when data is everywhere, we often struggle to access quality data that allows us to understand processes or systems from a data-driven perspective. The…
- Reports and studies

Good Practices for Measuring the Impact of Open Data in Europe
The Open Data Maturity Study 2022 provides a snapshot of the level of development of policies promoting open data in countries, as well as an assessment of the expected impact of these policies. Among its findings, it highlights that measuring the impact of open data is a priority, but also a major…
- Reports and studies
