12 documents found
Design and visualize road accident rates using D3.js
Introduction
Every year there are tens of thousands of accidents in Spain, in which thousands of people are injured of varying degrees, and which occur in very different circumstances, both in terms of the type of road and the type of accident.
Many of the statistics related to these parameters are…
- Data exercises

A practical introductory guide to exploratory data analysis in Python
The following presents a new guide to Exploratory Data Analysis (EDA) implemented in Python, which evolves and complements the version published in R in 2021. This update responds to the needs of an increasingly diverse community in the field of data science.
Exploratory Data Analysis (EDA)…
- Guides

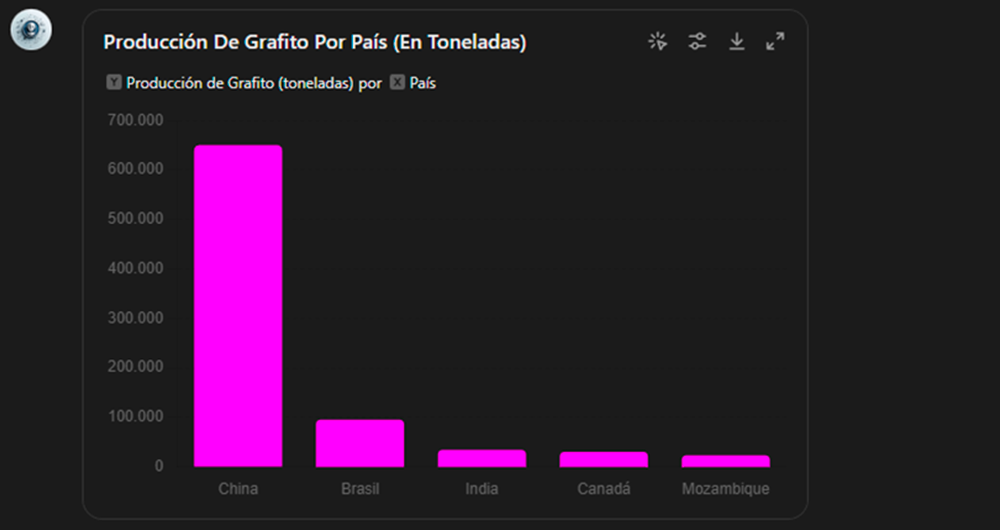
How to Create an Expert Assistant with Open Data: Building GPT to Answer the Critical Minerals Challenge
1. Introduction
In the information age, artificial intelligence has proven to be an invaluable tool for a variety of applications. One of the most incredible manifestations of this technology is GPT (Generative Pre-trained Transformer), developed by OpenAI. GPT is a natural language model…
- Data exercises
Data Visualisation Guide for Local Authorities
The FEMP's Network of Local Entities for Transparency and Citizen Participation has just presented a guide focused on data visualisation. The document, which takes as a reference the Guide to data visualisation developed by the City Council of L'Hospitalet, has been prepared based on the search for…
- Guides
A practical introductory guide to exploratory data analysis
Before performing data analysis, for statistical or predictive purposes, for example through machine learning techniques, it is necessary to understand the raw material with which we are going to work. It is necessary to understand and evaluate the quality of the data in order to, among other…
- Guides
Data processing and visualization tools
Visualization is critical for data analysis. It provides a first line of attack, revealing intricate structures in data that cannot be absorbed otherwise. We discover unimaginable effects and question those that have been imagined."
William S. Cleveland (de Visualizing Data, Hobart Press)
Over the…
- Reports and studies
How to integrate a visualization tool into a data platform
The saying "a picture is worth a thousand words" is a clear example of popular wisdom based on science. 90% of the information we process is visual, thanks to a million nerve fibers that link the eye to the brain and more than 20,000 million neurons that perform the processing of the impulses…
- Guides

Open Data and Smart Cities Report: an alternative legal perspective
The commitment to so-called smart cities is currently one of the major commitments to technological innovation in the public sector, especially in the local sphere. This type of initiative aims to address challenges to sustainability in the urban context and, through the advanced use of information…
- Reports and studies

Open data representation vocabulary in Digital Cities
As a result of transparency and citizen participation demand, an increasing number of towns are focus on initiatives that facilitate citizen access to institutions and administrations´ information. However, defining, implementing and documenting an open data policy could be a challenging issue.…
- Reports and studies

Informe: Datos abiertos, herramienta para el desarrollo de las Smart Cities
Gestión sostenible, eficiencia, mejores servicios para los ciudadanos y nuevas oportunidades de negocio son algunas de las bases sobre las que se sustentan las Smart Cities. El equipo de datos.gob.es ha elaborado un informe específico donde se analiza la importancia de los datos abiertos para la…
- Informes y estudios