21 documents found
Datos en tiempo real: Enfoques para integrar fuentes de datos en tiempo real en data.europa.eu
Este informe, que publica el Portal de Datos Europeo, analiza el potencial de reutilización de los datos en tiempo real. Los datos en tiempo real ofrecen información con alta frecuencia de actualización sobre el entorno que nos rodea (por ejemplo, información sobre el tráfico, datos…
- Reports and studies
Characteristics of the Spanish University students and most demanded degrees
1. Introduction
Visualizations are graphical representations of data that allow to transmit in a simple and effective way the information linked to them. The visualization potential is very wide, from basic representations, such as a graph of lines, bars or sectors, to visualizations configured on…
- Data exercises

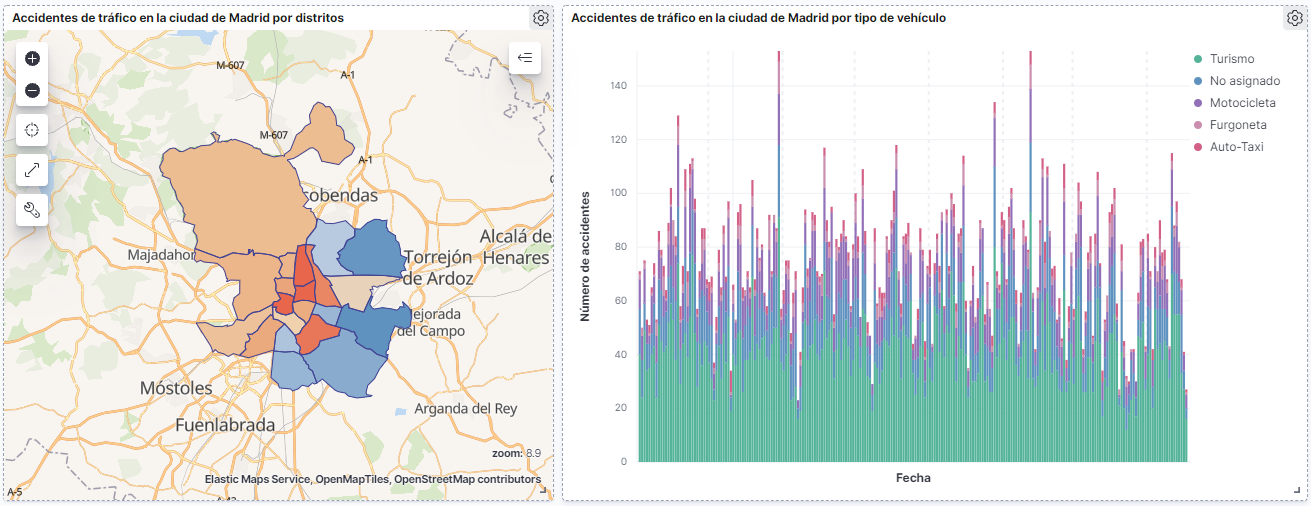
How many accidents occur in the city of Madrid?
1. Introduction
Data visualization is a task linked to data analysis that aims to graphically represent underlying data information. Visualizations play a fundamental role in the communication function that data possess, since they allow to drawn conclusions in a visual and understandable way,…
- Data exercises
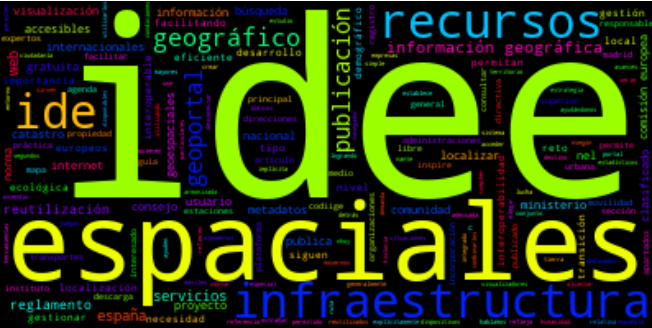
Creating word clouds from the text data with NLP techniques
1. Introduction
Visualizations are a graphic representation that allow us to comprehend in a simple way the information that the data contains. Thanks to visual elements, such as graphs, maps or word clouds, visualizations also help to explain trends, patterns, or outliers that data may present.…
- Data exercises
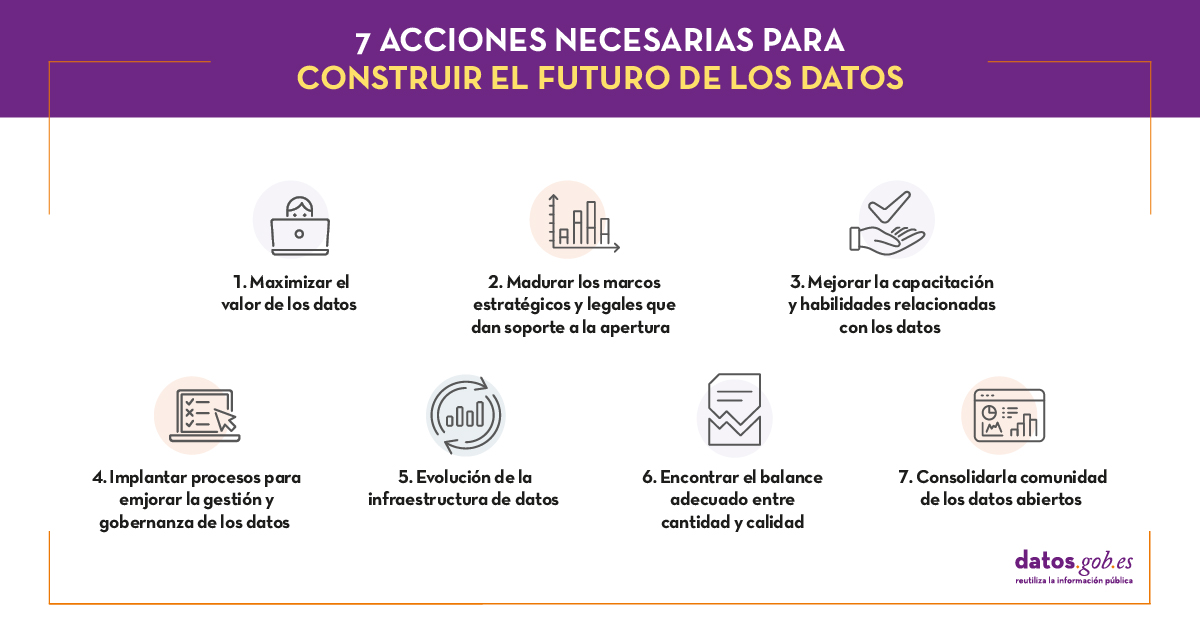
The future of open data
"Information and data are more valuable when they are shared and the opening of government data could allow [...] to examine and use public information in a more transparent, collaborative, efficient and productive way". This was, in general terms, the idea that revolutionized more than ten years…
- Reports and studies
Characterization of the employment demand and registered contracting in Spain
1. Introduction
Data visualization is a task linked to data analysis that aims to represent graphically the underlying information. Visualizations play a fundamental role in data communication, since they allow to draw conclusions in a visual and understandable way, also allowing detection of…
- Data exercises

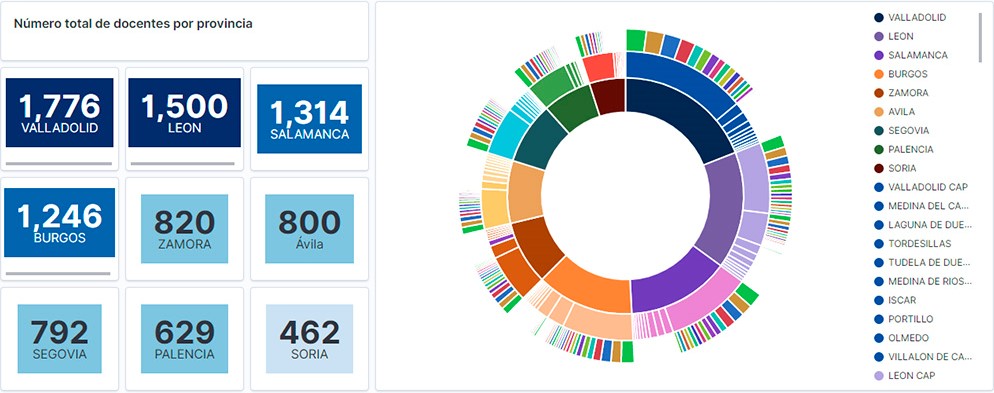
Teachers of public schools in Castilla y León
1. Introduction
Data visualization is a task linked to data analysis that aims to graphically represent underlying data information. Visualizations play a fundamental role in the communication function that data possess, since they allow to drawn conclusions in a visual and understandable way,…
- Data exercises
Data processing and visualization tools
Visualization is critical for data analysis. It provides a first line of attack, revealing intricate structures in data that cannot be absorbed otherwise. We discover unimaginable effects and question those that have been imagined."
William S. Cleveland (de Visualizing Data, Hobart Press)
Over the…
- Reports and studies
Emerging Technologies and Open Data: Predictive Analytics
In order to extract the full value of data, it is necessary to classify, filter and cross-reference it through analytics processes that help us draw conclusions, turning data into information and knowledge. Traditionally, data analytics is divided into 3 categories:
Descriptive analytics, which…
- Reports and studies

Data-driven education technology to improve learning in the classroom and at home
The pandemic that originated last year has brought about a significant change in the way we see the world and how we relate to it. As far as the education sector is concerned, students and teachers at all levels have been forced to change the face-to-face teaching and learning methodology for a…
- Reports and studies